Inspiration
Parkinson's disease affects over 10 million people worldwide, yet most cases go undetected until symptoms are severe. Getting a neurology appointment can cost hundreds of dollars, and waiting lists can stretch for months (assuming someone even recognizes the early signs in the first place). We built NeuroDrift so people can screen themselves at home and show up to any doctor's appointment with real clinical data already in hand!
What it does
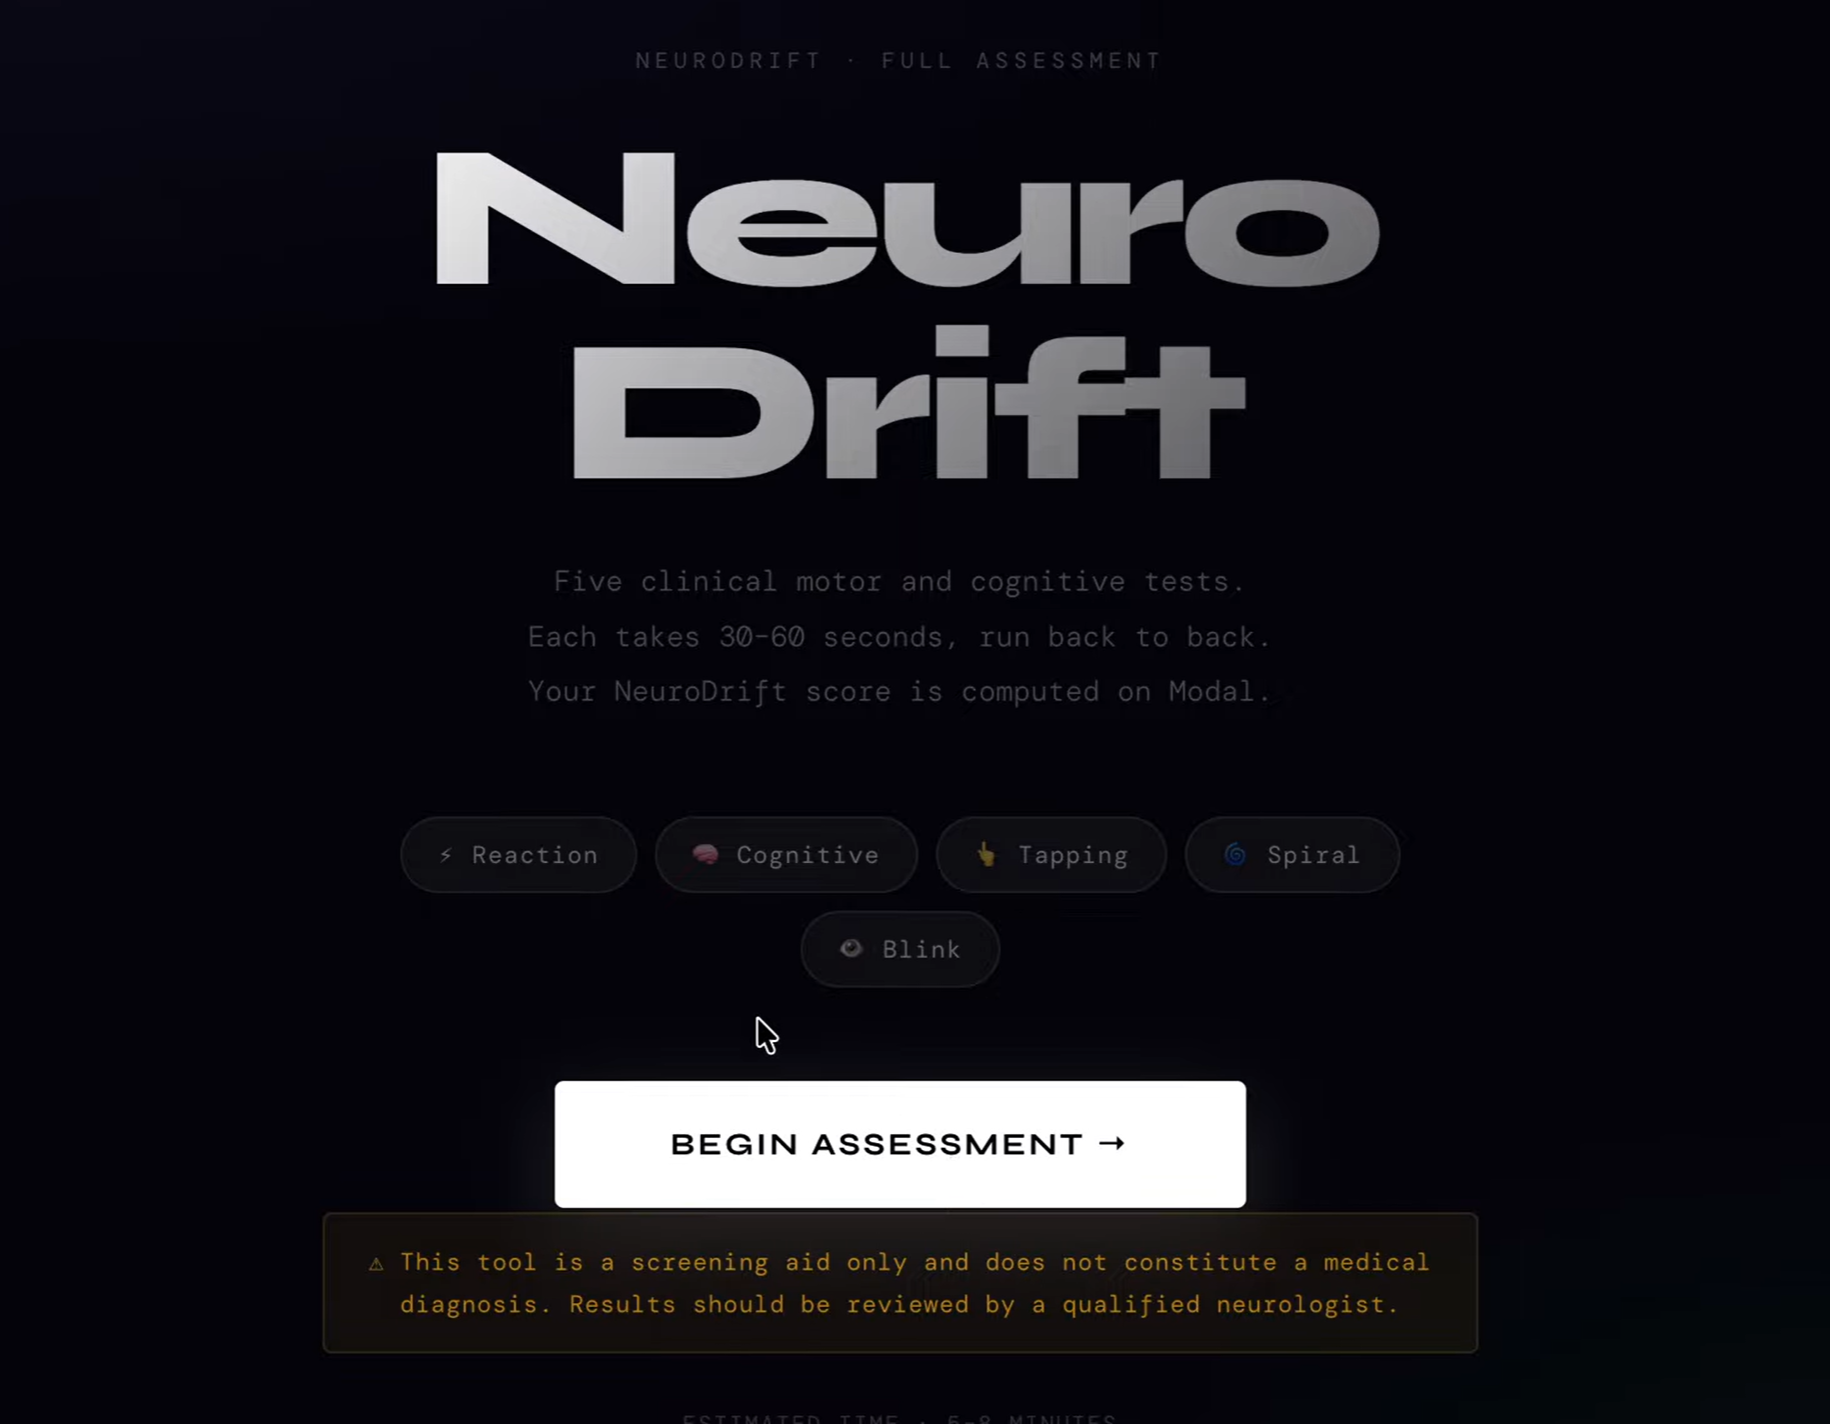
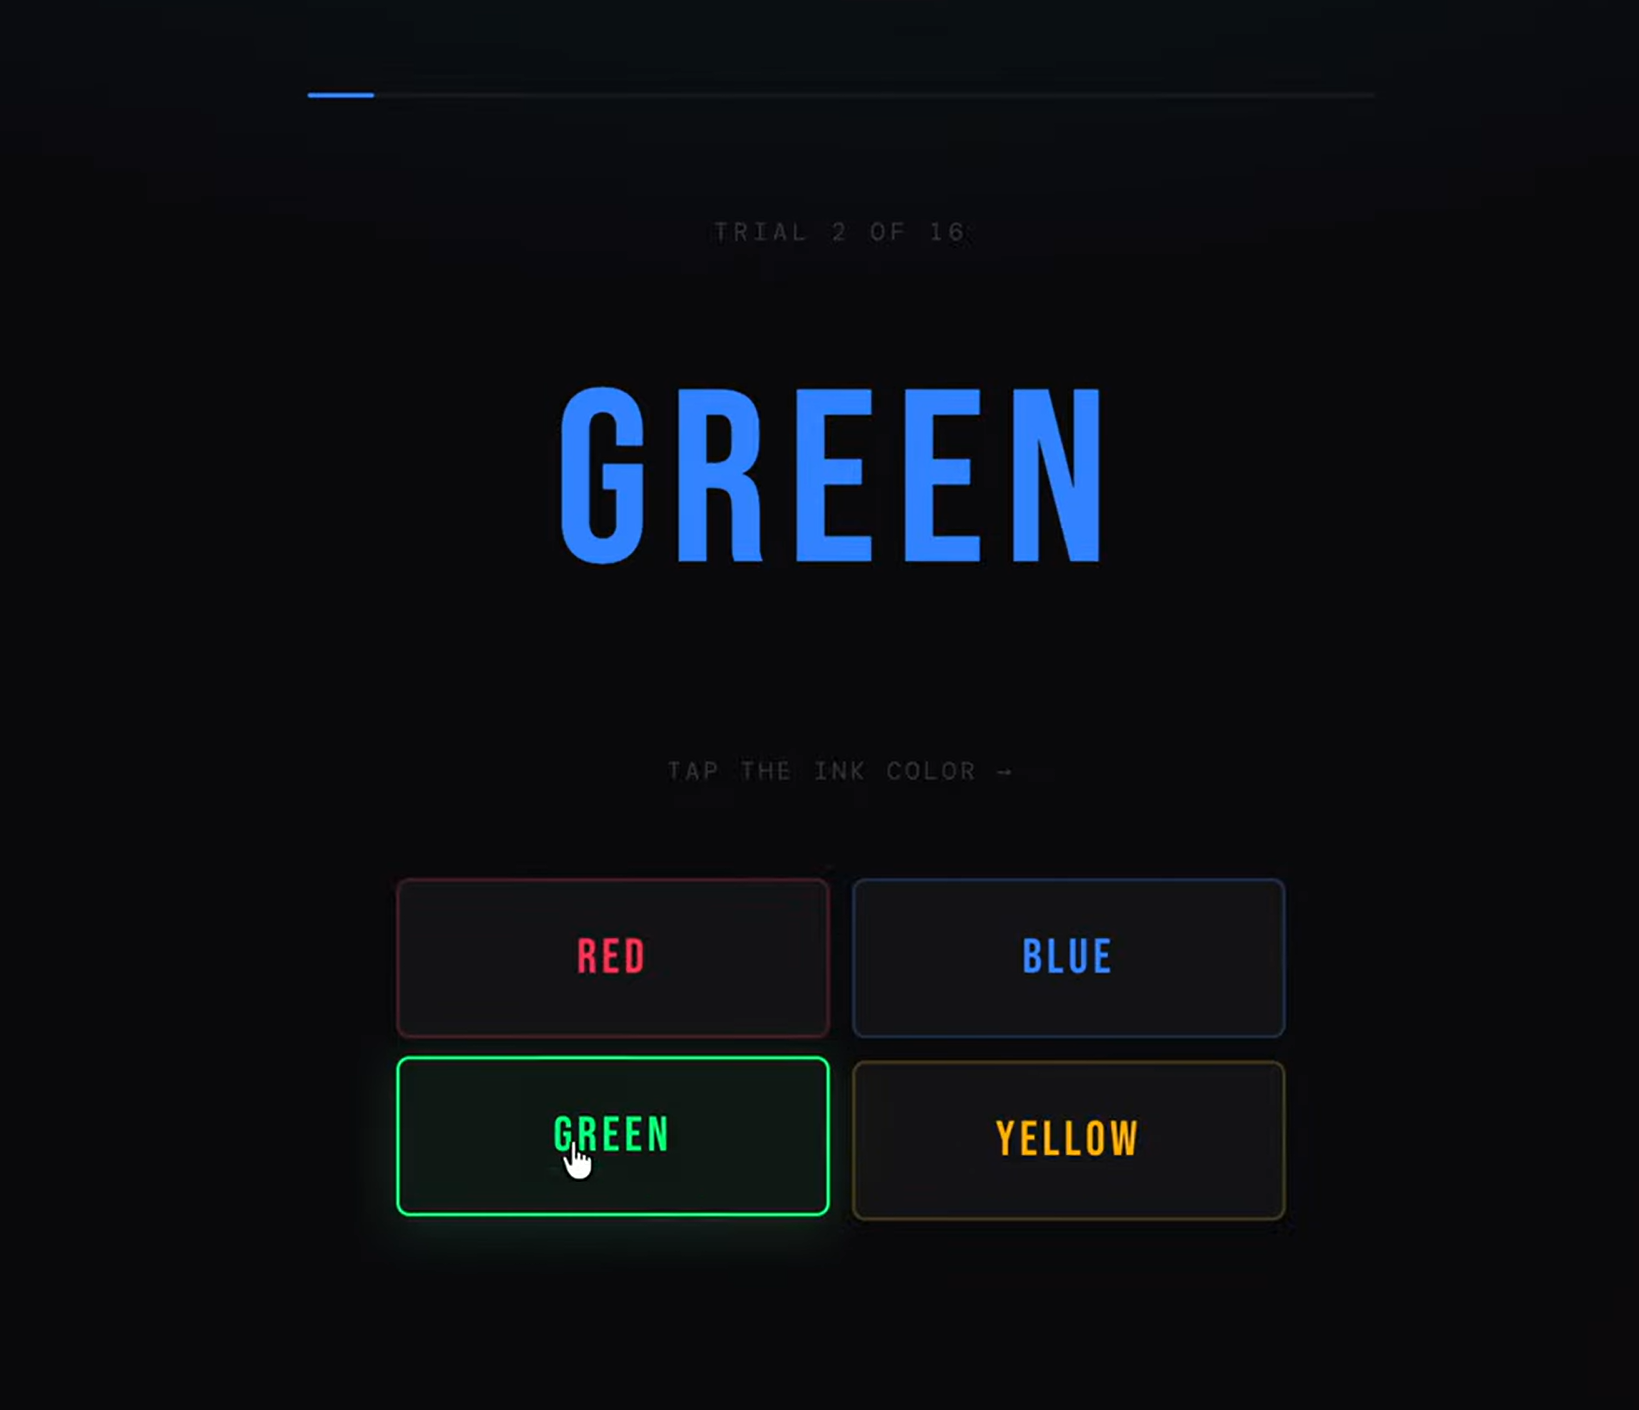
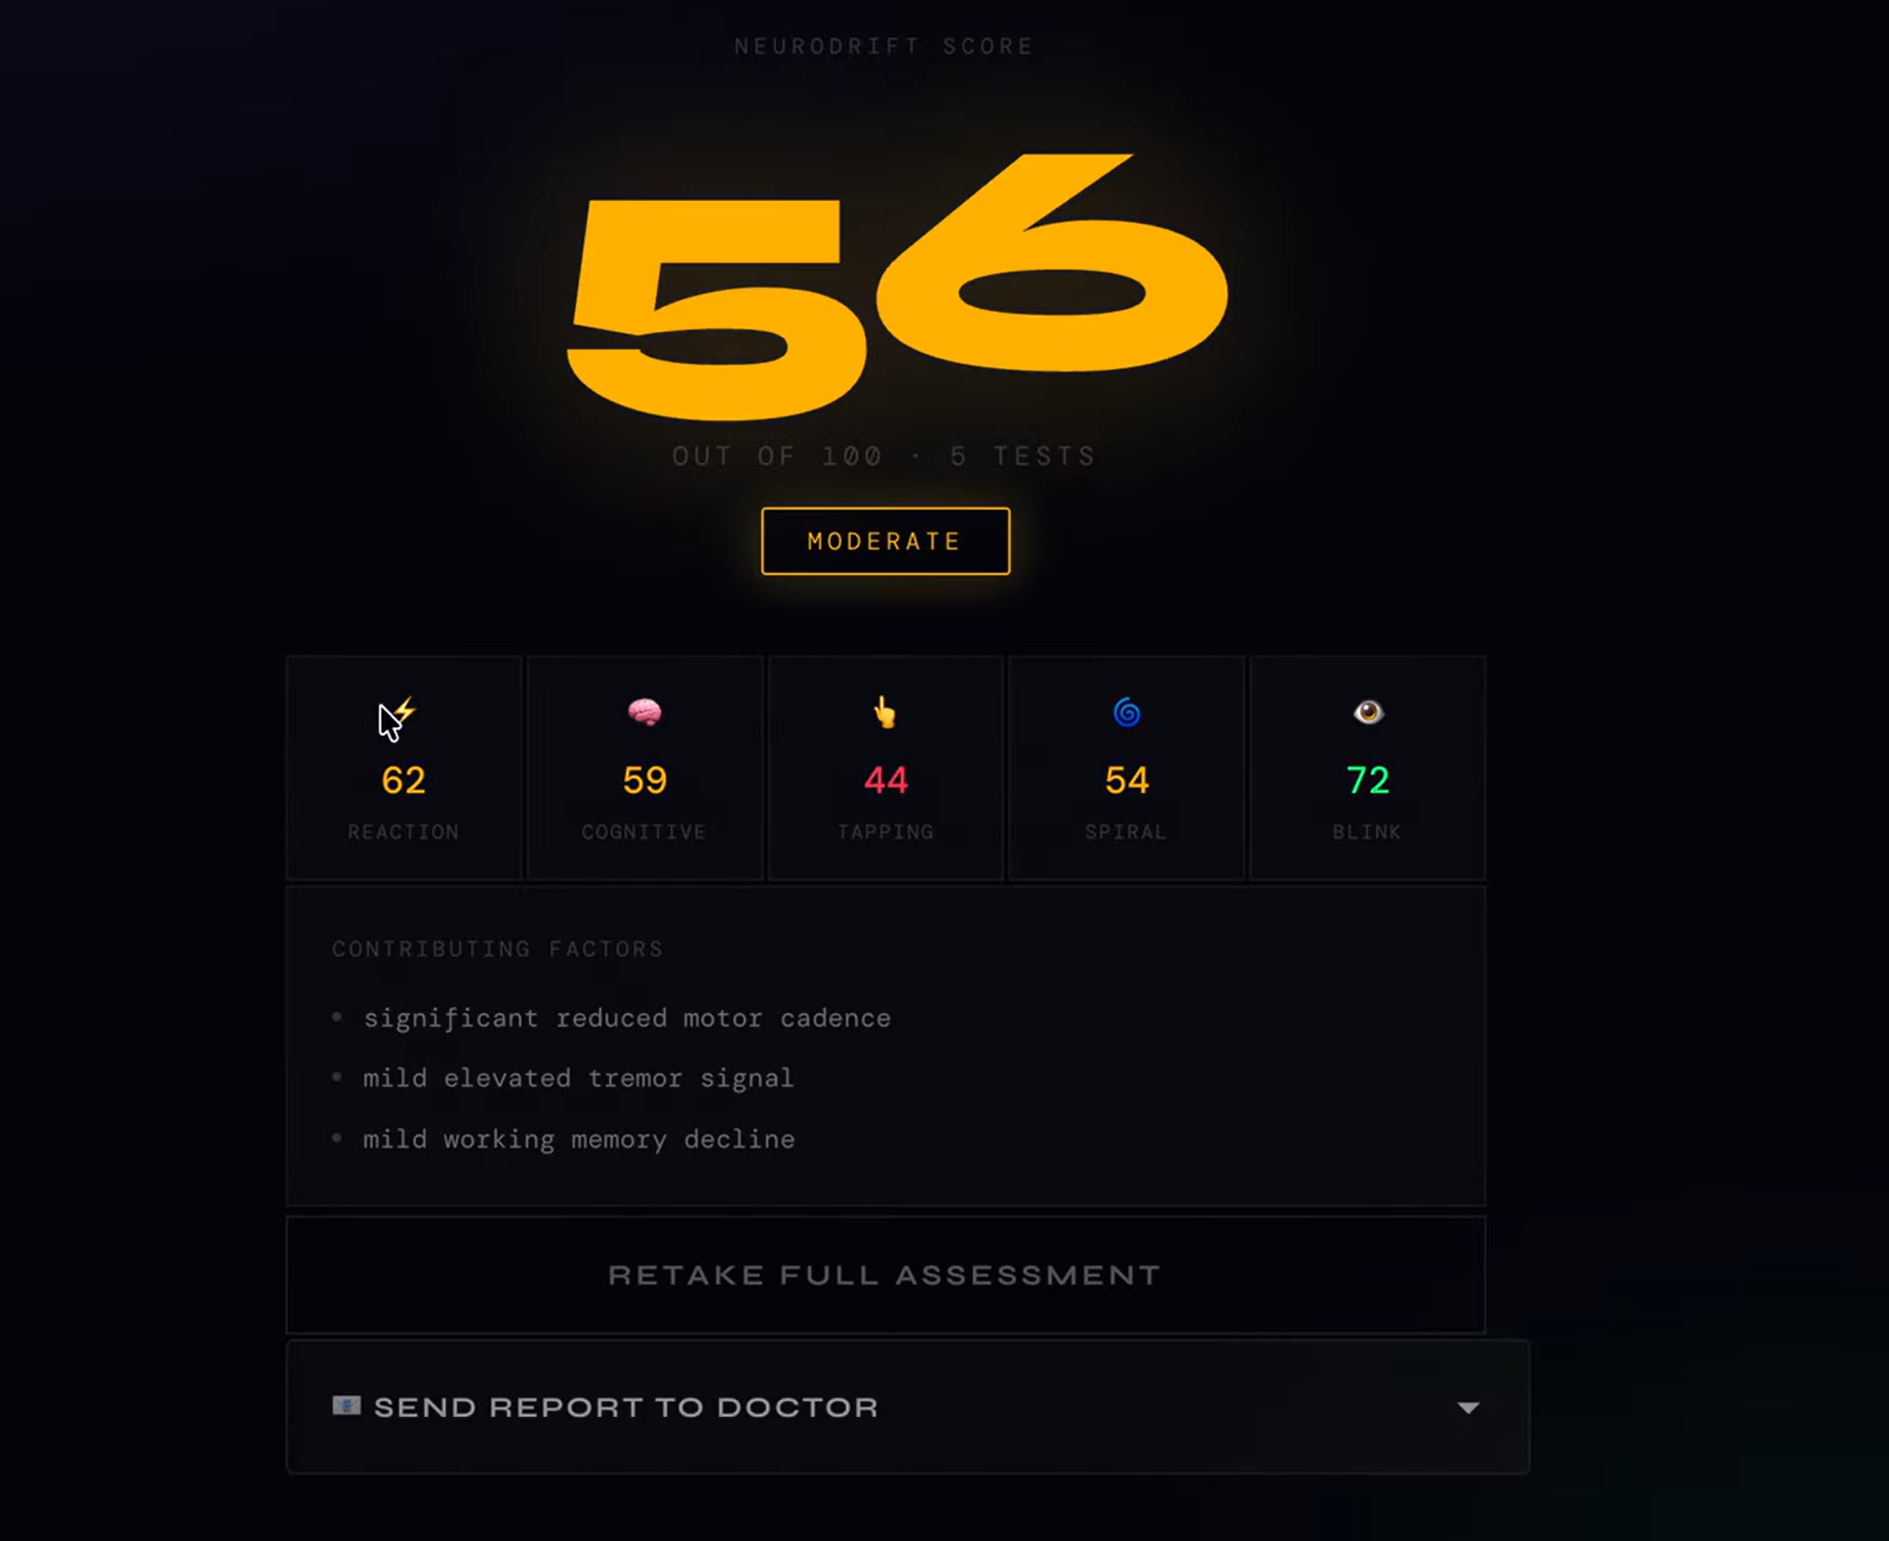
NeuroDrift is a Parkinson's screening tool that uses computer vision and signal processing to detect early patterns associated with Parkinson's disease. Users complete 5 short tests (blink detection, spiral drawing, finger tapping, reaction time, and a cognitive Stroop assessment) and receive a structured clinical report that patients can email directly to their doctor before their appointment. All inference runs in parallel on Modal's serverless cloud infrastructure using numpy and scipy for real-time signal processing, and the results are ultimately combined into a single NeuroDrift score (0–100).
How we built it
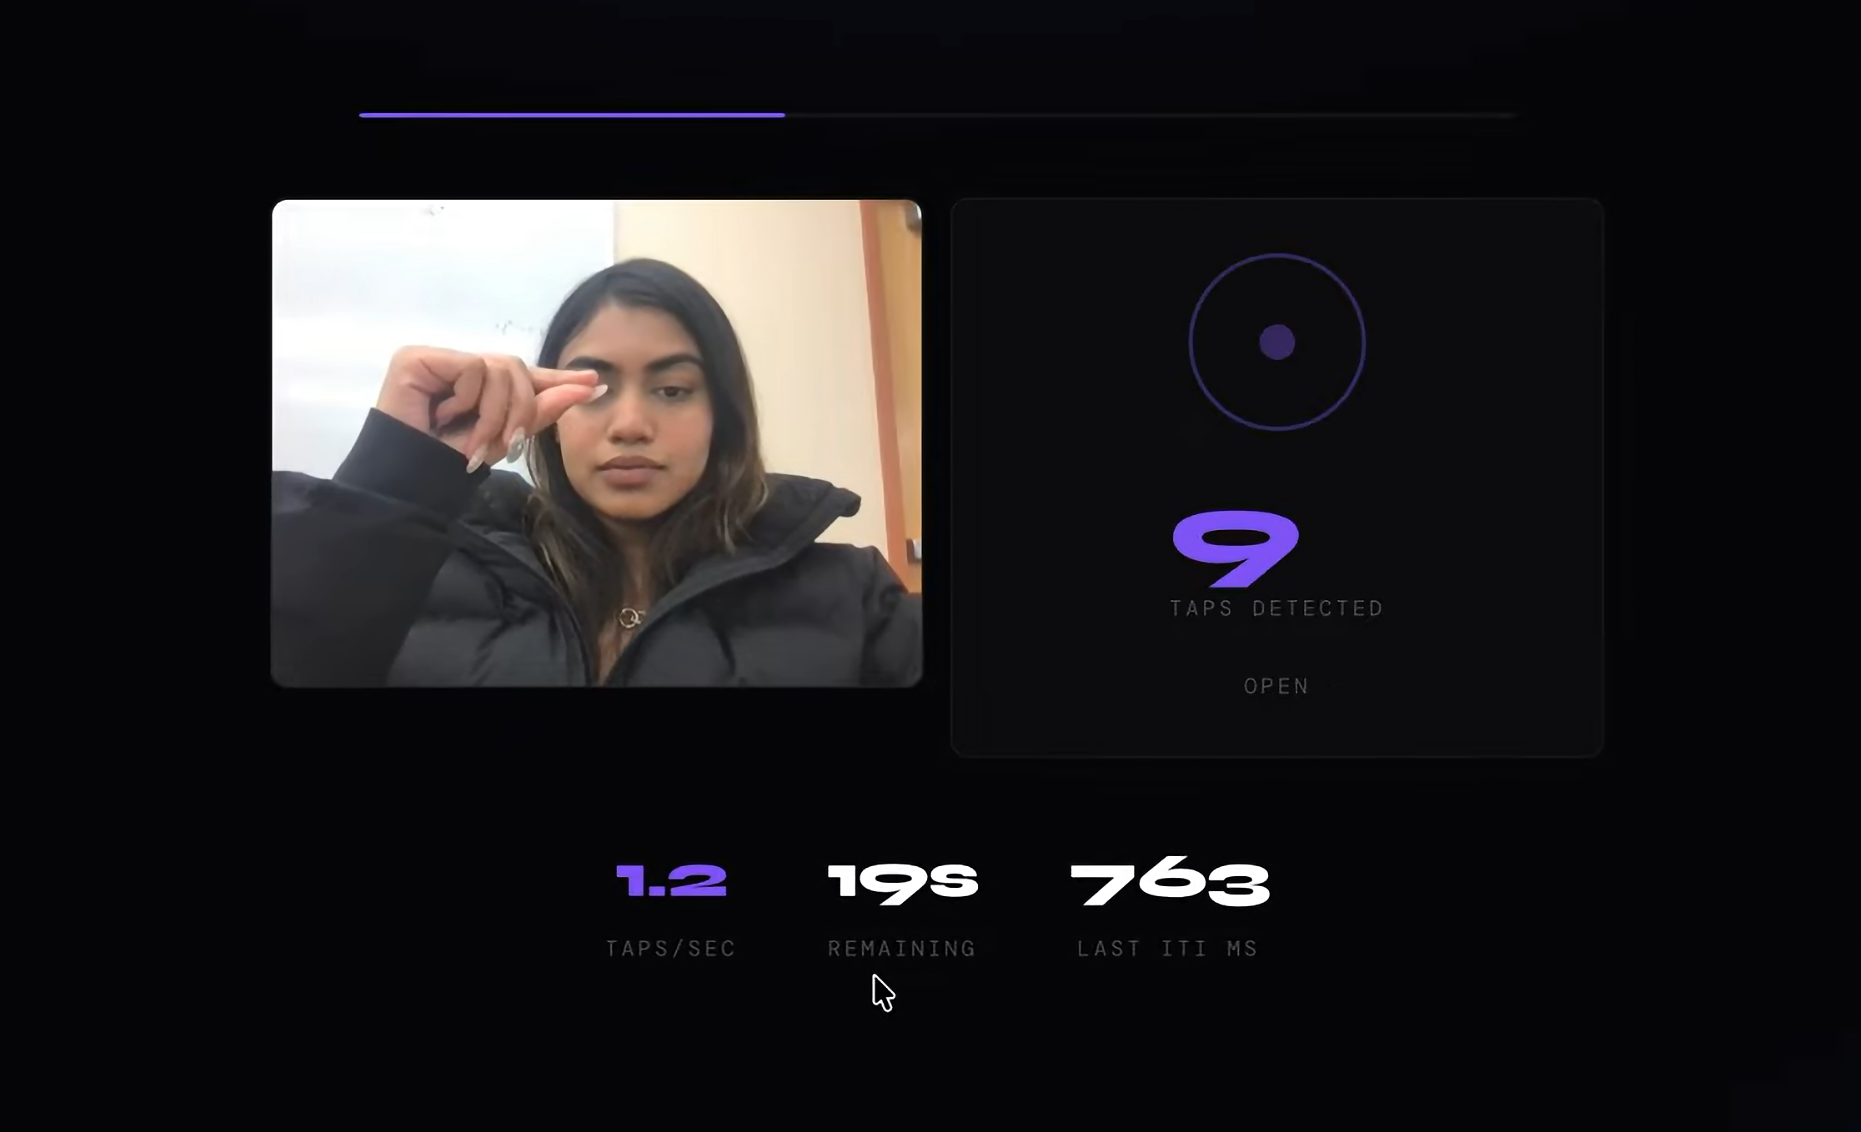
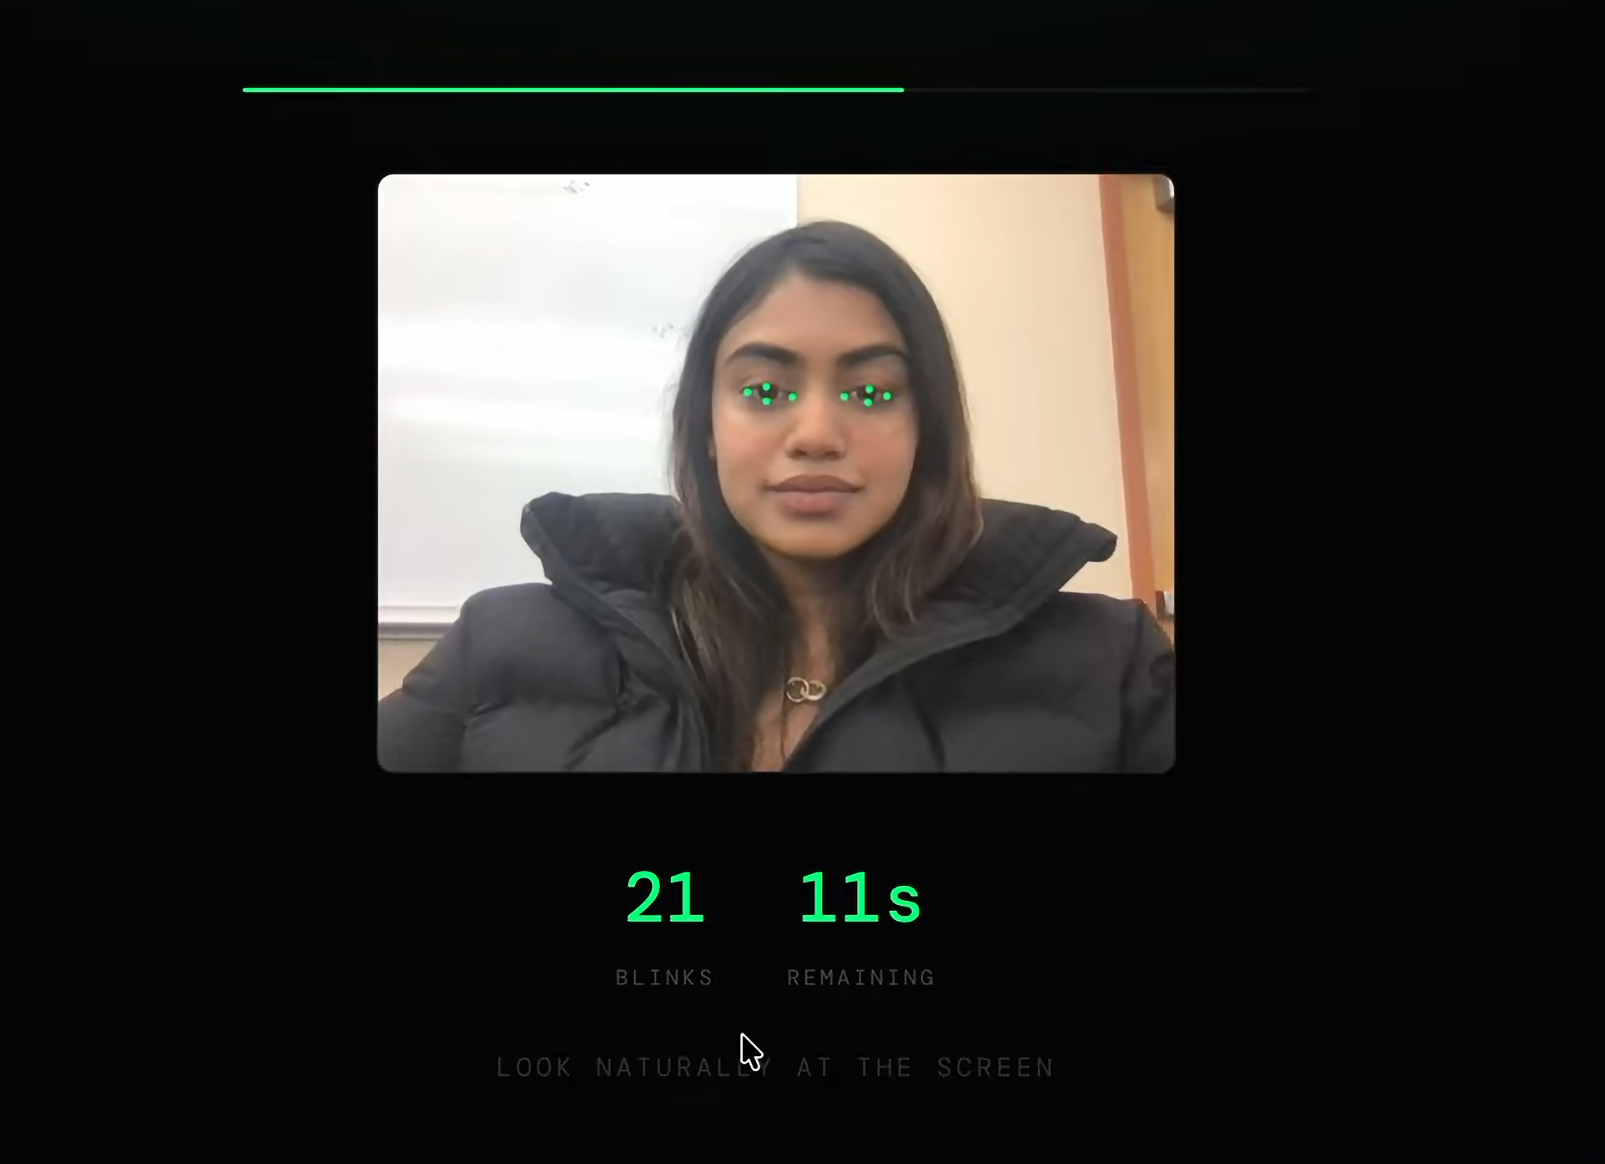
The frontend is built in Next.js with 5 custom test pages. Each test captures raw signals directly in the browser using either the browser's built-in pointer and timing APIs or MediaPipe for computer vision tasks like blink detection and finger tracking.
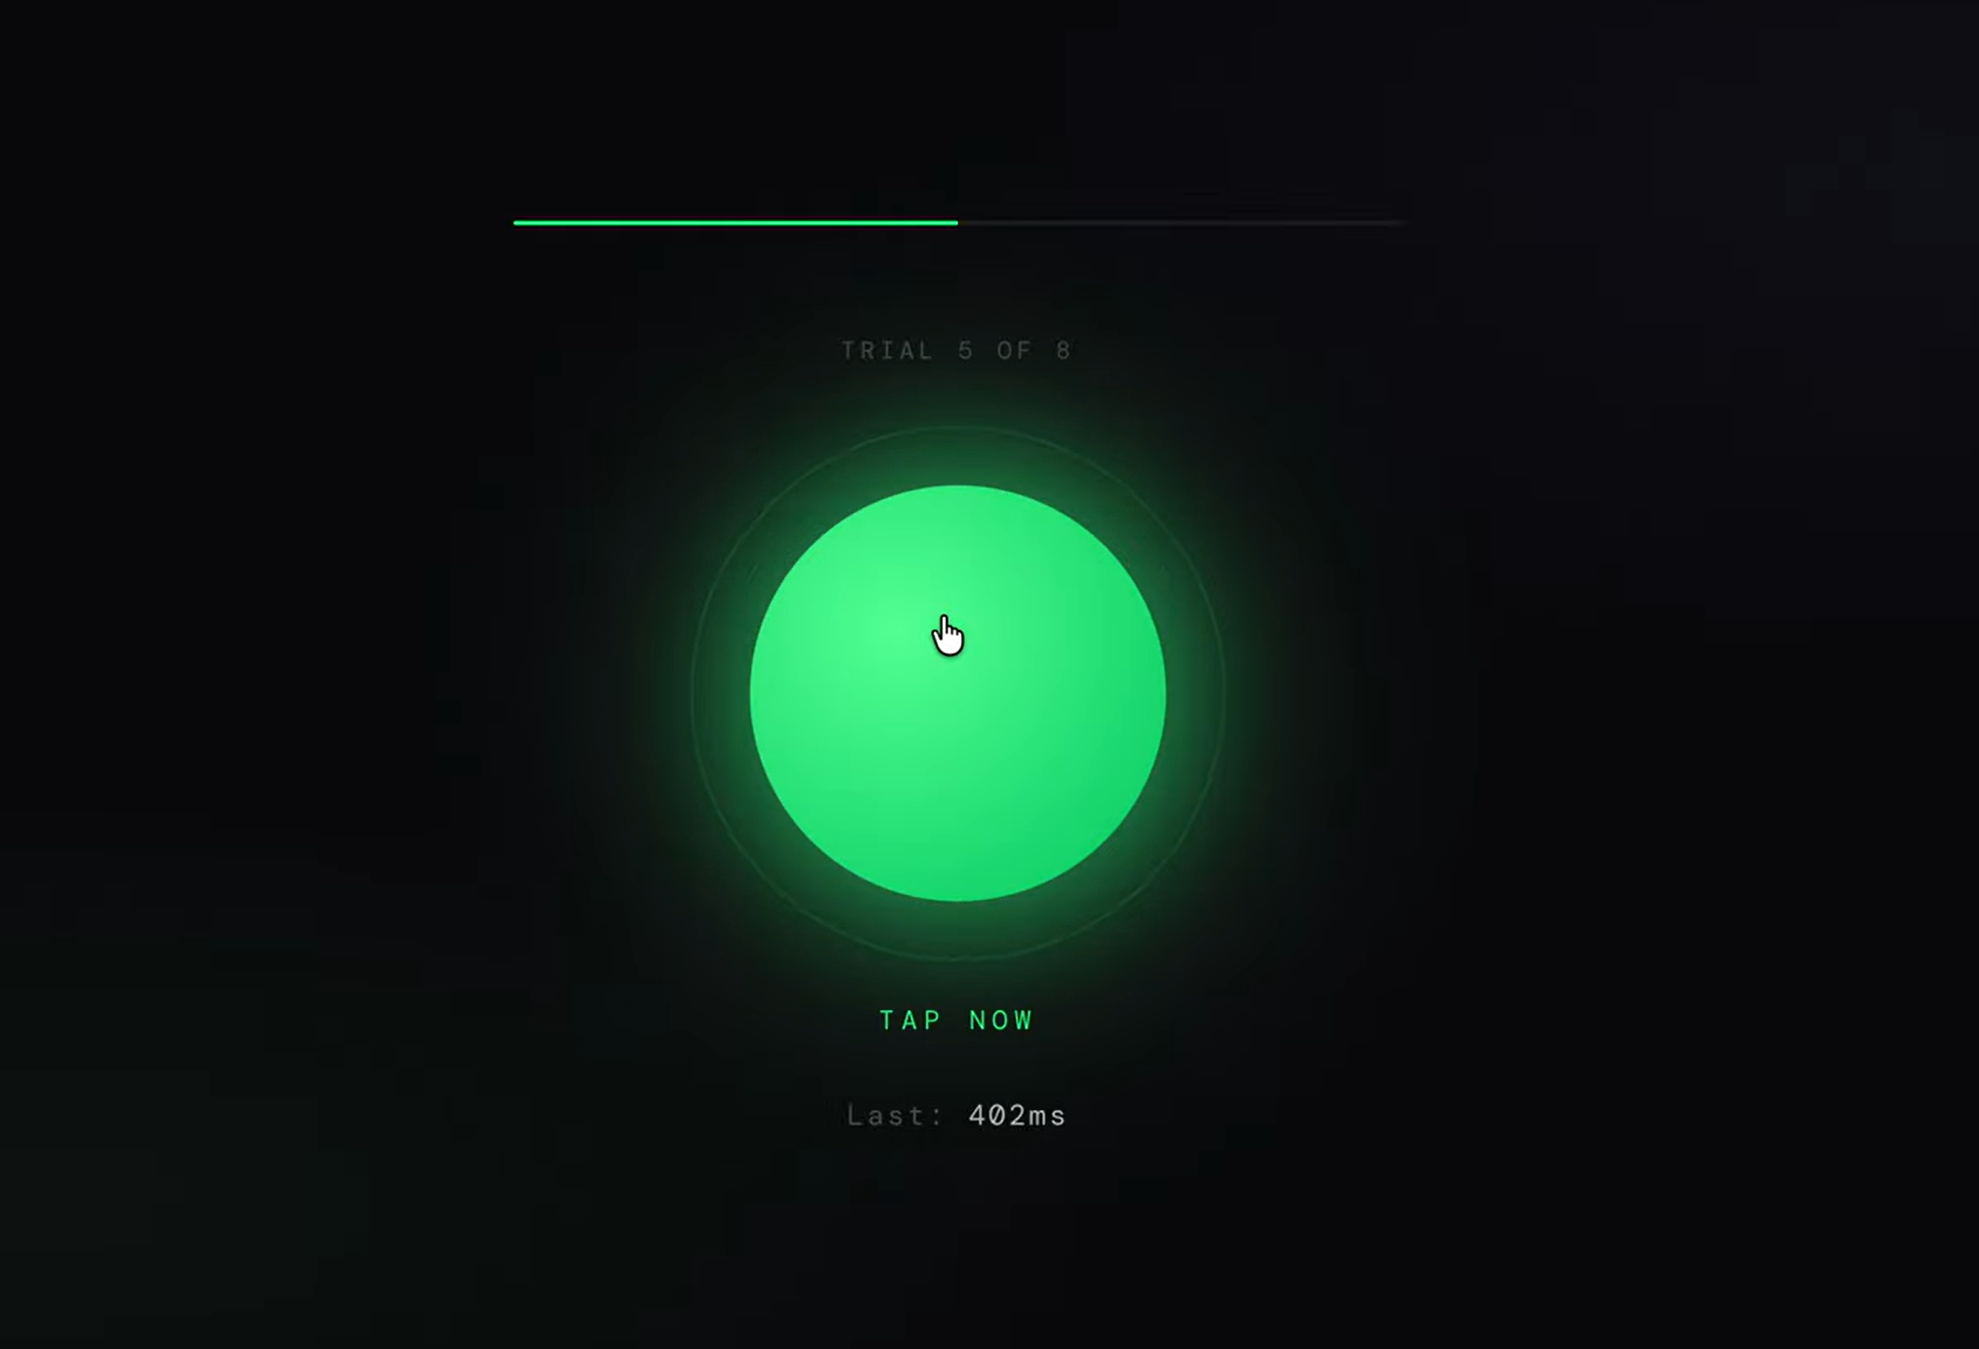
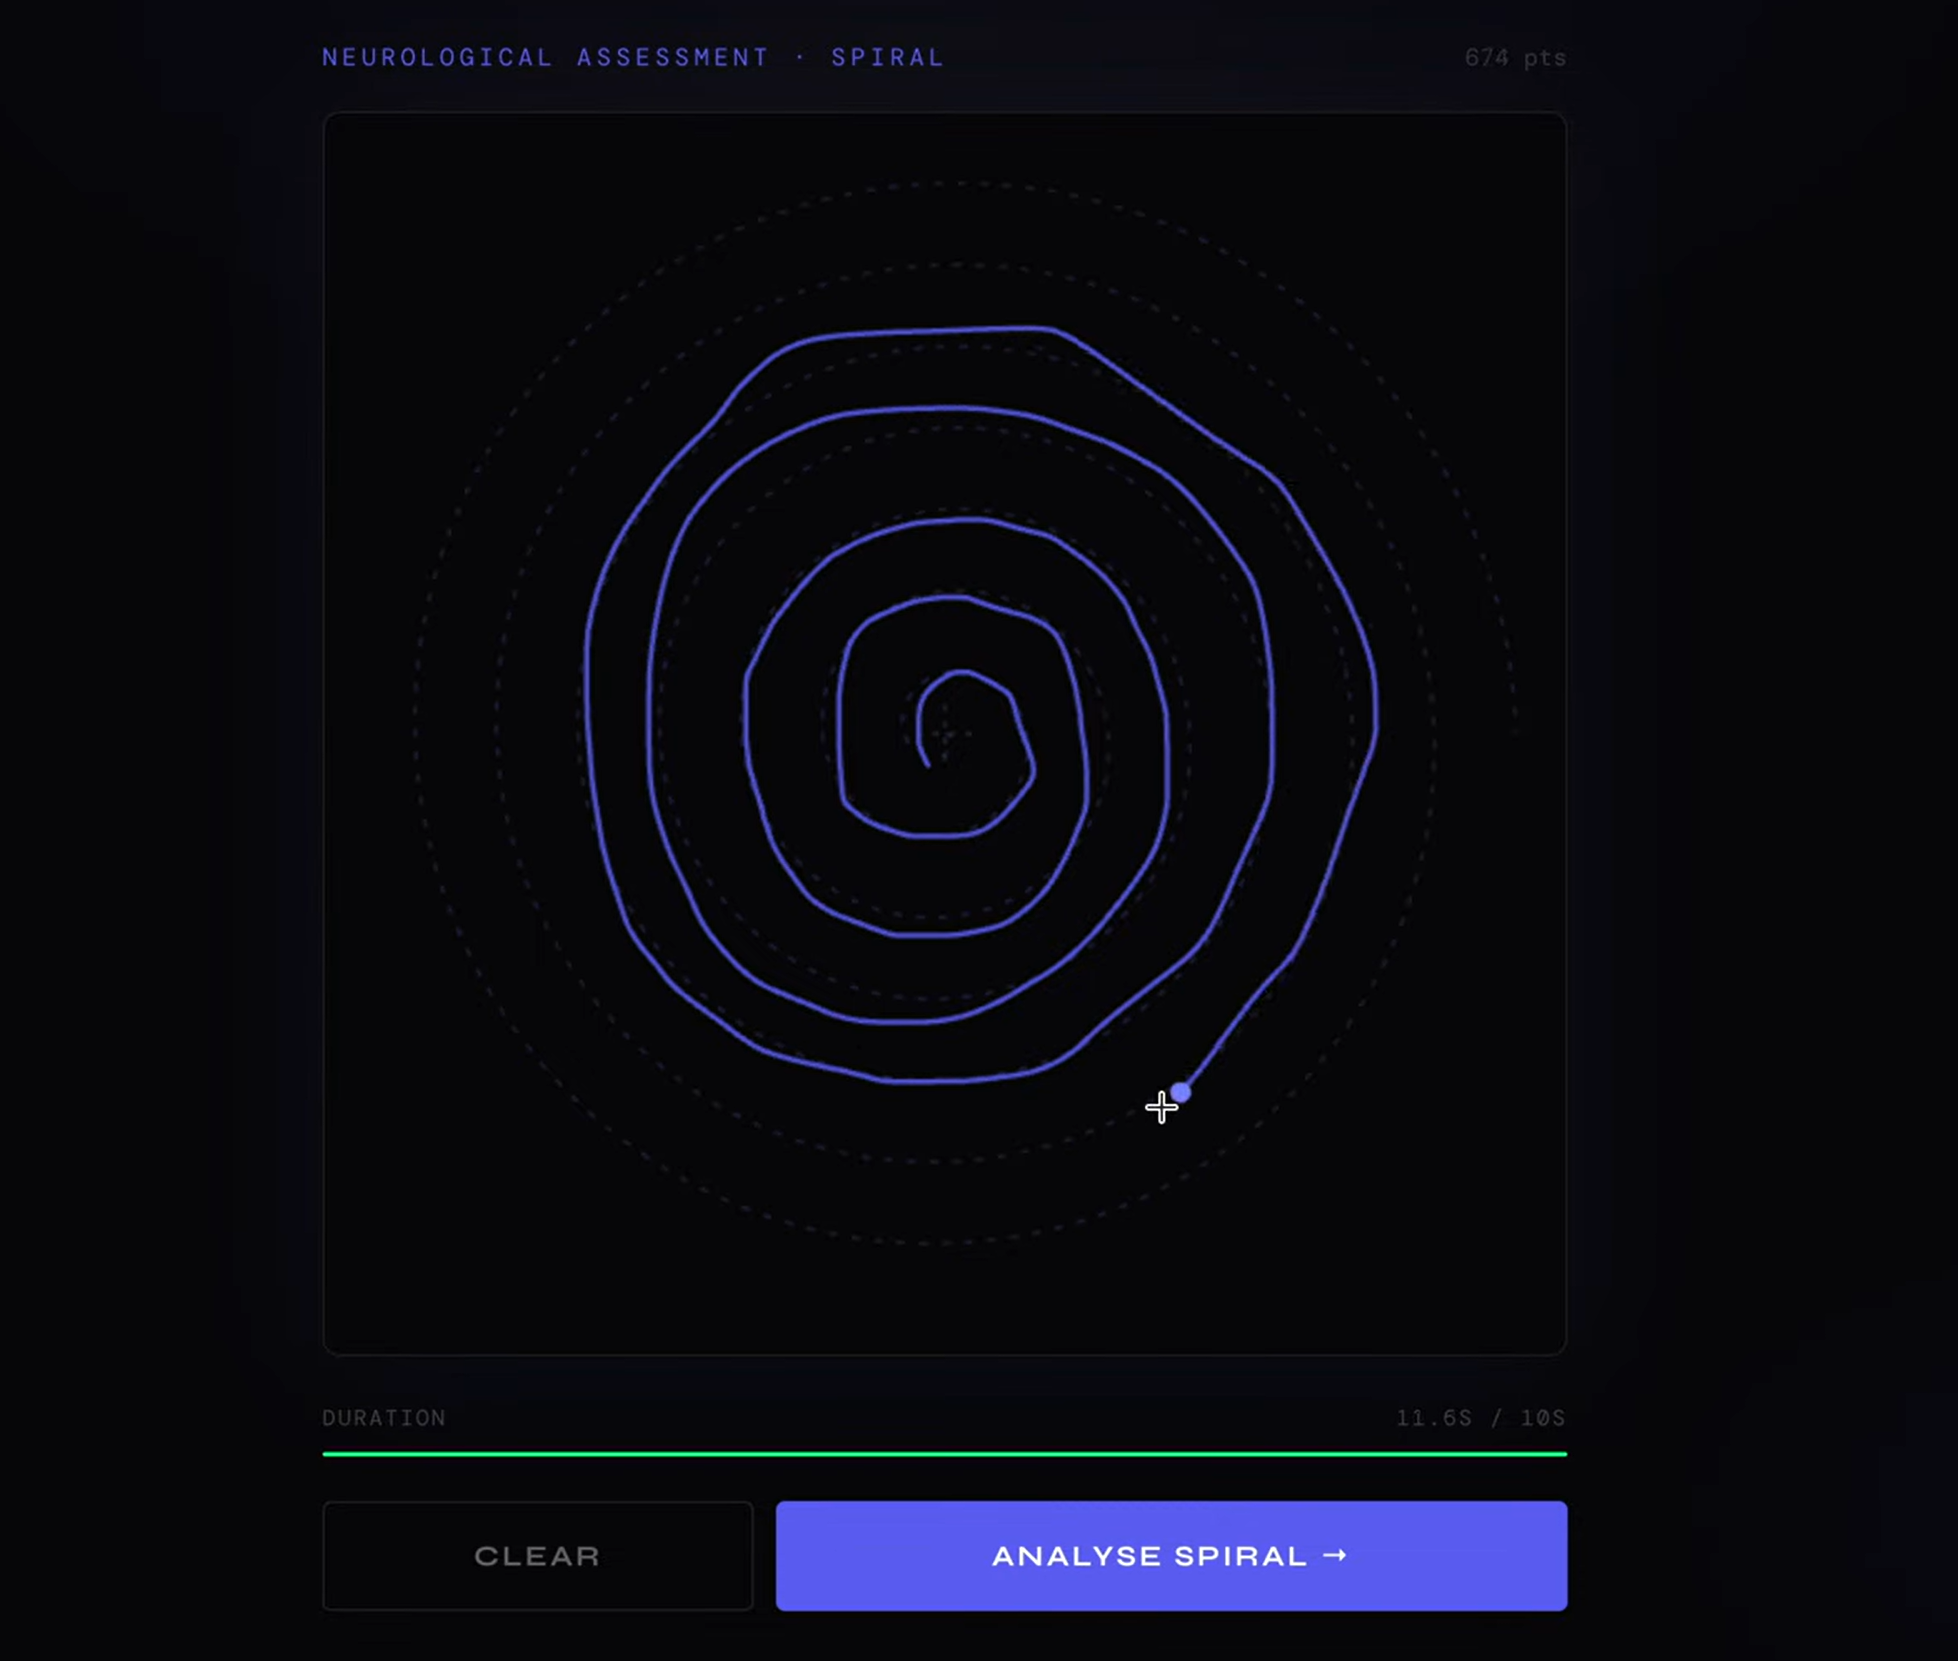
That raw data gets sent to Modal in the cloud, where the analysis happens. The spiral and blink tests analyze frequency patterns in the signal to detect tremor, tapping measures the consistency of your rhythm over time, the Stroop test looks at how your reaction time changes under cognitive pressure, and the reaction test uses percentile-based scoring to catch outliers. We used Modal because this kind of signal processing is too intensive to run in the browser.
The 5 scores get fused using weighted averaging based on published clinical research. Tapping and spiral carry the most weight at 25% each because motor signal degradation is the earliest and most reliable Parkinson's symptom. Reaction time and the cognitive test at 20% each, and blink rate at 10%. Everything outputs to the frontend in a single Modal response with the final score, risk level, and a full breakdown of contributing factors.
Challenges we ran into
One challenge we had was how we had to carefully calibrate our scoring thresholds against clinically established baselines so results were meaningful without being alarming, especially since our users could be people with no medical background. It was also hard to account for error margins (EX, in the blink test, it was difficult to account for fast blinks), so we had to adjust the thresholds accordingly. We also had trouble combining our components together onto a singular dashboard, as we each were assigned to work on a different test.
Accomplishments that we're proud of
- Built a full end-to-end pipeline in a weekend, from raw input to a clinical report
- Got 5 completely different tests working and integrated into one unified score
- Figured out how to present medical data responsibly to a general audience
What we learned
- We learned a lot about Modal's serverless architecture and how to deploy and scale cloud functions around real world problems.
- How MediaPipe face mesh and hand tracking work, and how to extract meaningful clinical signal from raw data.
- We learned lot about the background of Parkinson's disease and how to identify it, particularly how motor symptoms show up in measurable ways years before a clinical diagnosis.
What's next
- Longitudinal tracking so users can monitor their scores over time and see gradual changes.
- Expanding beyond Parkinson's to other neurological conditions like Alzheimer's.
- Getting the scoring validated by actual neurologists.


Log in or sign up for Devpost to join the conversation.