-
-
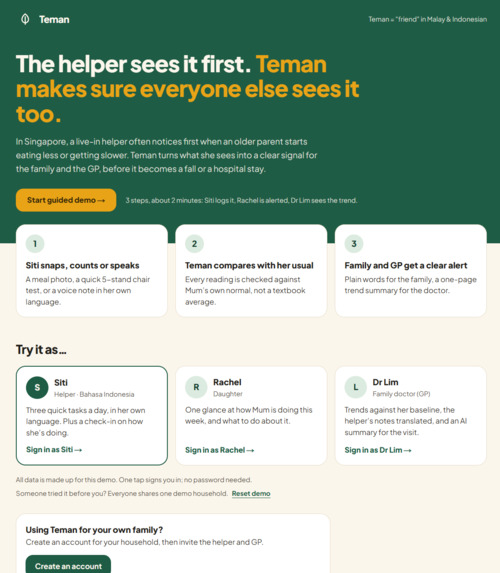
Demo workflow
-
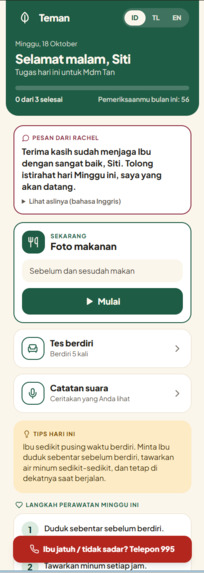
Helper View
-
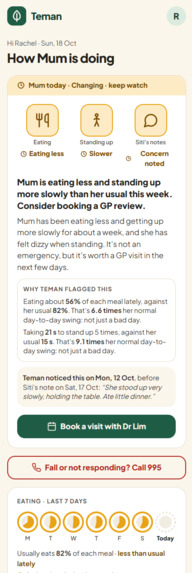
Daughter View
-
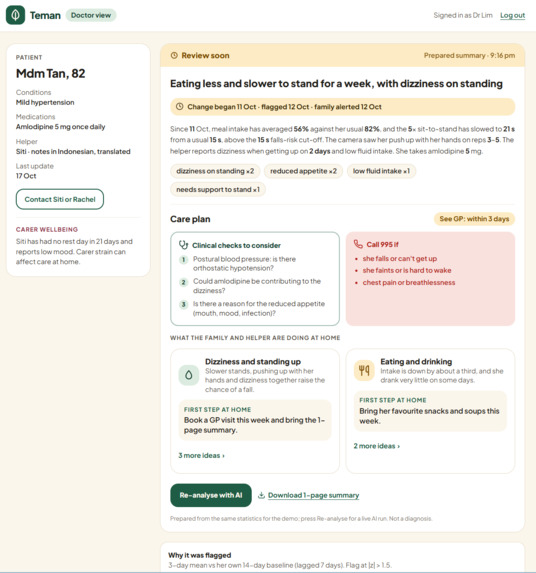
Doctor View
-
Analyse with AI
Inspiration
In Singapore, it's common for an elderly parent to be cared for by a live-in domestic helper while the adult children work full-time. The helper is often the person who notices first — Mum's eating less, she's slower getting out of her chair, she mentioned feeling dizzy. But that observation usually goes nowhere useful: it's across a language barrier, it's not written down anywhere, and by the time the family notices something's off, it can already be a fall or a hospital admission.
We wanted to turn what the helper already sees every day into a signal the rest of the care circle can actually act on — without asking her to become a data-entry clerk, and without pretending an app can diagnose anything.
What it does
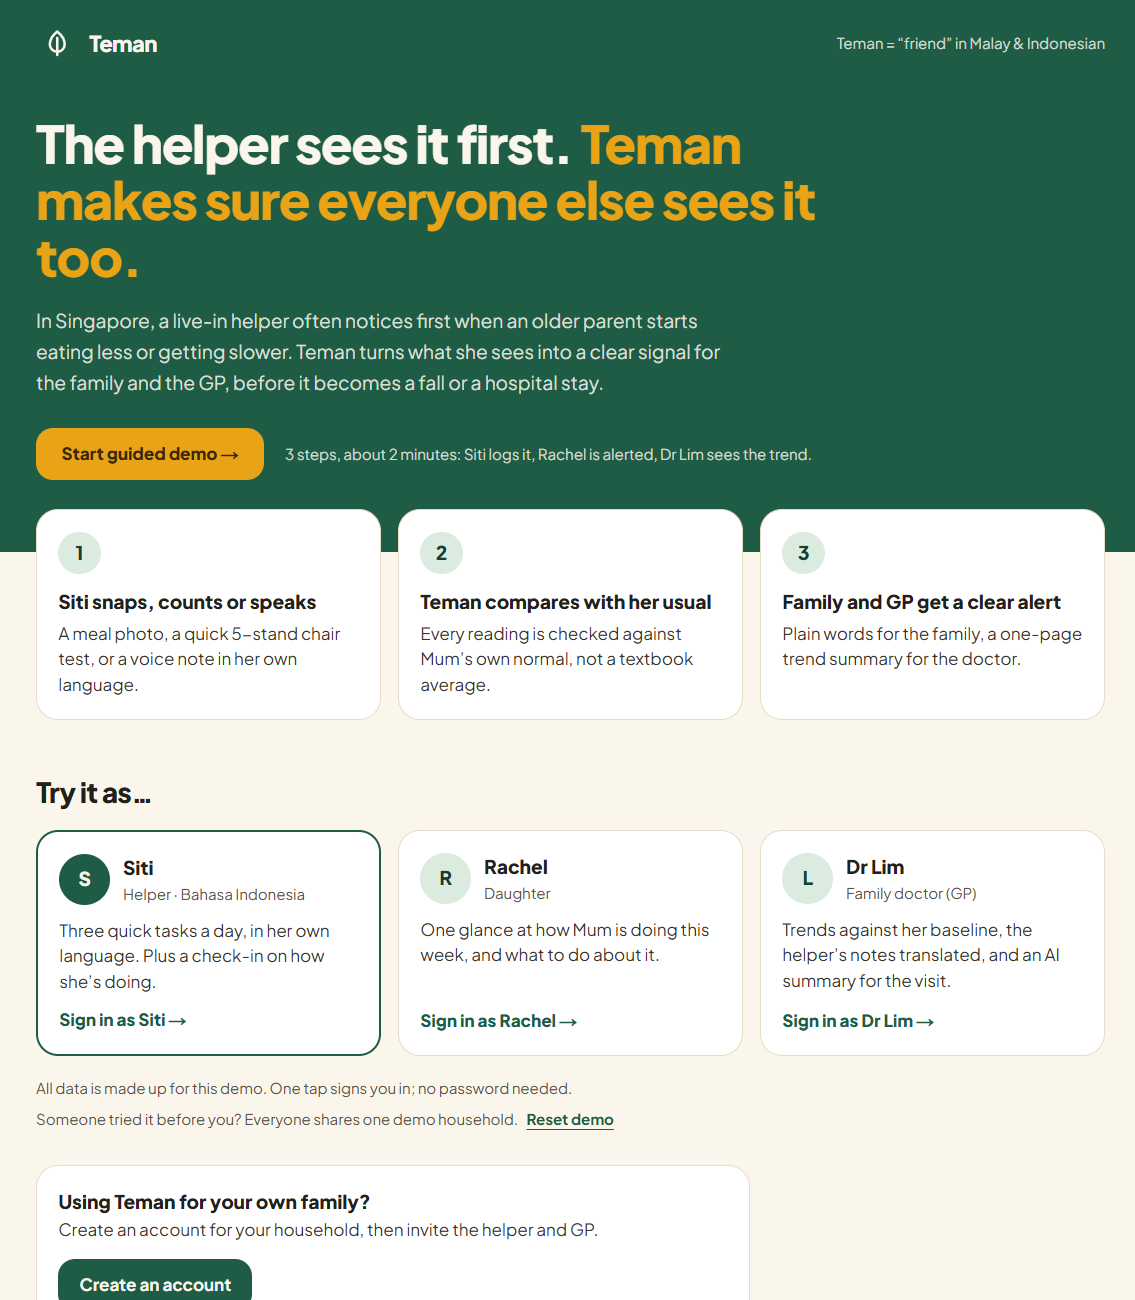
Teman gives each person in the care circle the view they actually need, from one shared stream of daily signals:
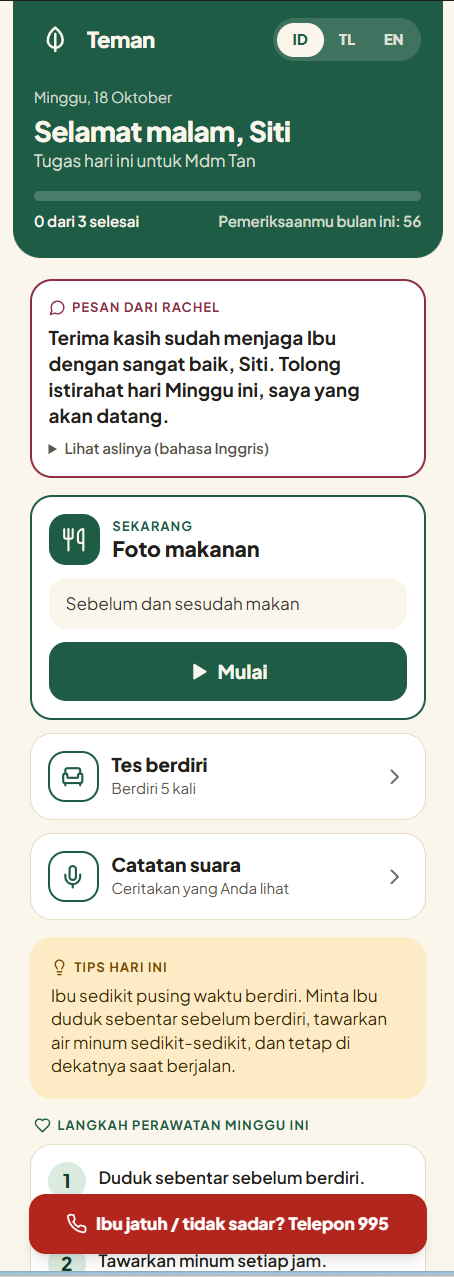
- Siti (the helper) logs three quick things a day, in her own language: a before/after meal photo, a 5-times chair-stand timer, and a voice or typed note. Teman also checks in on her — mood and rest days — because caregiver burnout quietly degrades the quality of care.
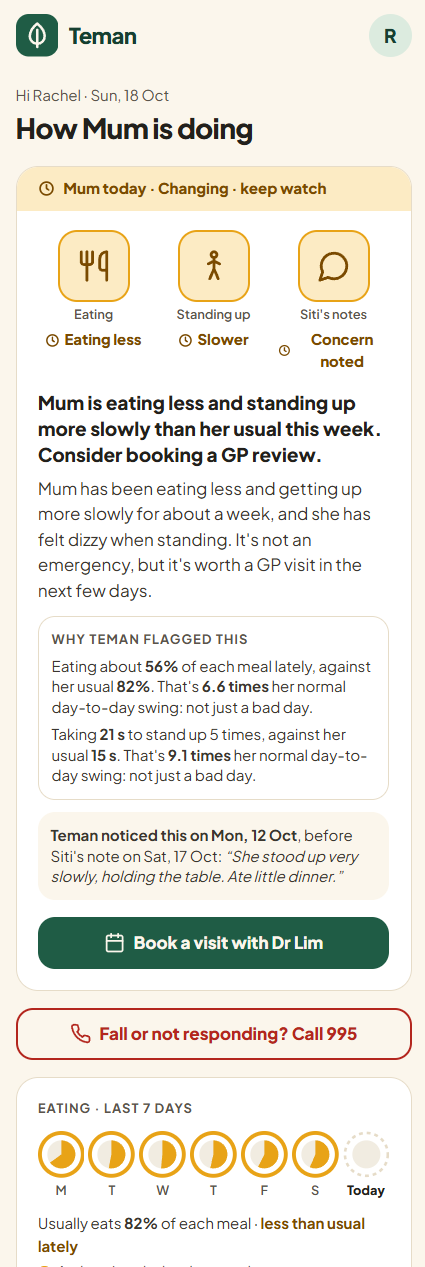
- Rachel (the daughter) gets a plain-language weekly read on how Mum is doing compared to Mum's own normal — not a population average — plus concrete things to do about it.
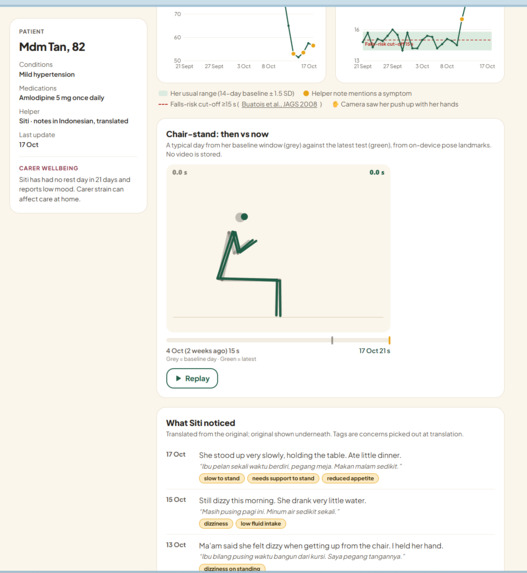
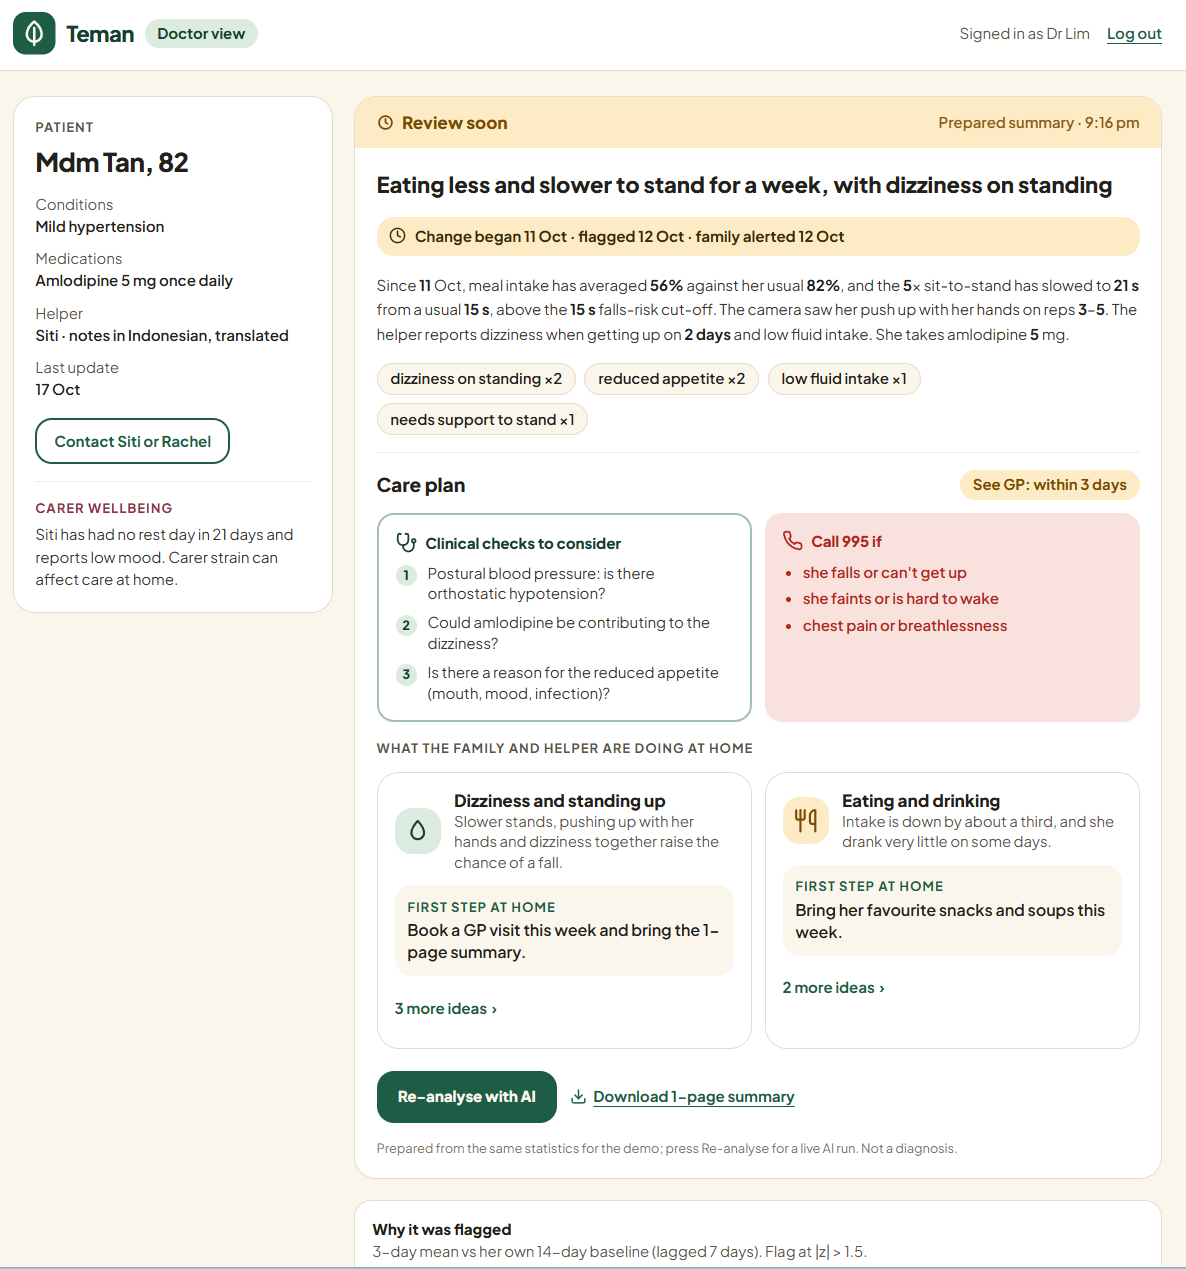
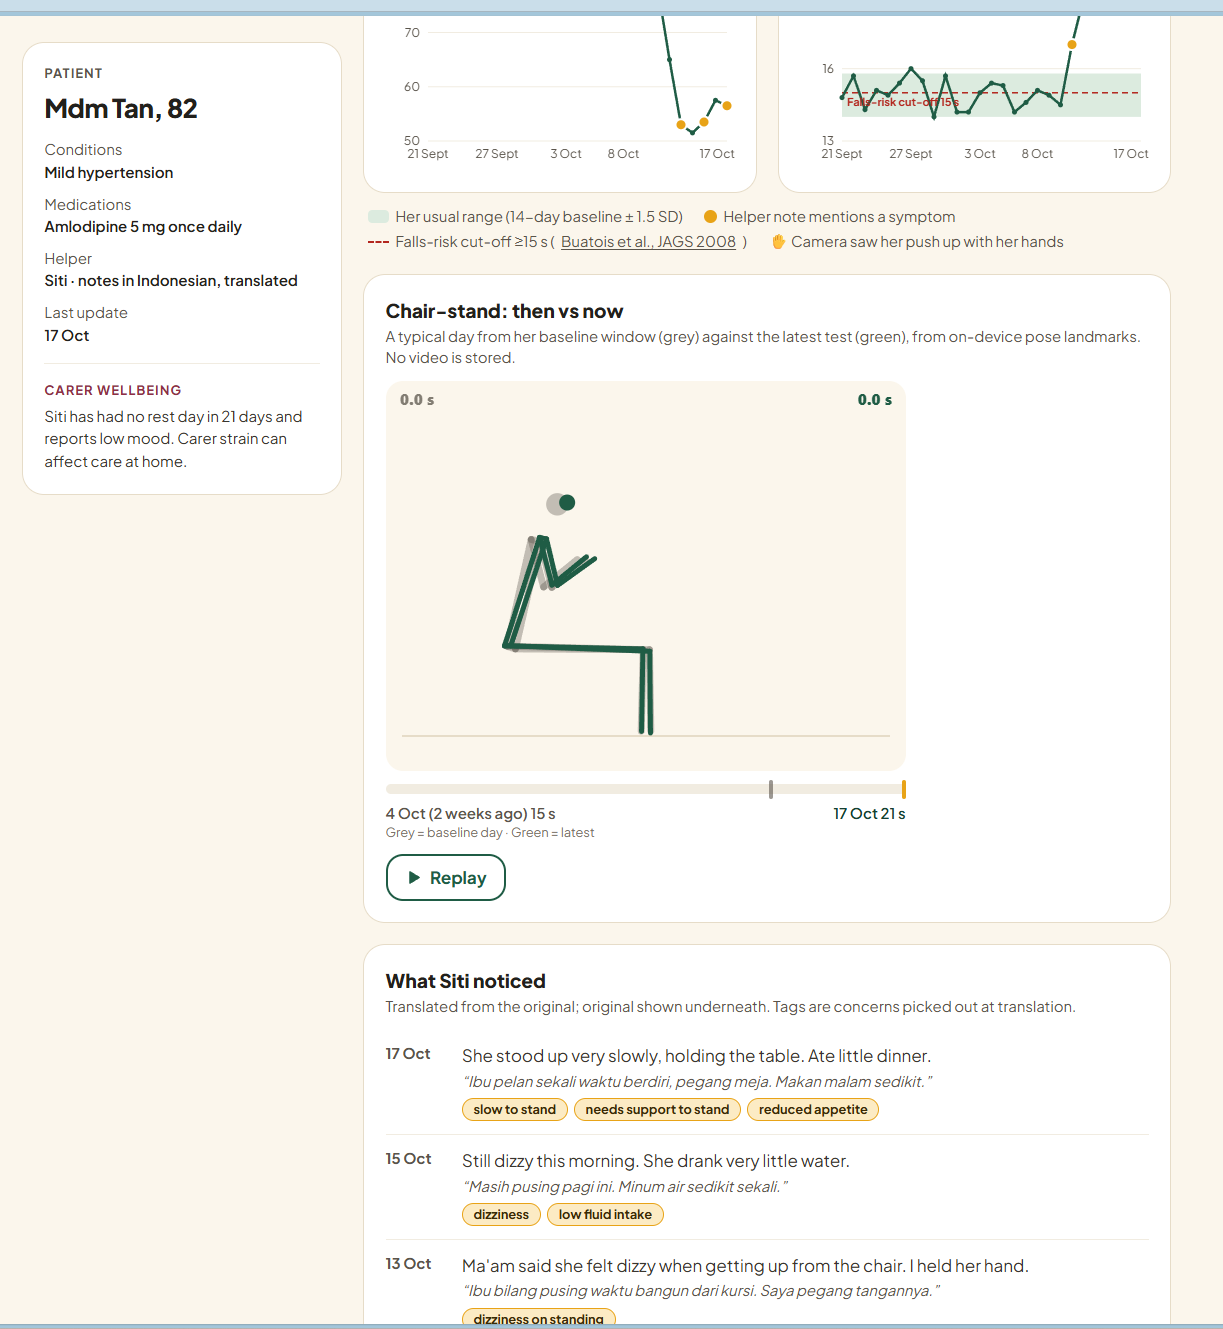
- Dr Lim (the GP) gets the clinical version: trend charts against a rolling baseline, the helper's notes translated with the original shown underneath for trust, and an AI-written summary ready for the visit.
Teman flags trends. It doesn't diagnose.
How we built it
- Next.js app, Postgres-backed, serving the three role-specific views from one underlying data model.
- DeepSeek handles the multimodal work: estimating % of a meal eaten from before/after photos, and translating Siti's Bahasa Indonesia/Tagalog notes into English — with the original always kept alongside, so nothing gets lost in translation silently.
- Statistics are computed in code, not by an LLM. For each signal we track a rolling 14-day baseline mean and standard deviation, and flag a 3-day window as genuine drift when
$$ z = \frac{\bar{x}{3\text{-day}} - \mu{\text{baseline}}}{\sigma_{\text{baseline}}}, \qquad |z| > 1.5 $$
The LLM's only job is to explain numbers that were already computed deterministically — never to invent them. That keeps it from quietly hallucinating a clinical-sounding figure, and means "why was this flagged" has a real, inspectable answer (we surface the actual z-score on the GP view).
- n8n orchestrates the clinical write-up as a small multi-agent pipeline: a webhook pulls the patient's recent data and computed baseline stats, hands them to a trend-analyser agent, parses and validates that output, then passes it to a healthcare-advisor agent — with access to a Singapore care-resources tool (AIC, CDE, HealthHub) — that turns the trend into a care plan with family-, helper-, and GP-specific actions, before saving it and responding.
- A two-tier summary, added once we realised a live external call is a bad thing to depend on mid-demo: the GP view always has a deterministic "prepared summary" ready immediately, and a "Re-analyse with AI" button triggers the live pipeline on top of it — the page is never broken, only ever enhanced by the live call succeeding.
Challenges we ran into
- The webhook that wasn't. "Analyse with AI" failed for a while because the n8n workflow was pointed at the test webhook URL instead of the production one — the test URL only fires once, right after clicking "Listen for test event" in the editor, so it looked broken from the app's side for a non-obvious reason. Fixing it meant confirming three things at once: the workflow published/active, the production URL wired into the app, and the final node genuinely a "Respond to Webhook" node.
- One shared demo household. Every visitor hits the same seeded data, which surfaced two real bugs: a page view was silently incrementing a counter (a GET request with a write side effect), and two components computed "days since Siti's last rest day" slightly differently — producing two different numbers on the same screen for the same fact. Nothing undermines a "we compare to her own data" pitch like the data visibly disagreeing with itself. We fixed the root cause and shipped a self-serve "Reset demo" button so the story can't be permanently broken by someone else's clicks.
- Three audiences, one dataset. The same drift (eating less, standing slower) had to become three genuinely different artefacts — a same-day nudge in Bahasa Indonesia, a reassuring-but-honest weekly summary for a daughter, a clinically precise trend writeup with citations for a GP — without duplicating the underlying logic three times.
- Stale demo data. Seed data dated relative to when it was generated goes stale fast; "21 days without a rest day" stops being true the moment the clock moves. We made the story regenerate relative to the actual demo date instead of a fixed one.
Accomplishments that we're proud of
- A working multi-agent pipeline, end to end: webhook → baseline stats → trend-analyser agent → healthcare-advisor agent with a resources tool → saved care plan — not just a single prompt-and-pray call to an LLM.
- Three interfaces that actually feel designed for three different people, not one dashboard with role-based filtering bolted on.
- Catching our own data-consistency bug (the rest-day mismatch) before a judge could, and treating it as seriously as we would a production incident.
- A demo that degrades gracefully: the prepared/live summary split and the self-serve reset mean the product still tells its story correctly even under live-demo conditions we don't fully control.
- A guided, three-step tour that walks a first-time visitor through Siti → Rachel → Dr Lim in about two minutes, so the "aha" doesn't depend on someone exploring three separate logins themselves.
What we learned
- Deterministic statistics plus an LLM that only explains them is more trustworthy — and far easier to debug — than asking an LLM to produce the numbers itself.
- A multi-agent n8n pipeline is genuinely fast to assemble, but "it works in the editor" and "it works in production" are different claims — active state, prod vs. test URLs, and response-node wiring are easy to get wrong under time pressure.
- Shared-state demo databases are a classic trap for any multi-user hackathon demo; idempotent reads and a visible reset affordance are worth building early, not bolting on at the end.
- Showing why something was flagged (an actual z-score, a baseline range) earns more credibility from a skeptical reviewer than a vaguer "AI noticed something unusual" ever could.
What's next for Teman
- Move beyond manual logging towards passive signals where possible — e.g. using the chair-stand camera check more often, or integrating wearables for families who already use them.
- Support more than one senior and more than one helper per household, and more conditions beyond mild hypertension.
- Replace "log in to check" with real notifications — push or WhatsApp — so Rachel finds out the moment something changes, not the next time she opens the app.
- A feedback loop for GPs to adjust what counts as a meaningful drift for a specific patient, rather than one fixed threshold for everyone.
- Proper accounts and onboarding for real households (we've started this — there's already a "create an account" path separate from the demo), with the privacy and security hardening that real patient and helper data demands.
- More languages for helpers beyond Bahasa Indonesia and Tagalog, reflecting the actual range of nationalities working as domestic helpers in Singapore.
Built With
- computer-vision
- deepseek
- llm-agents
- machine
- n8n
- next.js
- postgresql
- railway
- react
- rest-api
- tailwind-css
- typescript
- webhooks


Log in or sign up for Devpost to join the conversation.