Inspiration
What it does
How we built it
Challenges we ran into
Inspiration
Every Sunday you hear a broadcaster say "everybody in the stadium knows it's a pass." We wanted to put a number on that. How readable is an offense before the snap? Does being read actually cost anything? And where exactly does each team give itself away? Those are questions a coordinator asks in the self-scout meeting and a defensive staff asks on Tuesday night, so we built the tool for both of them.
What it does
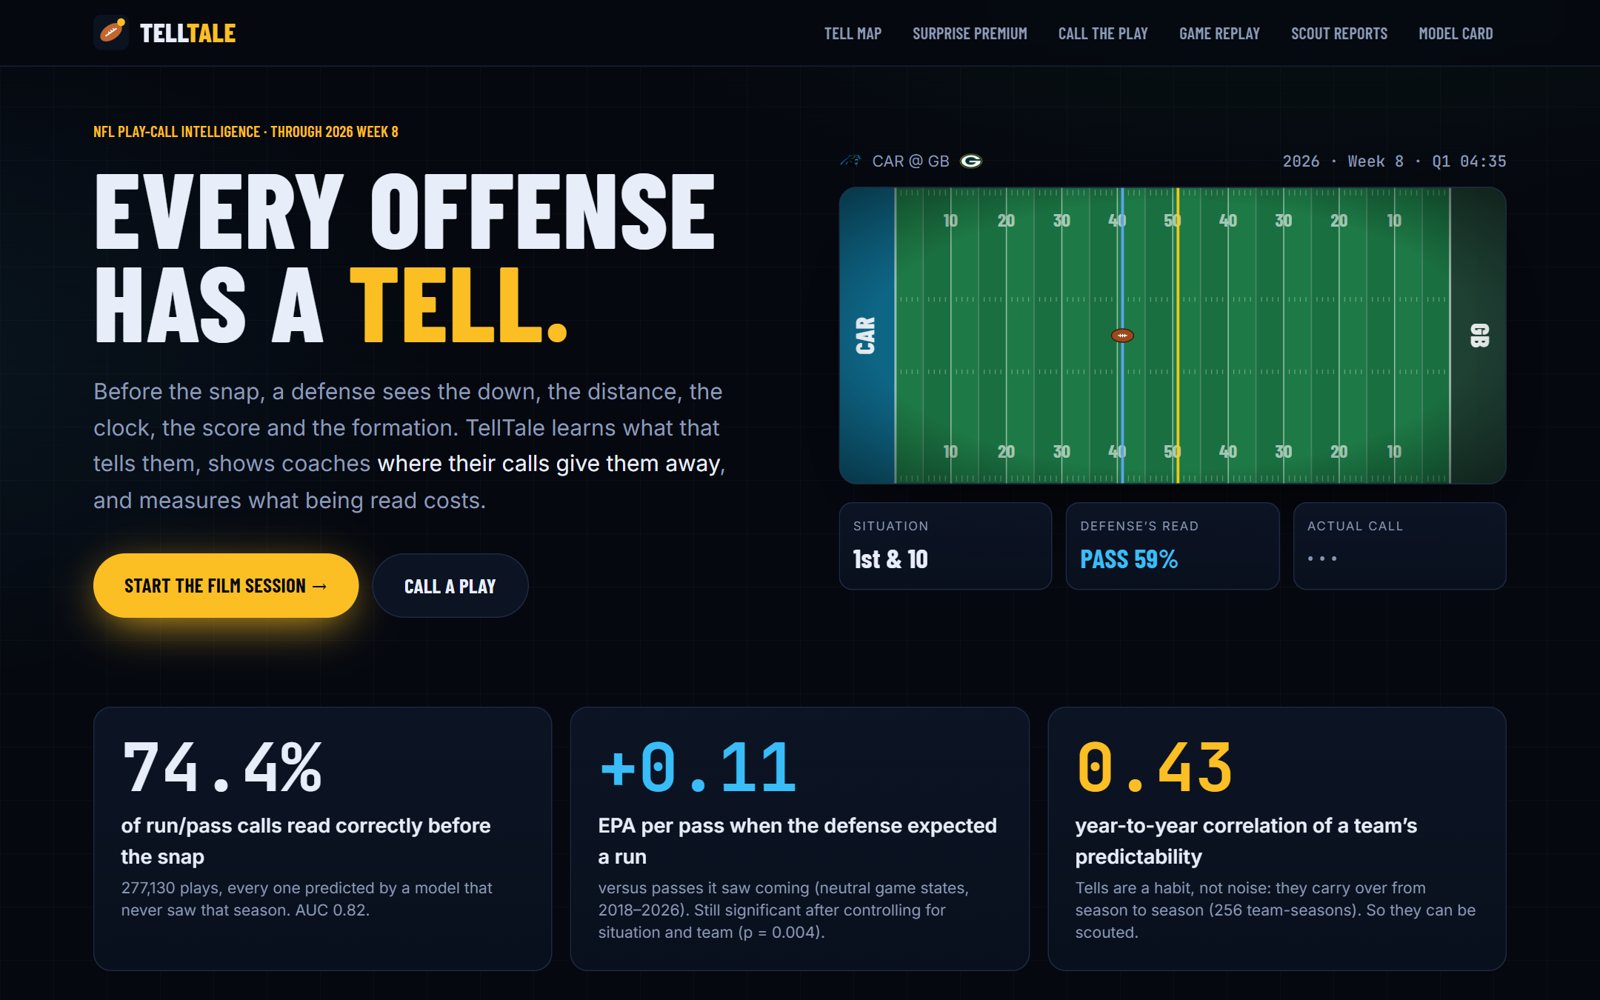
TellTale is a multi-page web app built on a pre-snap play-call model.
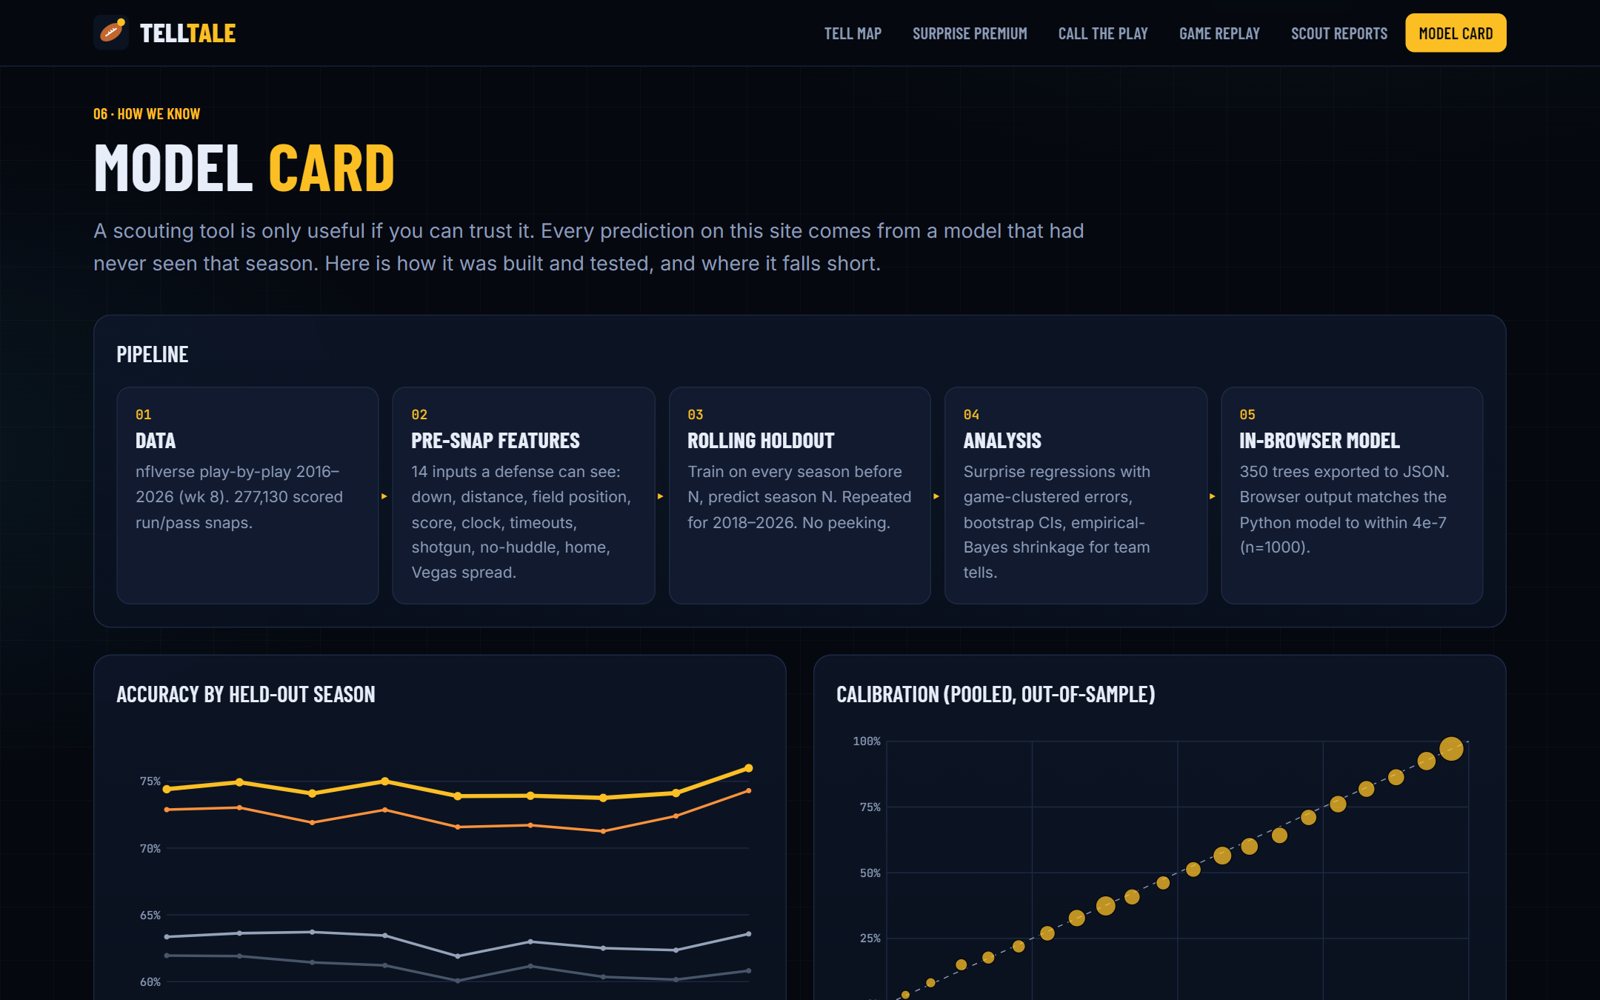
- The model: from only what a defense can see before the snap (down, distance, field position, score, clock, timeouts, shotgun, no-huddle, home field, Vegas spread), it predicts run or pass. On 277,130 plays from 2018 through week 8 of 2026, every one predicted by a model that never saw that season, it reads 74.4% of calls correctly (AUC 0.82). It is well calibrated and beats a down-and-distance table and logistic regression in every held-out season.
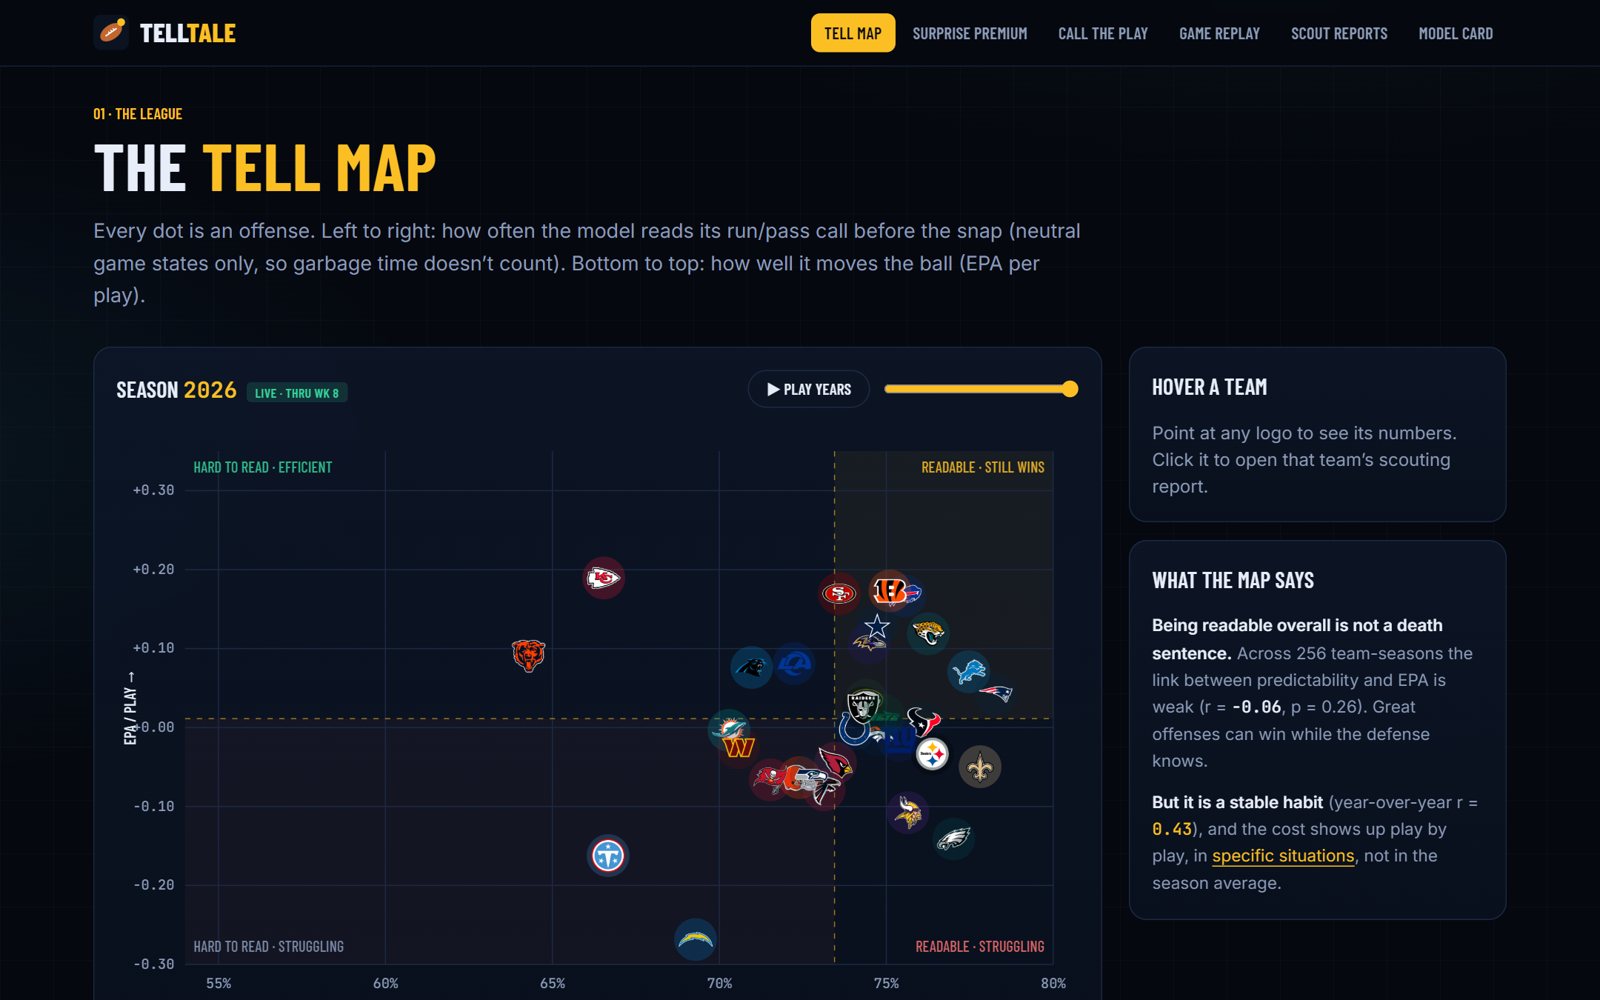
- Tell Map: all 32 offenses by how readable they are versus how efficient they are, animated season by season from 2018 to the live 2026 season.
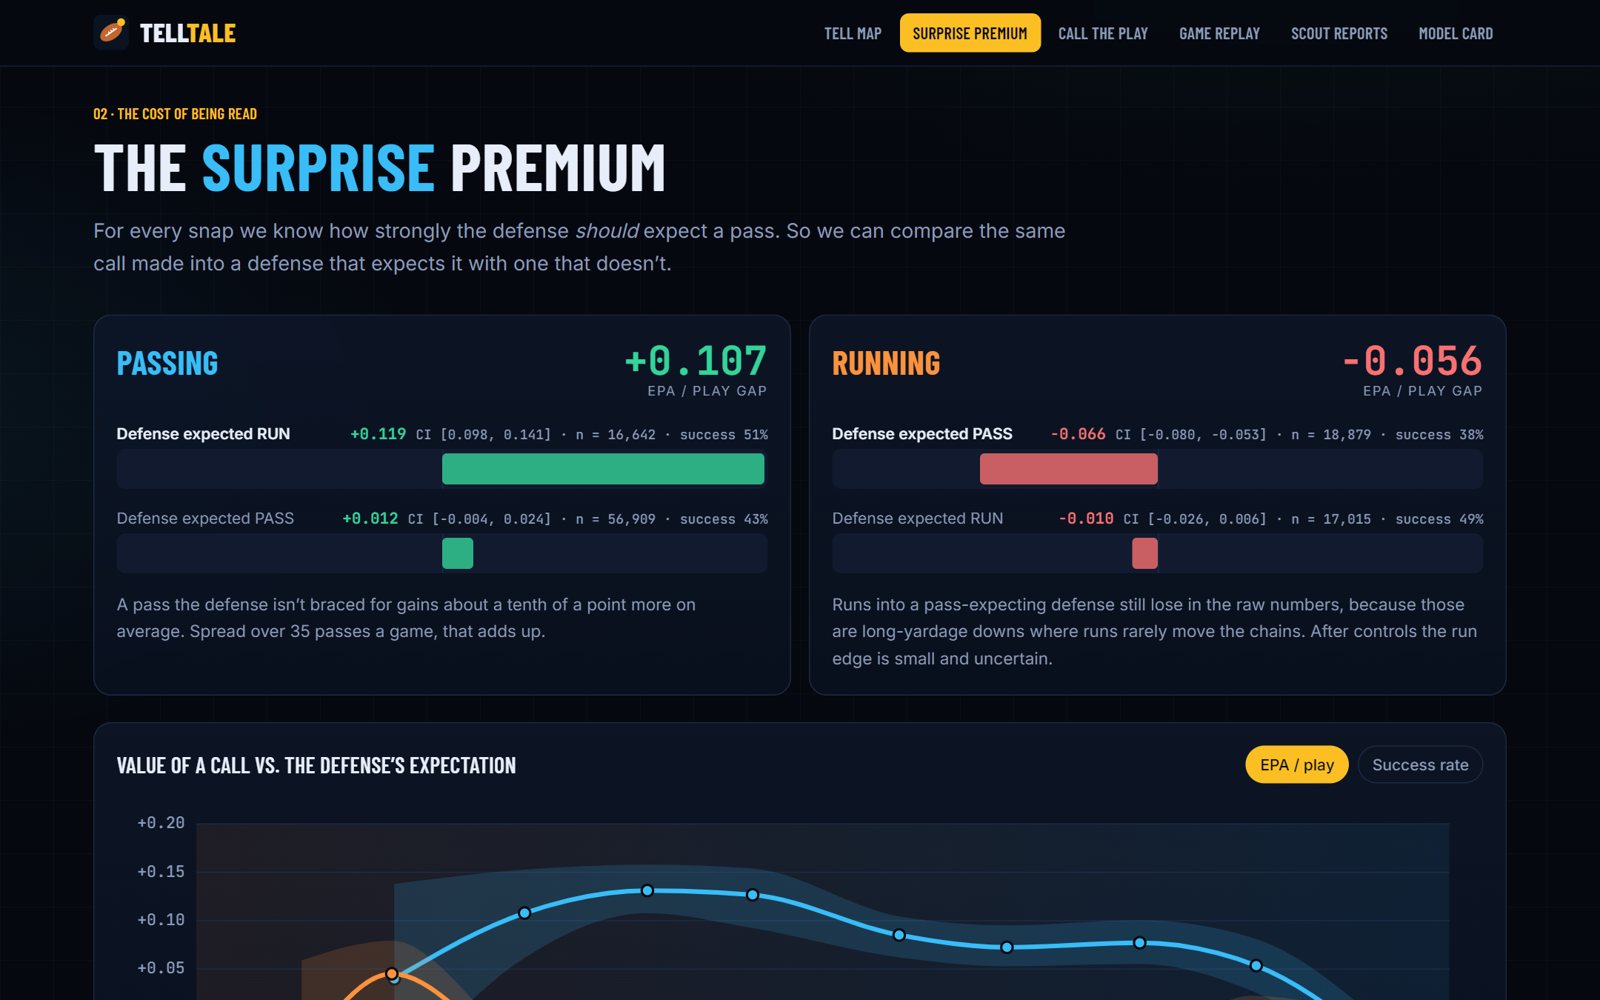
- Surprise Premium: what a call is worth when the defense expects the other one. Passes thrown when the defense expected a run gained +0.119 EPA per play, versus +0.012 when it expected a pass (16,642 vs 56,909 neutral-situation passes, non-overlapping 95% CIs). After controlling for down, distance, field zone, score and team-season, with standard errors clustered by game, surprise is still worth +0.051 EPA per unit (p = 0.004) and +2.0 points of success rate (p < 0.001). It is a passing effect: the "surprise draw" barely pays.
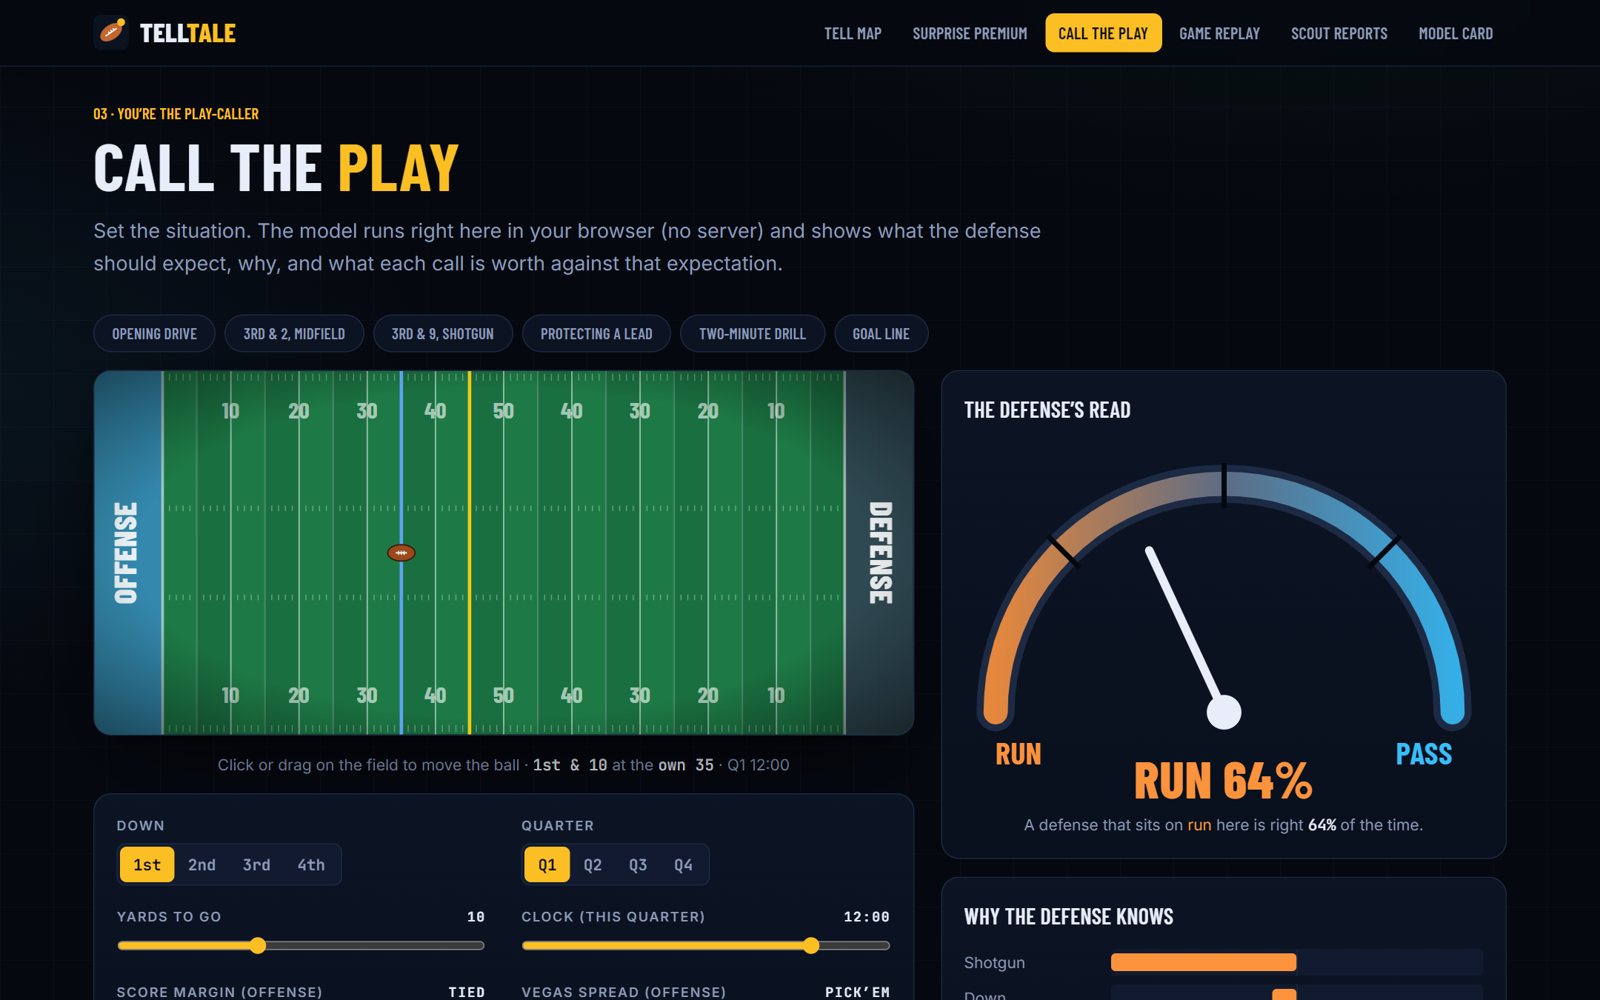
- Call the Play: a situation simulator. The model runs entirely in the browser and shows the defense's read on a live gauge, the features that give the call away, and the historical value of each call in that spot with that read.
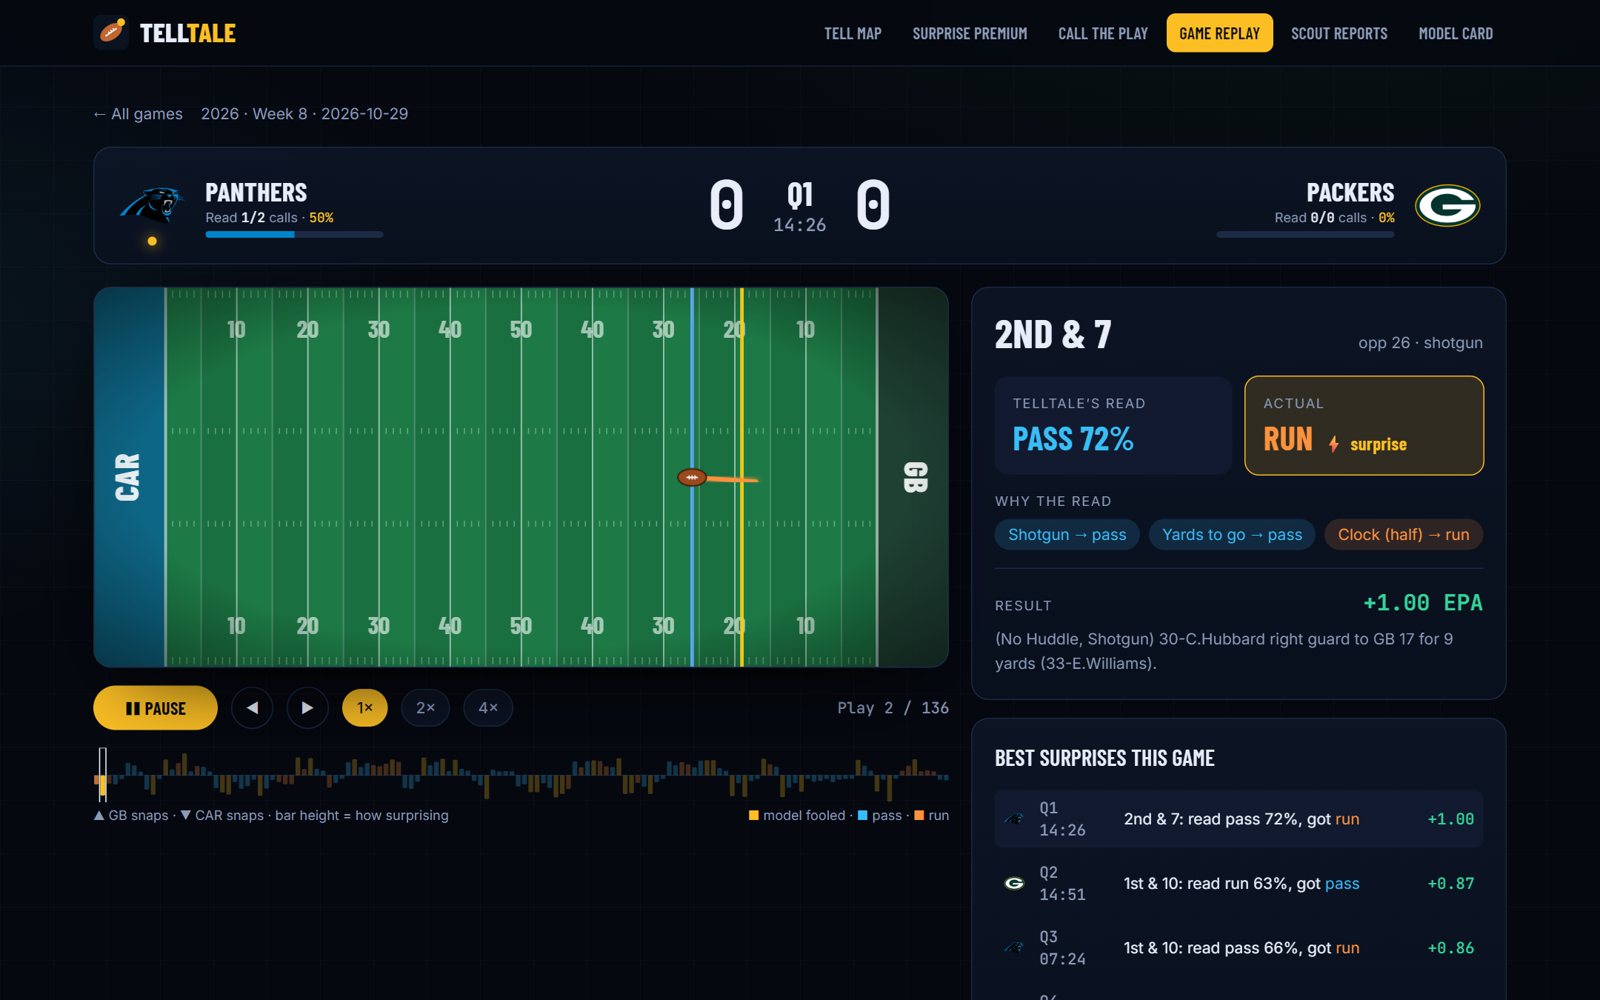
- Game Replay: every 2025 and 2026 game, snap by snap, on an animated field. TellTale makes its read before each play, then reveals the real call, its EPA and the reasons.
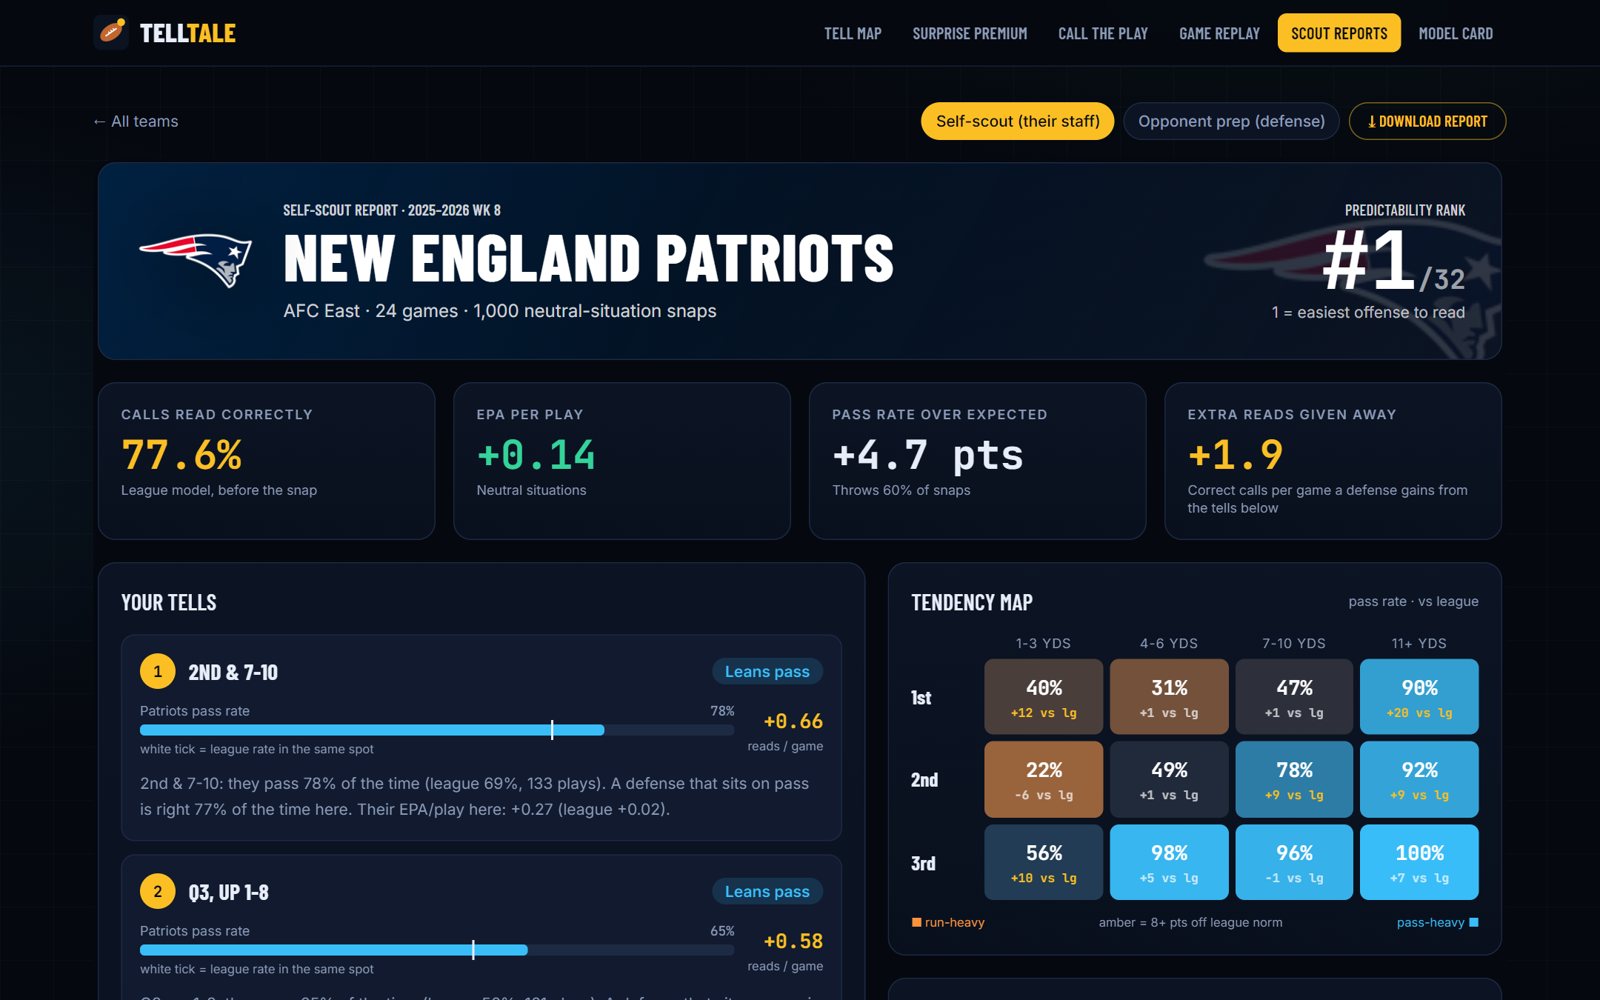
- Scout Reports: one per team, with the situations where it is easiest to read, written in plain English. Example: "2nd & 7-10: they pass 78% of the time (league 69%). A defense that sits on pass is right 77% of the time here." A toggle flips the same report from self-scout (for the team's staff) to opponent prep (keys for the defense facing them), and it downloads as an image for the game-plan meeting.
- Model Card: the validation, calibration, baselines, feature importance and limits, all on the page.
Practical application: a coordinator can see which situations make the offense predictable and where surprise pays (throwing on run-looking downs). A defensive staff gets ready-made keys for next week's opponent. Predictability is also a stable trait (year-over-year correlation 0.43), which is what makes it worth scouting.
How we built it
- Data: nflverse play-by-play, 2016 to week 8 of 2026, including EPA. Regular-season runs and passes only; sacks and scrambles count as pass calls; kneels, spikes and two-point tries are removed.
- Model: XGBoost on 14 pre-snap features with a rolling season holdout. To predict season N we train only on seasons before N, for N = 2018 to 2026. Baselines are the league pass rate, a down-and-distance table and logistic regression. We check calibration, Brier score, AUC and SHAP values.
- Statistics: statsmodels OLS with team-season fixed effects and game-clustered standard errors for the Surprise Premium, bootstrap confidence intervals for every binned curve, and empirical-Bayes shrinkage so small samples cannot create fake team tells.
- In-browser inference: we flatten all 350 trees to JSON, and each inner node stores its expected value. The browser then computes both the probability and per-feature explanations with no server. It matches the Python model to within 4e-7 on 1,000 test plays.
- Front end: React, TypeScript, D3 and Framer Motion. The animated field, gauges and charts are custom SVG. It deploys as a static site on Vercel.
Challenges we ran into
- Telling a real effect apart from situation effects. Raw numbers say runs into a pass-expecting defense are bad, but those are mostly 3rd-and-long. Only the controlled regression showed that the surprise effect is concentrated on passes.
- Being honest when a hypothesis failed. We expected predictable offenses to be worse overall. Across 256 team-seasons the link is weak (r = -0.06), so the product went situation by situation instead of quoting a misleading season-level number.
- Explaining a tree ensemble in the browser. Exporting expected values for every node let us show "why the defense knows" live without shipping a second model.
Accomplishments that we're proud of
- Every number on the site is out-of-sample and comes with a sample size and an interval.
- The model beats every baseline in all nine held-out seasons and is well calibrated across the full probability range.
- Coaches and fans can understand it without a stats background: a gauge, a field and plain-English tells.
What we learned
Predictability is not the same thing as being bad. Great offenses can win while the defense knows what's coming. What matters is where you are predictable and what you call when you break tendency. We also learned that calibration and honest baselines make an analytics tool much easier to trust.
What's next for TellTale
- Add personnel groupings, formations and motion from player-tracking or participation data to sharpen the tells.
- Model play-action and screens as their own "surprise" calls.
- Run weekly automatic refreshes during the season, with a "tell watch" alert when a team's tendency drifts.
- Build a defensive view: which defenses are best at punishing predictable offenses.
Accomplishments that we're proud of
What we learned
What's next for TellTale
Built With
- d3.js
- framer-motion
- nflverse
- pandas
- python
- react
- scikit-learn
- statsmodel
- tailwindcss
- typescript
- vercel
- vite
- xgboost


Log in or sign up for Devpost to join the conversation.