-
-
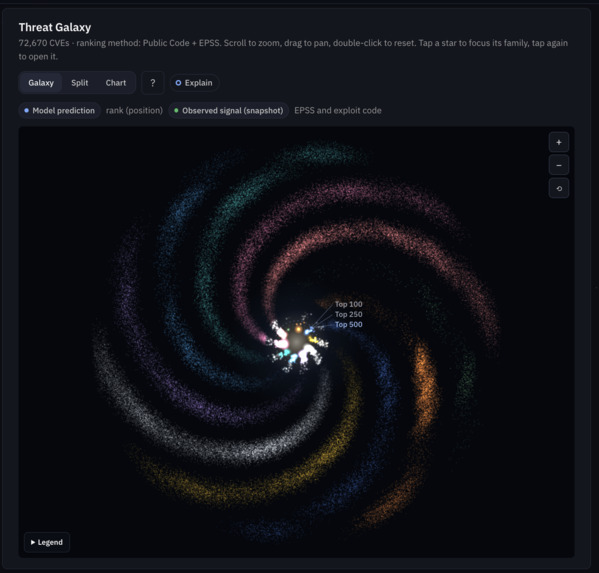
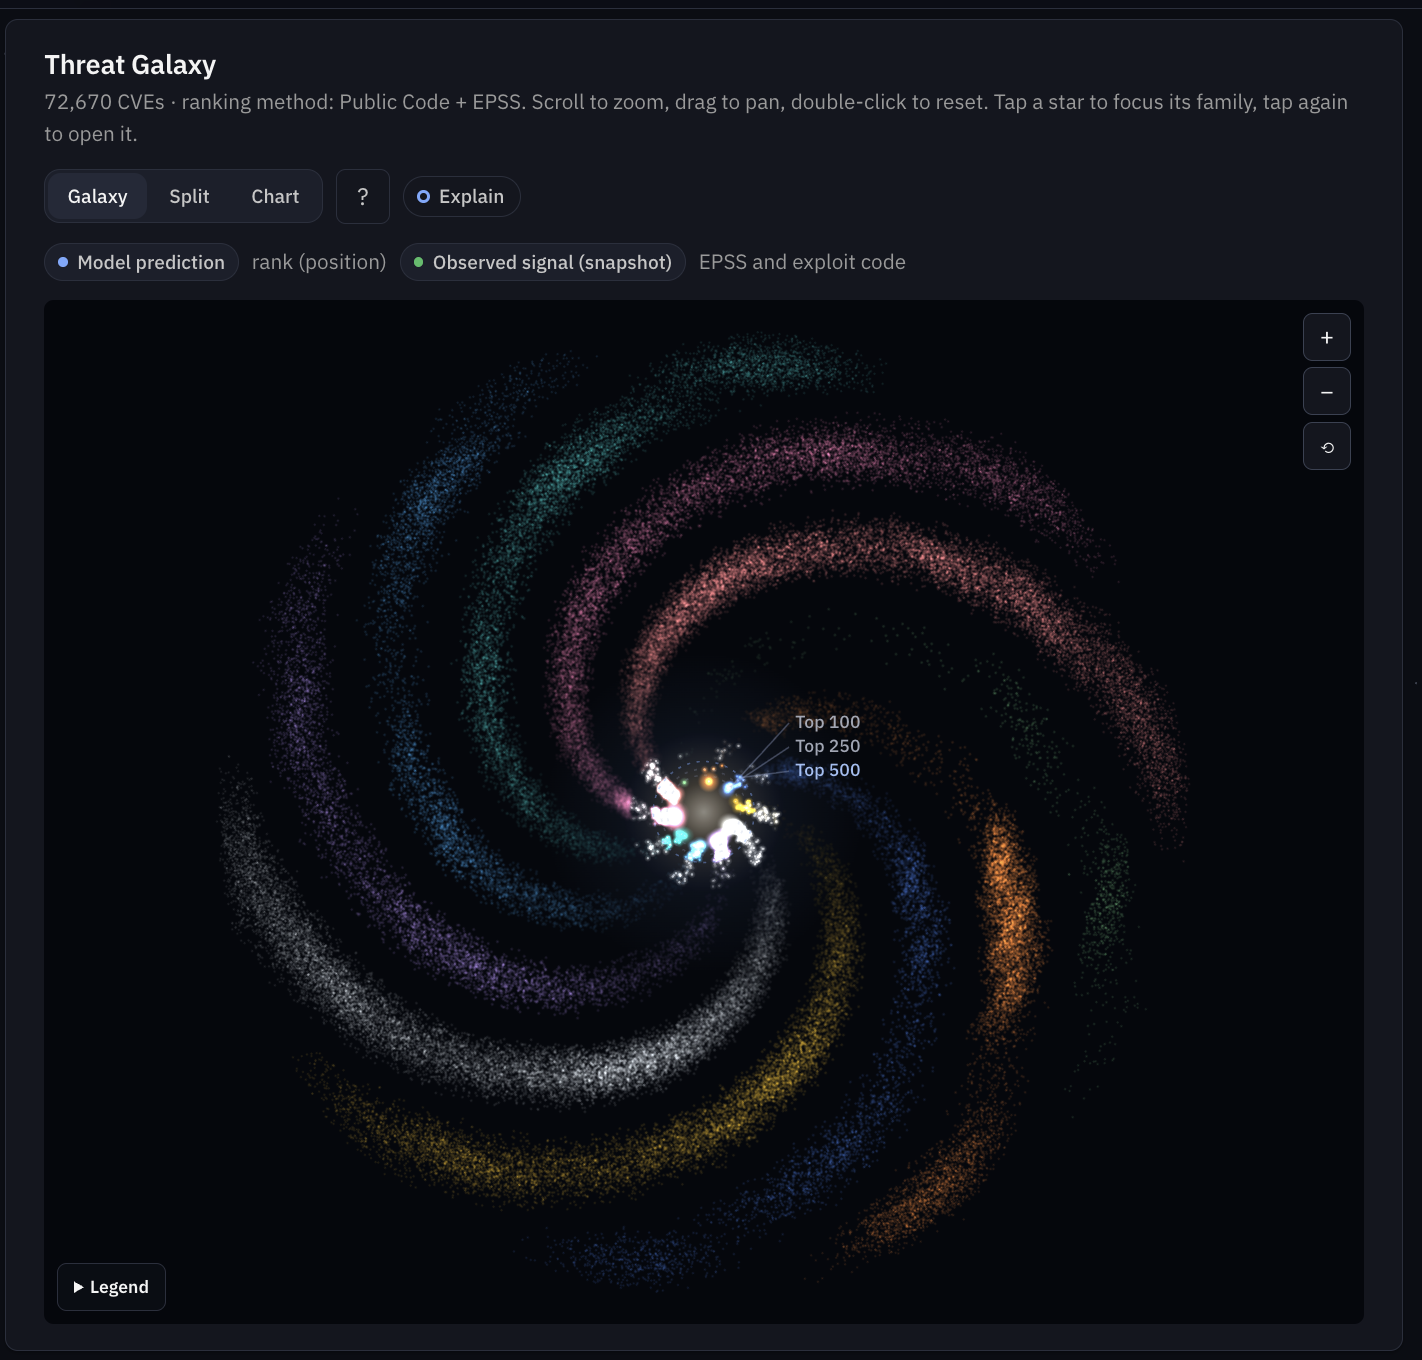
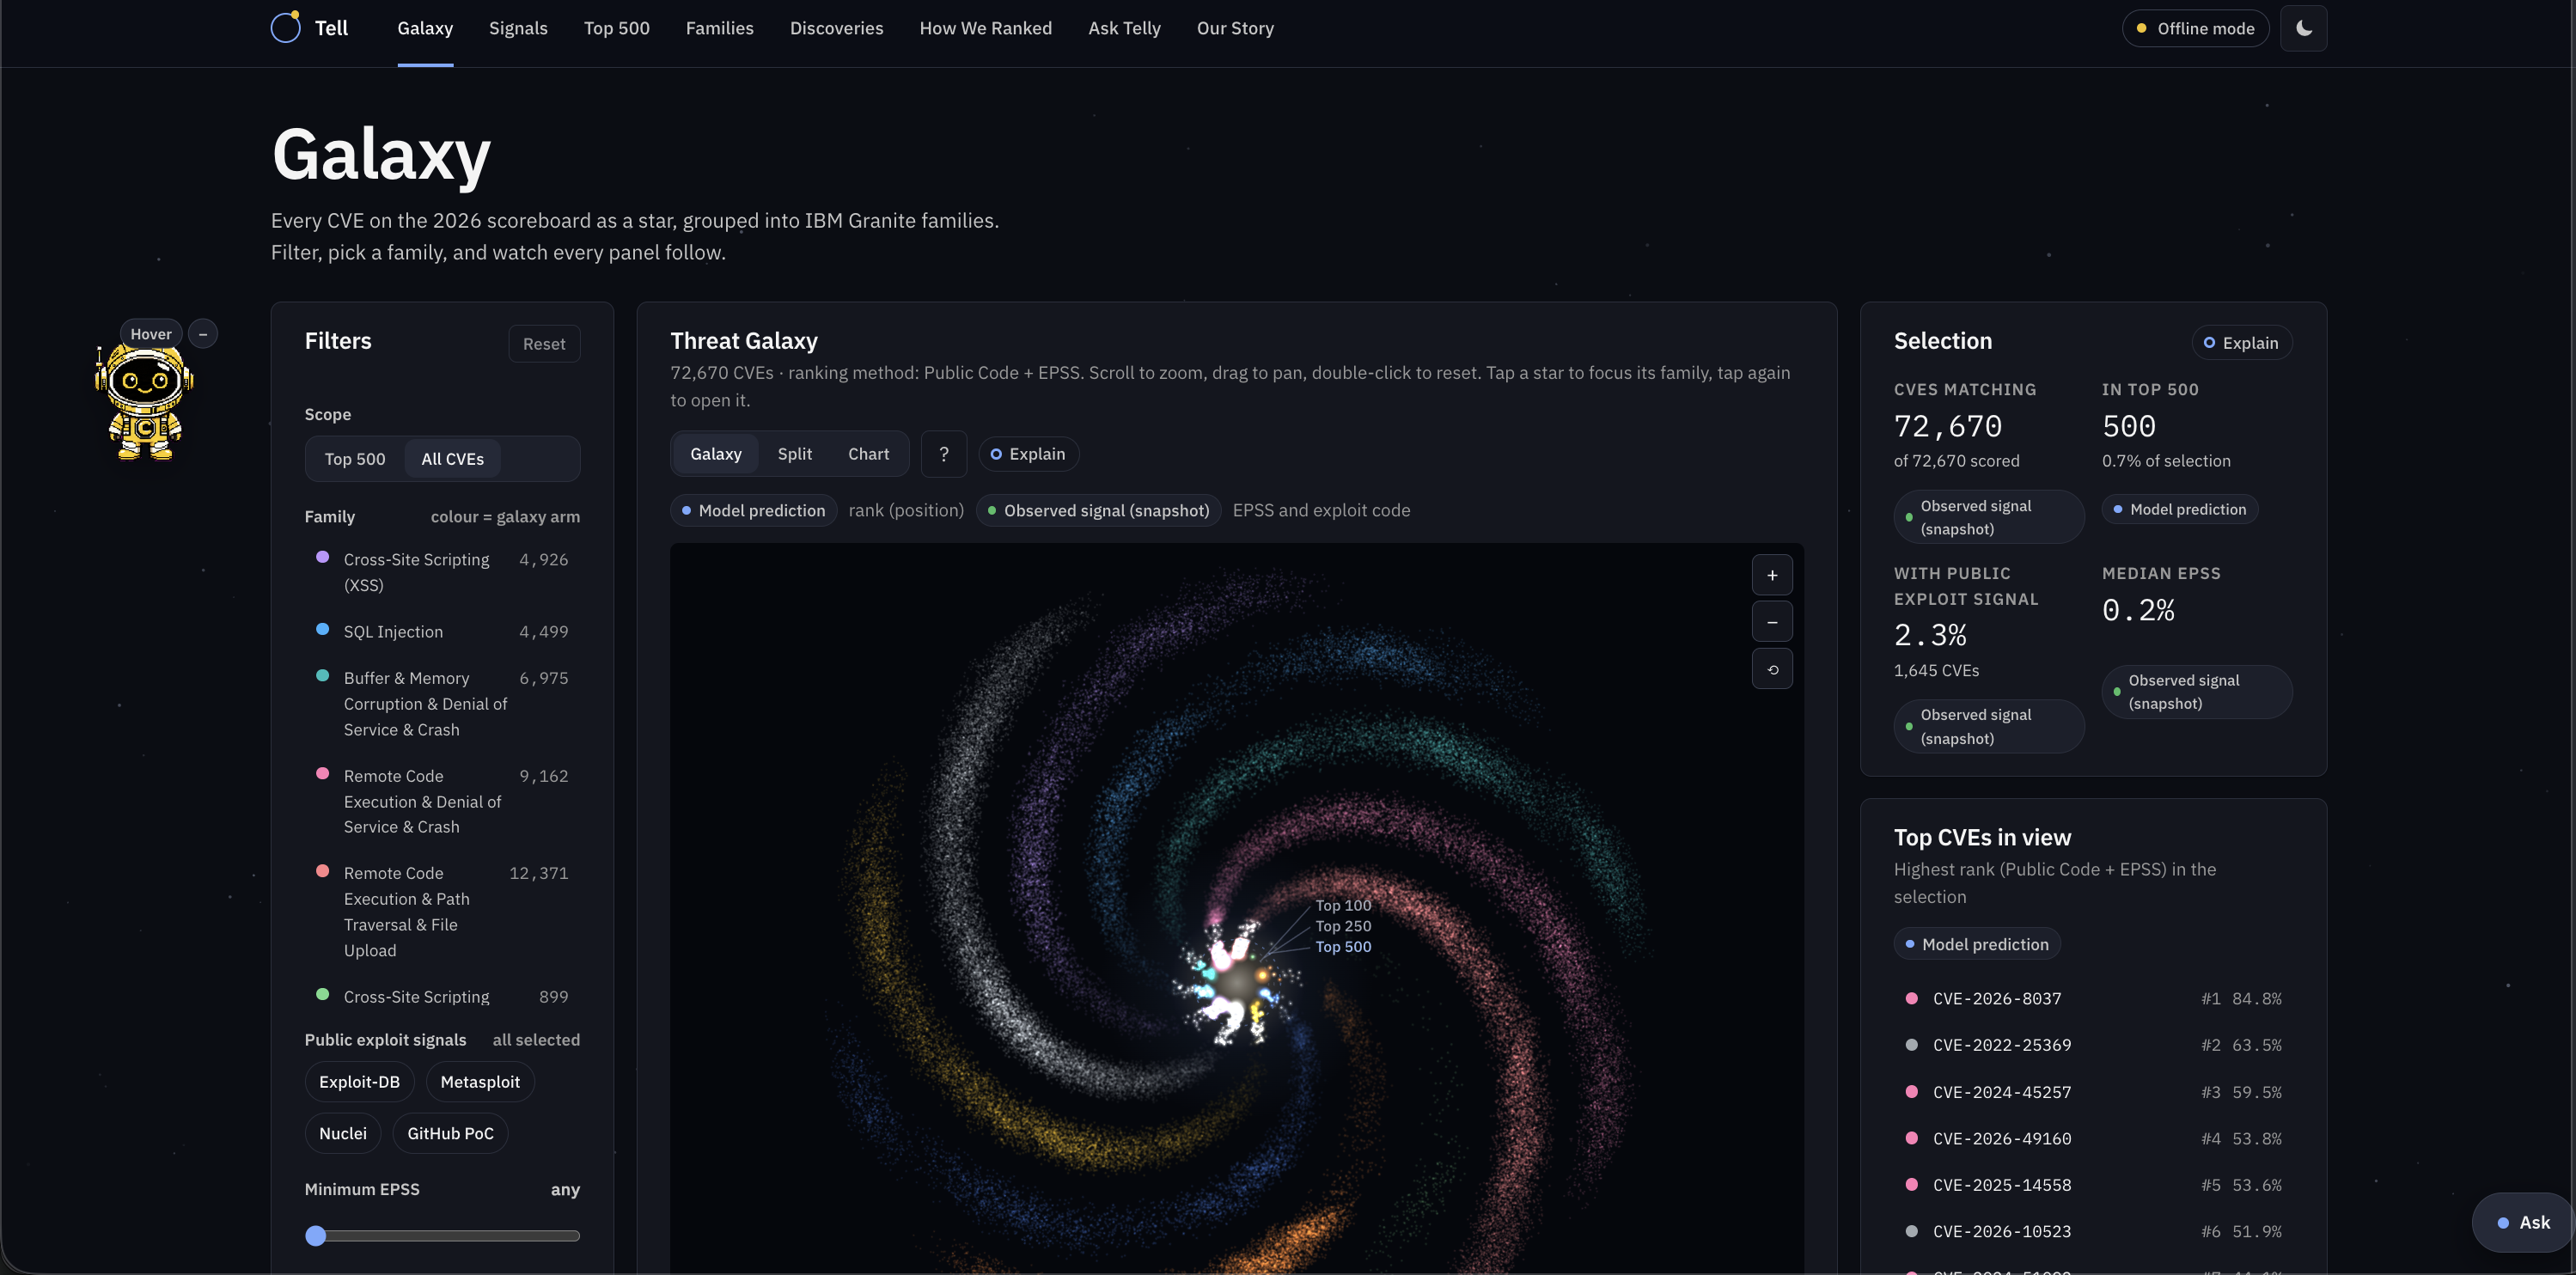
Galaxy: entails all the CVE scores in the form of a galaxy, split into 10 families using granite.
-
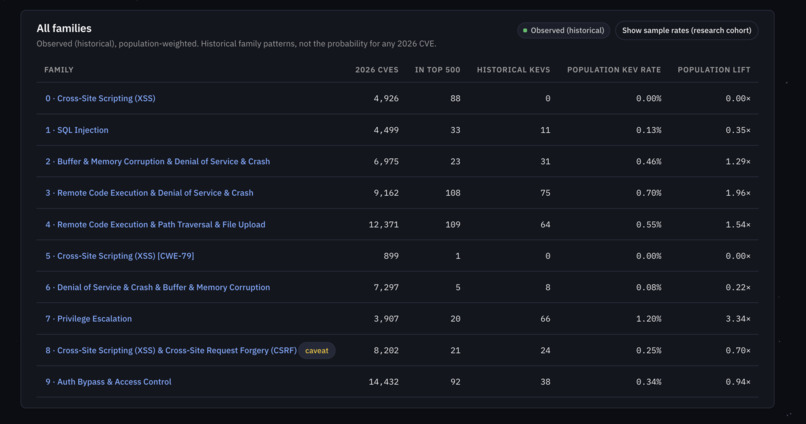
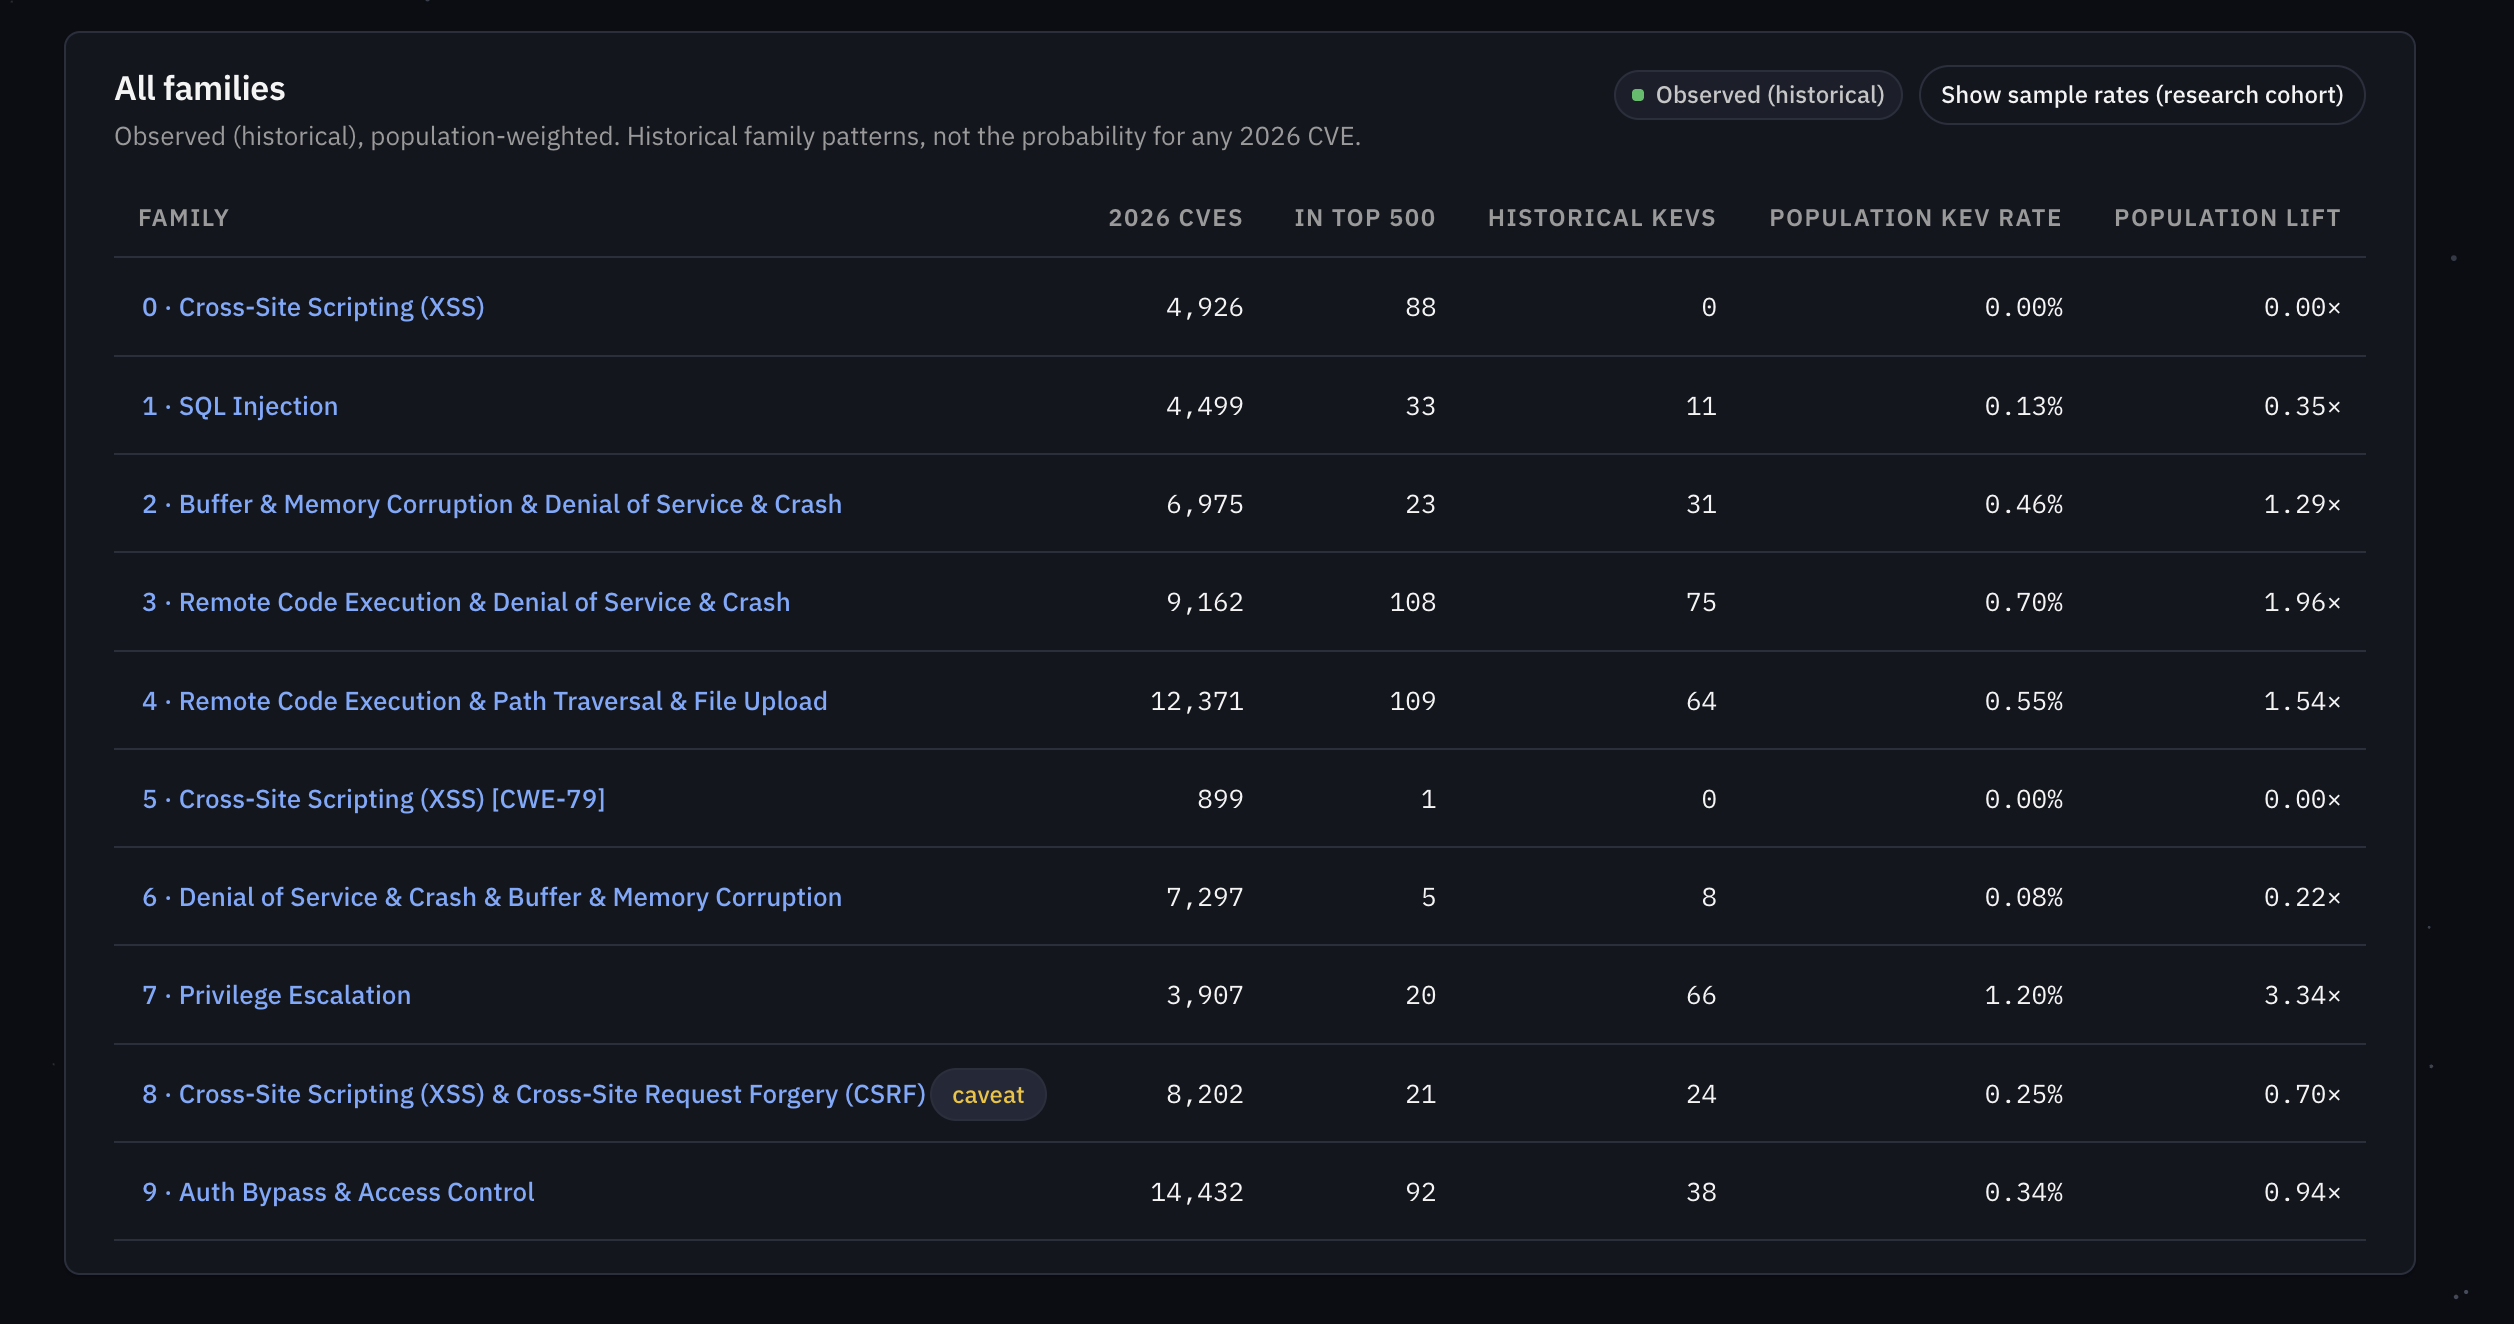
The 10 Granite families: how often each was exploited historically, and how big each is in 2026.
-

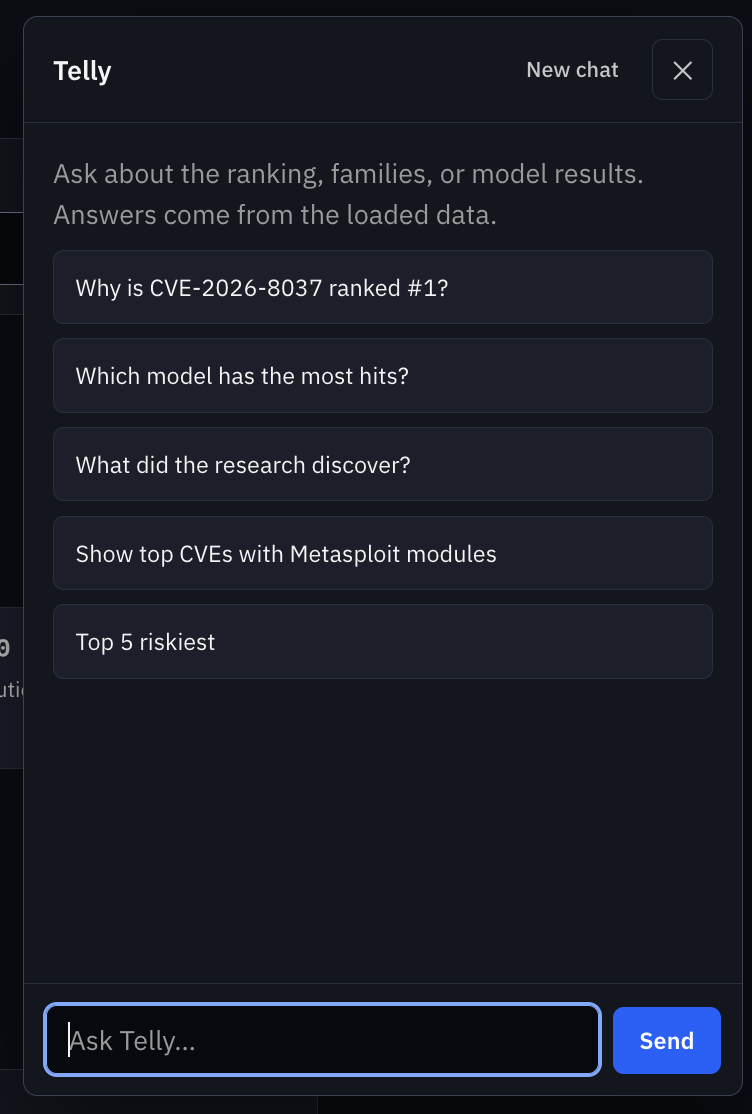
Telly
-
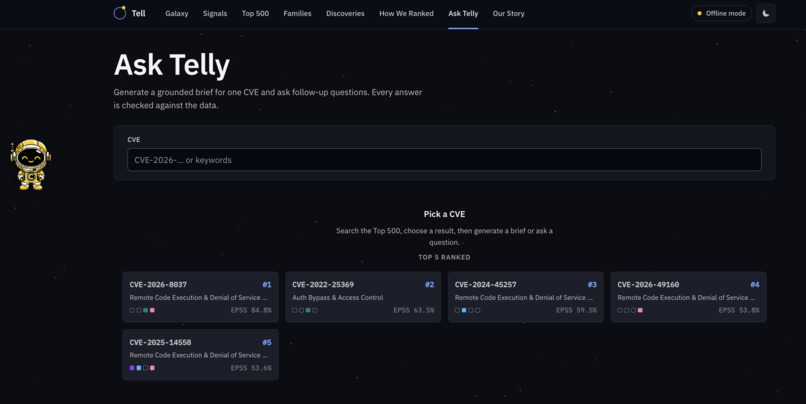
Telly cites our data and won't invent numbers.
-
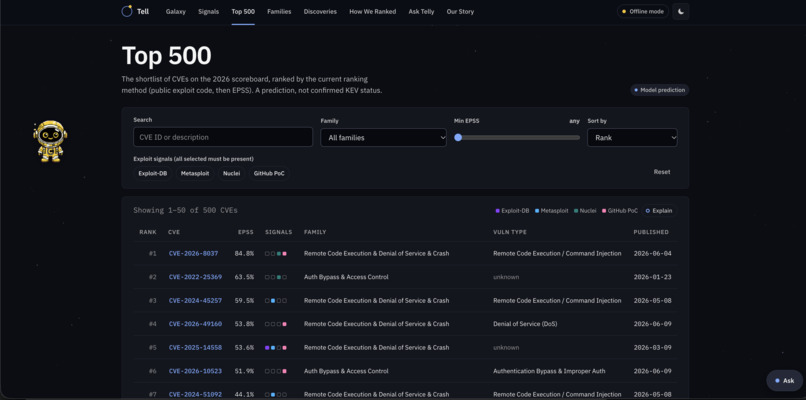
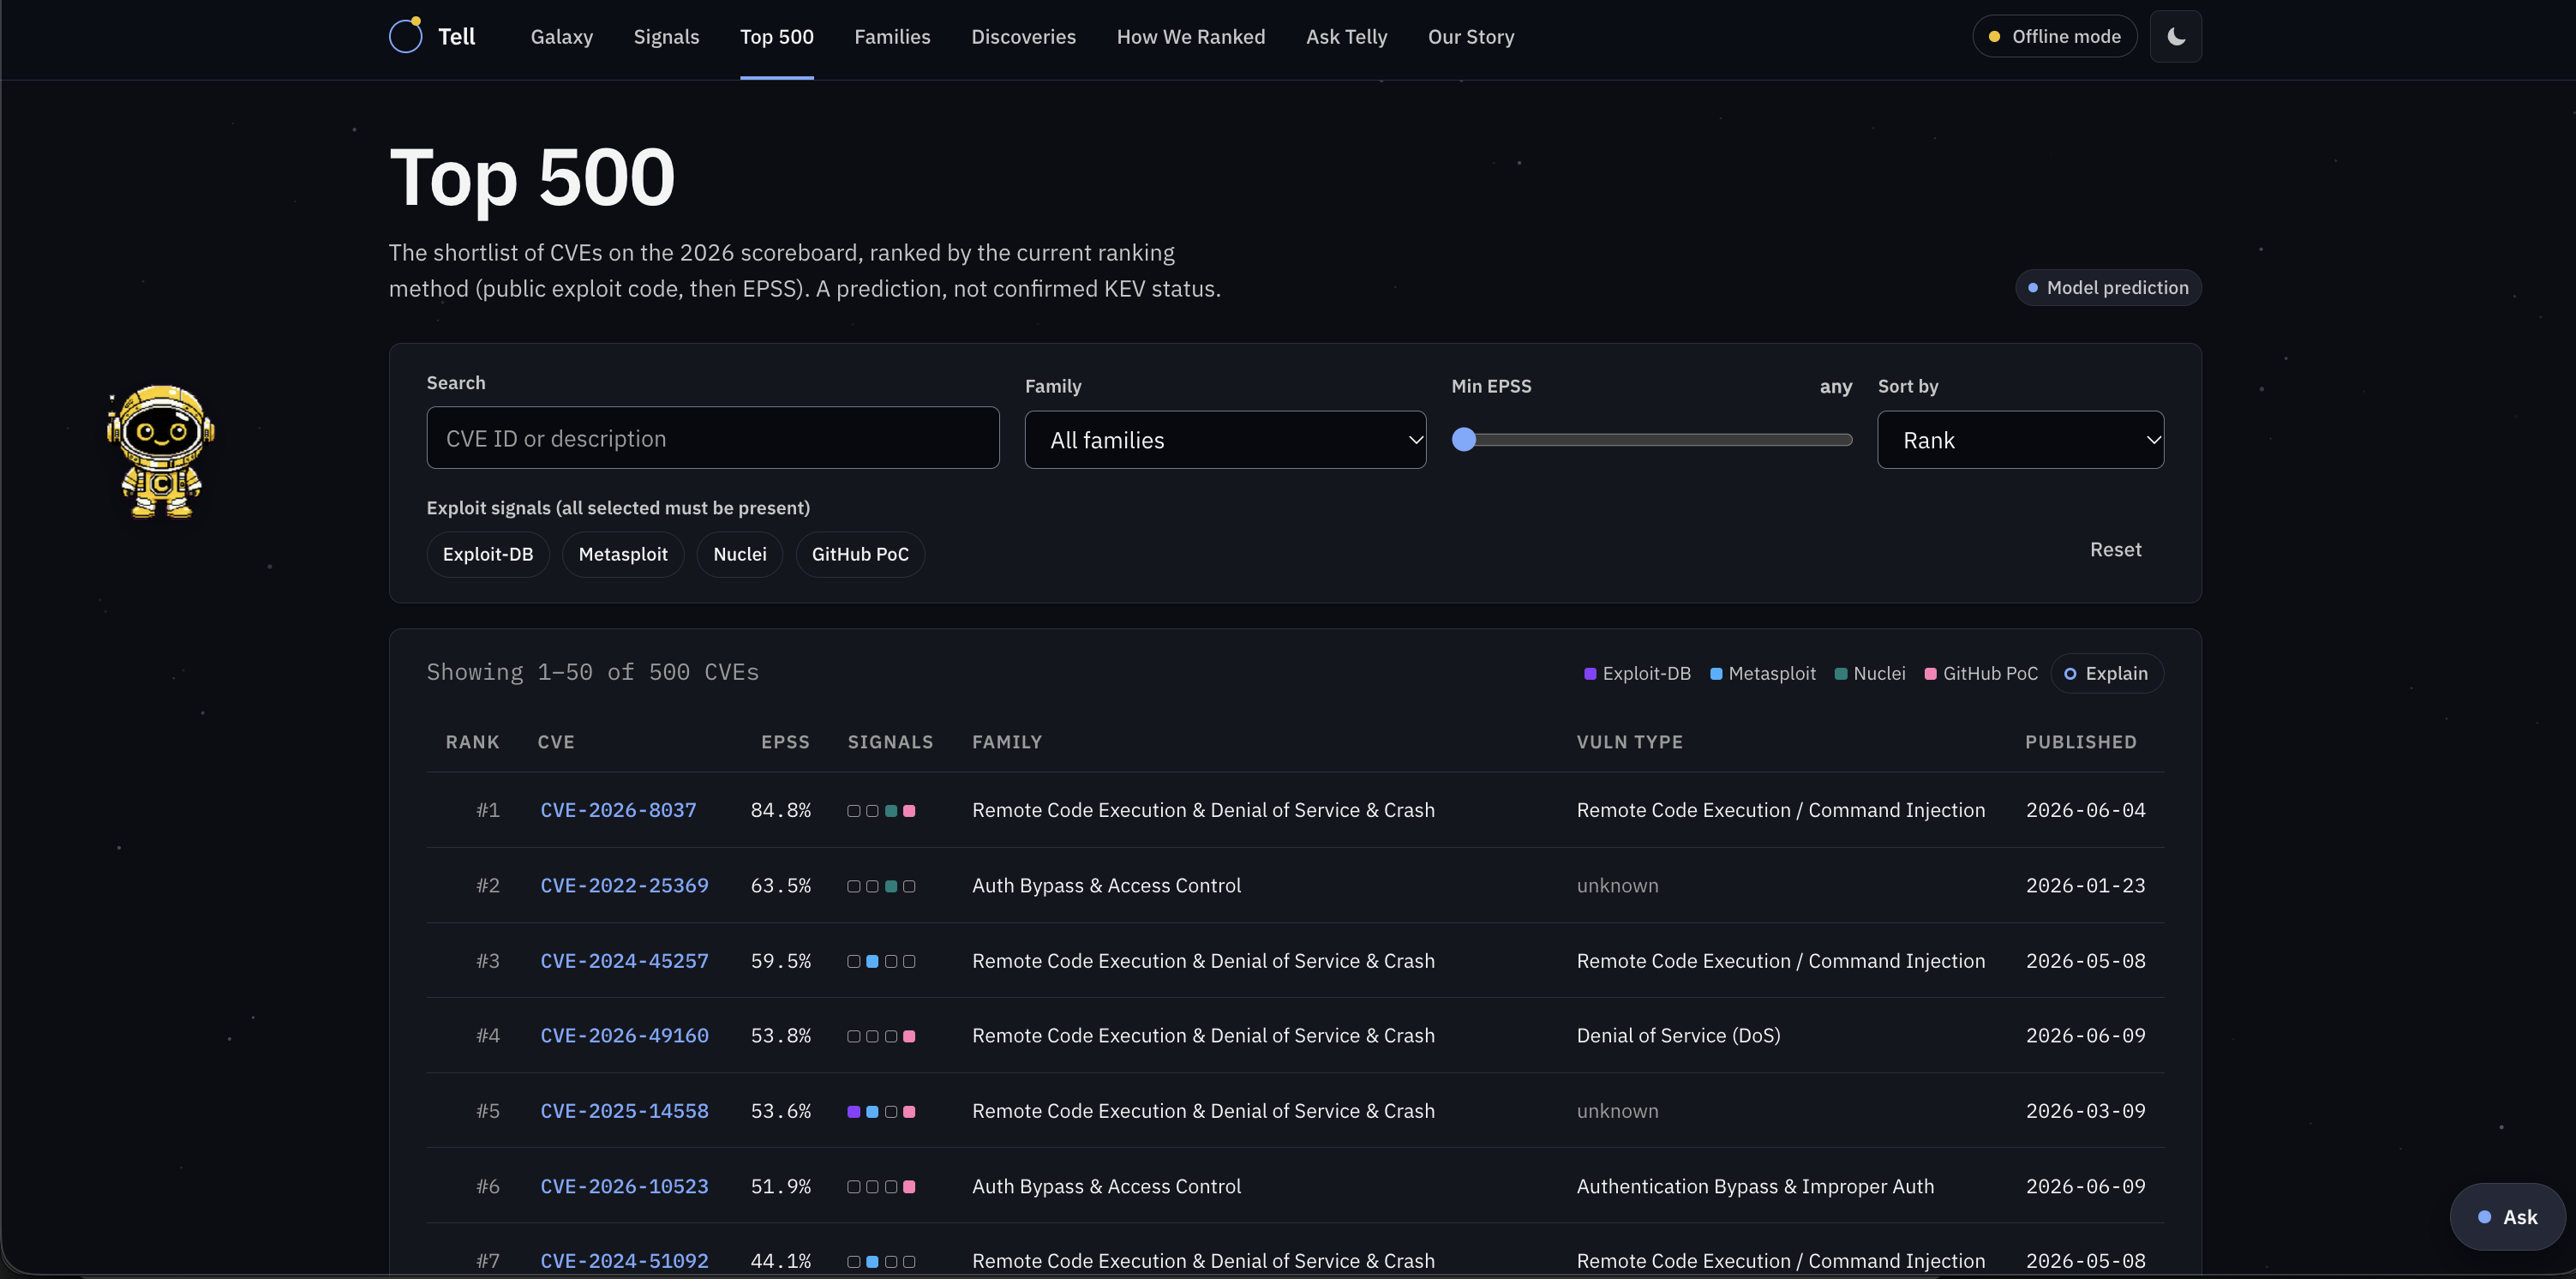
The submitted shortlist, searchable and filterable by family, EPSS and exploit source.
-
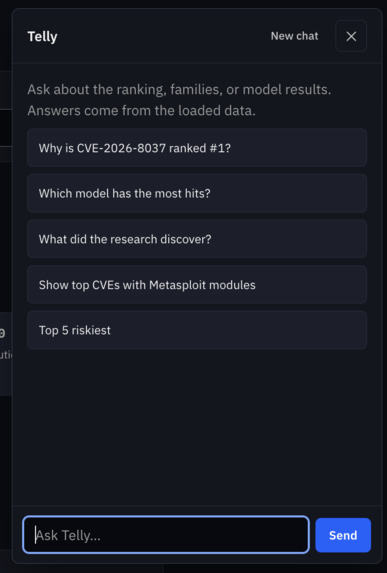
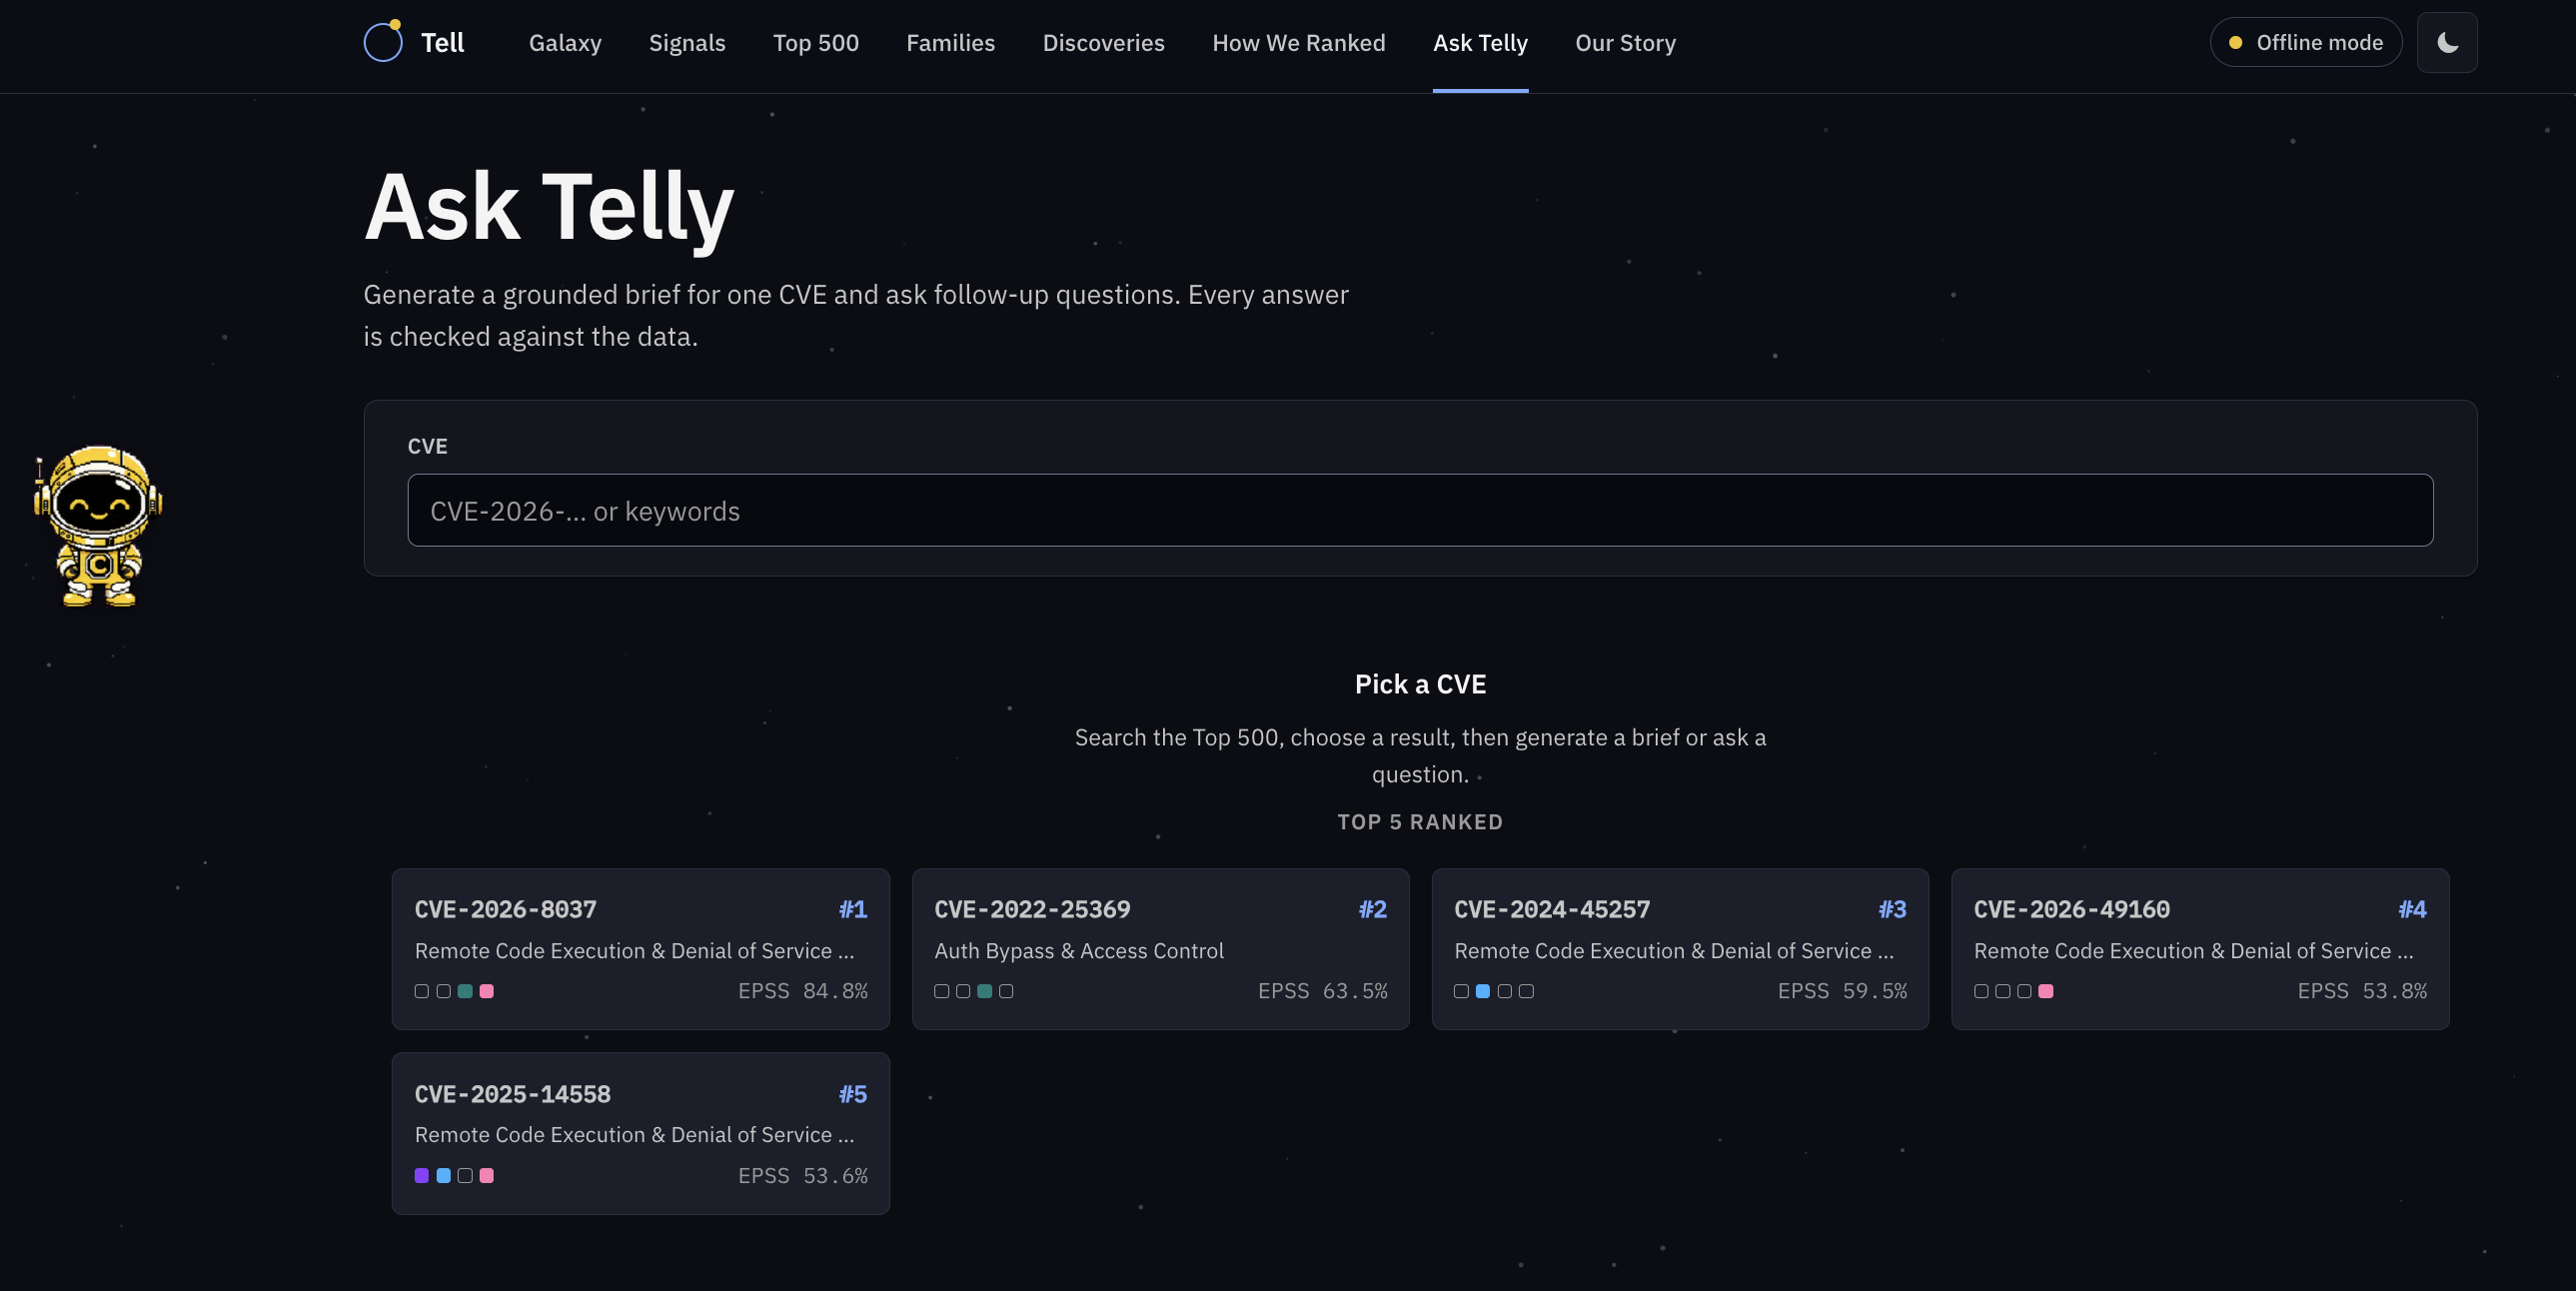
Ask Telly
-
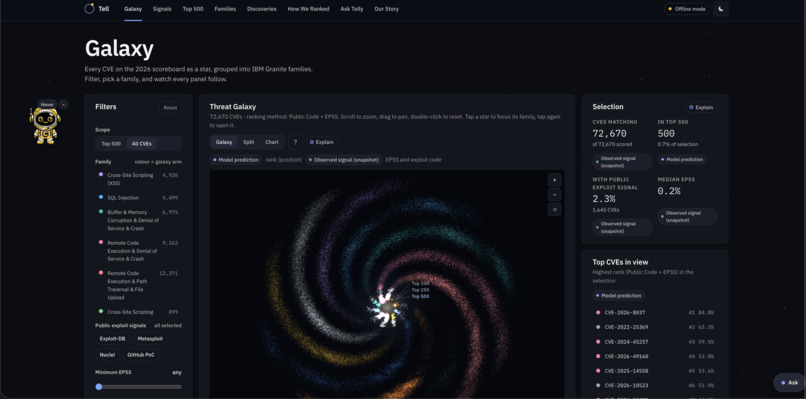
Galaxy dashboard
-
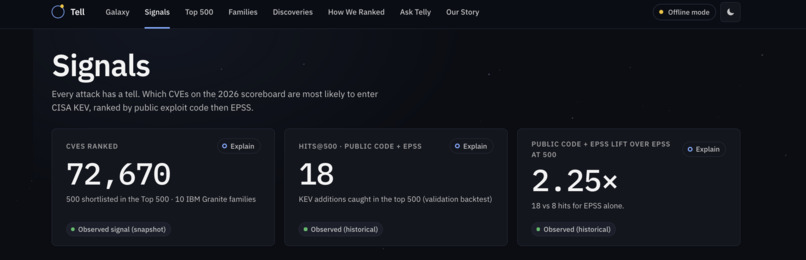
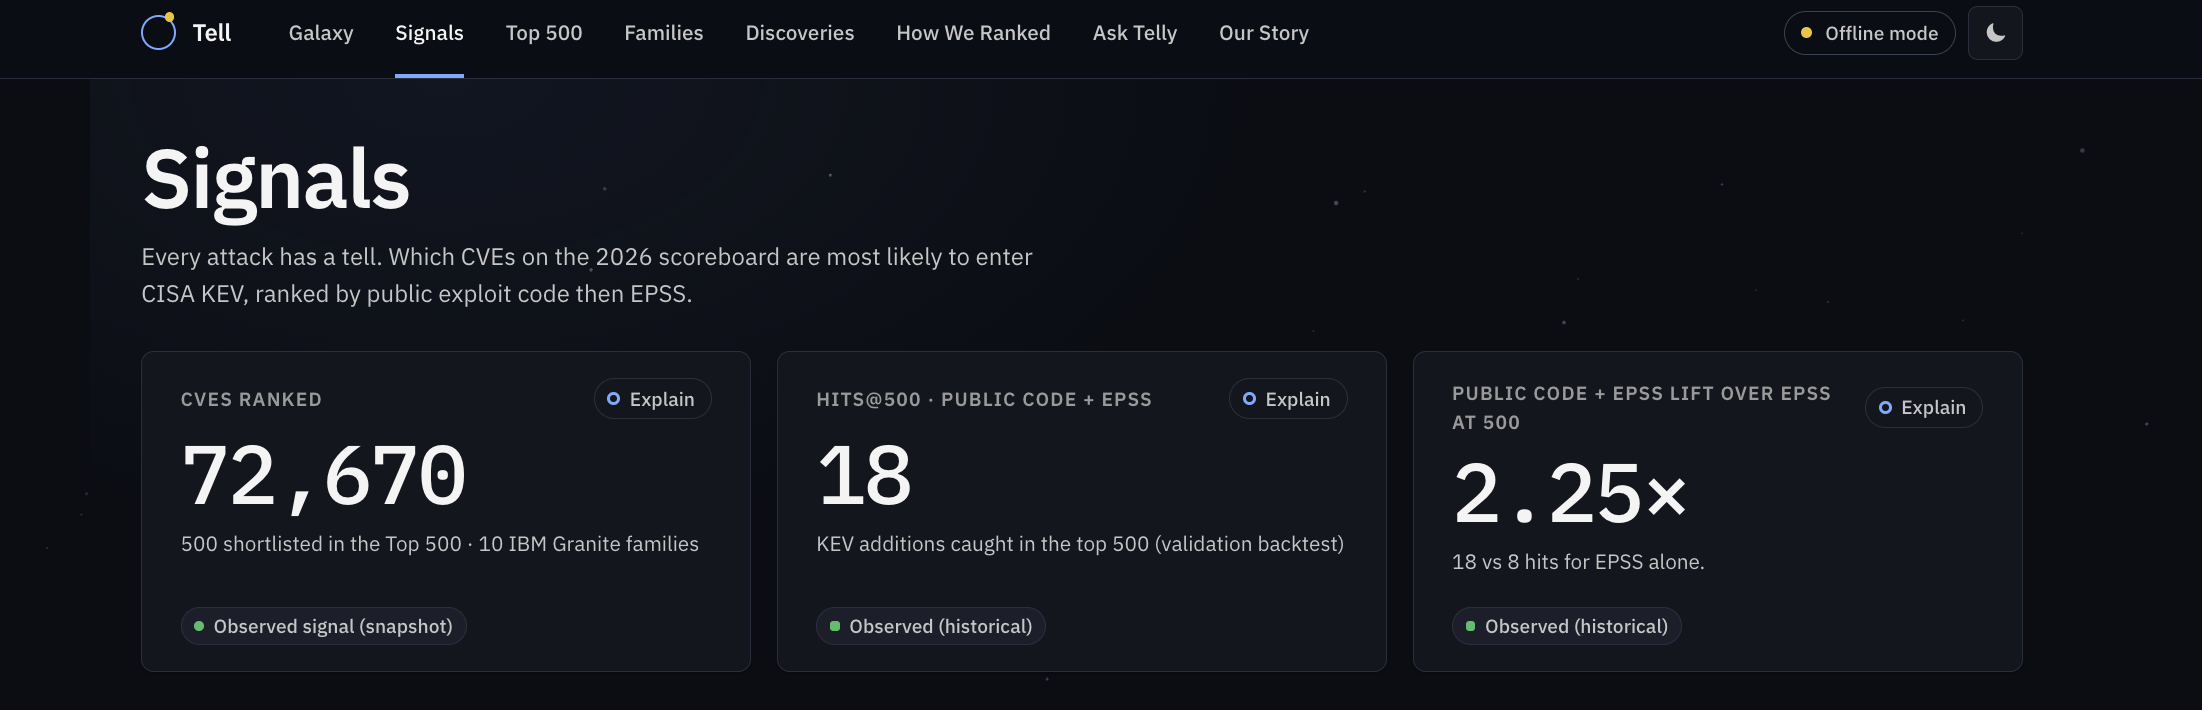
Headline numbers and how EPSS and exploit code spread across the ranking.

TELL - Every Attack Has a Tell
Inspiration
Every year, tens of thousands of cybersecurity vulnerabilities are discovered, yet only a small fraction are confirmed to have been exploited. Despite this, many organizations still prioritize vulnerabilities using CVSS scores, which measure how damaging an attack could be, rather than how likely exploitation is to occur.
We noticed that vulnerabilities often show warning signs before entering CISA's Known Exploited Vulnerabilities (KEV) catalog, such as publicly available exploit code or rising exploitation probability scores.
This inspired one question:
Can we identify which vulnerabilities are most likely to be exploited before they enter the KEV catalog, and uncover the hidden patterns that explain why?
That question became TELL.
We wanted to build something that doesn't just identify which vulnerabilities deserve attention, but also helps people understand why.
What It Does
TELL analyzes 72,670 vulnerabilities from IBM's 2026 benchmark and identifies the 500 most likely to enter CISA's KEV catalog.
It combines historical data, machine learning, and IBM Granite semantic analysis into an interactive cybersecurity experience.
Instead of displaying thousands of vulnerabilities in a traditional table, TELL transforms them into an interactive galaxy that makes cybersecurity data easier to explore.
Our platform includes:
- Interactive Galaxy: Every vulnerability is represented as a star. Its position reflects its ranking, its size represents EPSS, and each spiral arm corresponds to an IBM Granite vulnerability family. The Top 500 vulnerabilities glow, and users can select stars to explore their details.
- Top 500 Rankings: A searchable and filterable list of vulnerabilities prioritized by our ranking method.
- Families & Discoveries: Interactive visualizations revealing the relationships and historical exploitation patterns identified through IBM Granite.
- How We Ranked: A transparent comparison of our prediction methods and why we selected our final approach.
- Telly, Our AI Assistant: A Gemini-powered assistant that helps users explore vulnerabilities and understand our findings. Its answers use data-retrieval tools and grounding checks to reduce unsupported claims.
- Our Story: An explanation of our methodology, research findings, and limitations.
Throughout the platform, we distinguish between historical observations, model predictions, and AI-generated explanations.
Live Project: Explore TELL
How We Built It
1. Data Analysis and Preparation
We analyzed IBM's vulnerability datasets, incorporating information from NIST, CISA KEV, historical EPSS scores, CVSS severity scores, and publicly available exploit indicators.
Our goal was to determine which signals were most useful for identifying vulnerabilities that would subsequently enter the KEV catalog.
We developed a time-aware evaluation process using 2024 data for training and 2025 data for validation, while restricting the ranking features to information available at the relevant snapshot dates.
2. Building and Evaluating Our Ranking Models
We compared four approaches:
| Method | Hits@100 | Hits@250 | Hits@500 |
|---|---|---|---|
| Public exploit code + EPSS | 8 | 15 | 18 |
| Logistic Regression | 7 | 14 | 16 |
| LightGBM | 8 | 10 | 16 |
| EPSS alone | 4 | 8 | 8 |
Hits@500 measures how many vulnerabilities subsequently added to KEV were identified among the 500 highest-ranked candidates in our historical evaluation.
One of our biggest discoveries was unexpected:
Our simplest approach outperformed our more complex machine-learning models.
Prioritizing vulnerabilities with publicly available exploit code, followed by EPSS scores, identified 18 KEV cases in the Top 500, compared with 16 for Logistic Regression and LightGBM and 8 for EPSS alone.
Rather than choosing the most complicated model, we selected the approach that performed best in our evaluation.
Our final ranking uses five indicators from the 2026 benchmark:
epssexploitdbmetasploitnucleipoc_github
We excluded fields that could reveal information unavailable at prediction time.
The final ranking was exported as top500.csv.
3. Discovering Hidden Patterns with IBM Granite
We used IBM Granite Embedding Small English R2 to analyze vulnerability descriptions and uncover relationships that traditional classifications might miss.
Our process involved:
- Converting 2,500 historical CVE descriptions into semantic embeddings using IBM Granite.
- Applying K-Means clustering to identify 10 vulnerability families.
- Comparing these families against historical KEV records and CWE classifications.
- Correcting historical family statistics for our enriched sampling design.
- Assigning all 72,670 benchmark vulnerabilities to the established semantic families.
These families included privilege escalation, remote code execution, authentication bypass, and other technical vulnerability patterns.
This analysis helped us investigate not just which vulnerabilities were historically exploited, but what characteristics and relationships they shared.
4. Building the Interactive Platform
We built TELL using:
- FastAPI: A read-only backend API that serves vulnerability rankings and research results.
- TypeScript, Chart.js, and Canvas: Power the interactive galaxy, charts, and visualizations.
- IBM Granite: Generates semantic representations of vulnerability descriptions.
- Google Gemini 2.5 Flash: Powers Telly, our AI assistant.
- Docker and Nginx: Package and serve the application with HTTPS and security controls.
- Vultr: Hosts our deployed platform.
Our interface uses IBM Plex typography and IBM Carbon-inspired colours, combined with a space-themed design that transforms complex vulnerability data into an accessible visual experience.
Challenges We Ran Into
Preventing Data Leakage
One of our biggest challenges was ensuring that our models weren't using information from the future.
Some vulnerability records contain information updated after their original disclosure dates. Using these fields for historical predictions could lead to misleading results.
We addressed this by restricting the ranking model to historical snapshot signals and keeping Granite's semantic findings separate from the final ranking model.
Correcting Sampling Bias
Our historical Granite research sample included all matching KEV cases, meaning exploited vulnerabilities were intentionally overrepresented.
We recognized that raw exploitation rates could be misleading, so we applied Horvitz–Thompson population weighting to account for unequal sampling probabilities.
When Simpler Models Performed Better
We expected LightGBM to outperform our simpler methods.
Instead, our exploit-code-first approach achieved the highest Hits@500 score.
This challenged our original assumptions and reminded us that more complex machine learning doesn't automatically produce better results.
Keeping AI Explanations Grounded
We wanted Telly to help users understand cybersecurity data without inventing facts.
We implemented data-retrieval tools and grounding checks to verify CVE-specific information before presenting responses.
Accomplishments That We're Proud Of
1. Discovering Vulnerability Patterns Beyond Traditional Classifications
IBM Granite uncovered semantic relationships between vulnerabilities with different CWE classifications and identified distinctions within shared categories.
Three Granite families—Privilege Escalation, Remote Code Execution, and Remote Code Execution with Path Traversal/File Upload—contained 64.67% of the 317 KEV cases in our historical research sample.
After adjusting for the sampling design, these families represented approximately 31.45% of the estimated historical vulnerability population.
2. Testing Our Discoveries Against Later Data
In our 2024-to-2025 historical validation, selected semantic families contained:
- 64.24% of the 2025 KEV cases.
- 33.28% of the evaluated vulnerabilities.
- A reported concentration ratio of 1.93×.
These findings suggest that semantic relationships may provide useful historical risk context.
However, historical description updates and the need to verify when the selected families were chosen limit how strongly we can interpret this as future predictive performance.
3. Making 72,670 Vulnerabilities Explorable
We transformed the entire 2026 benchmark into a single interactive galaxy.
Instead of presenting thousands of disconnected records, users can explore vulnerability rankings, identify semantic families, and investigate individual CVEs through an interactive interface.
4. Choosing Evidence Over Complexity
Our team evaluated multiple approaches and selected the one that performed best, even though it wasn't our most sophisticated model.
We also documented our research limitations and made our analysis transparent.
What We Learned
1. Severity doesn't tell the full story.
CVSS measures potential technical impact, but it doesn't directly predict whether a vulnerability will be exploited. Historical exploit indicators and EPSS provide additional information for prioritization.
2. Vulnerability descriptions contain valuable information.
We found that:
- 8.74% of benchmark vulnerabilities lacked CVSS v3 scores.
- 6.82% lacked CWE classifications.
- 100% had descriptions available.
IBM Granite allowed us to analyze semantic relationships even when structured metadata was incomplete.
3. Traditional classifications can overlook meaningful relationships.
Our research found that vulnerabilities sharing the same CWE classification could belong to different semantic families, while vulnerabilities with different CWE labels could have highly similar descriptions.
4. Good data science means questioning our own results.
We learned the importance of preventing data leakage, correcting sampling bias, comparing simple and complex models, and acknowledging limitations.
Most importantly, we learned that a useful prediction isn't necessarily the most complicated one—it's the one supported by evidence.
What's Next for TELL
We plan to continue developing TELL by:
- Evaluating whether Granite-derived features can safely improve our ranking model.
- Calibrating ranking scores into more interpretable probabilities.
- Incorporating more frequent vulnerability-data snapshots.
- Expanding beyond KEV with additional verified exploitation evidence.
- Introducing human-reviewed investigation workflows using IBM watsonx Orchestrate.
Our long-term goal is to help cybersecurity teams move beyond severity-based prioritization toward more informed, evidence-driven vulnerability investigation.
Every attack has a tell. We built TELL to help uncover it.
Built With
- canvas
- chart.js
- cybersecurity
- data-science
- docker
- epss
- fastapi
- google-gemini
- huggingface
- ibm-granite
- lets-encrypt
- lightgbm
- machine-learning
- nginx
- pandas
- python
- scikit-learn
- typescript
- vite
- vultr


