-
-
-
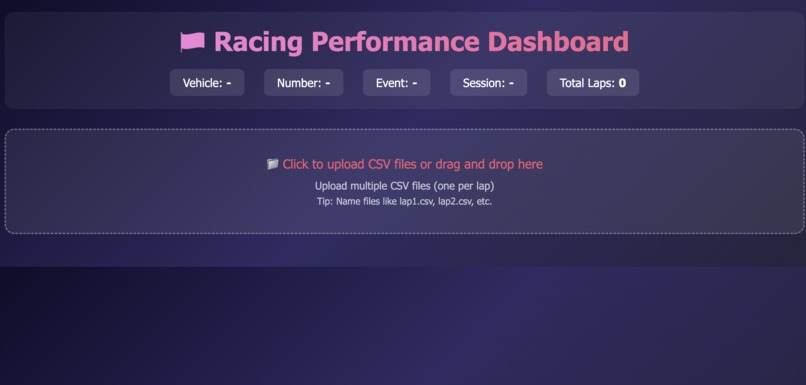
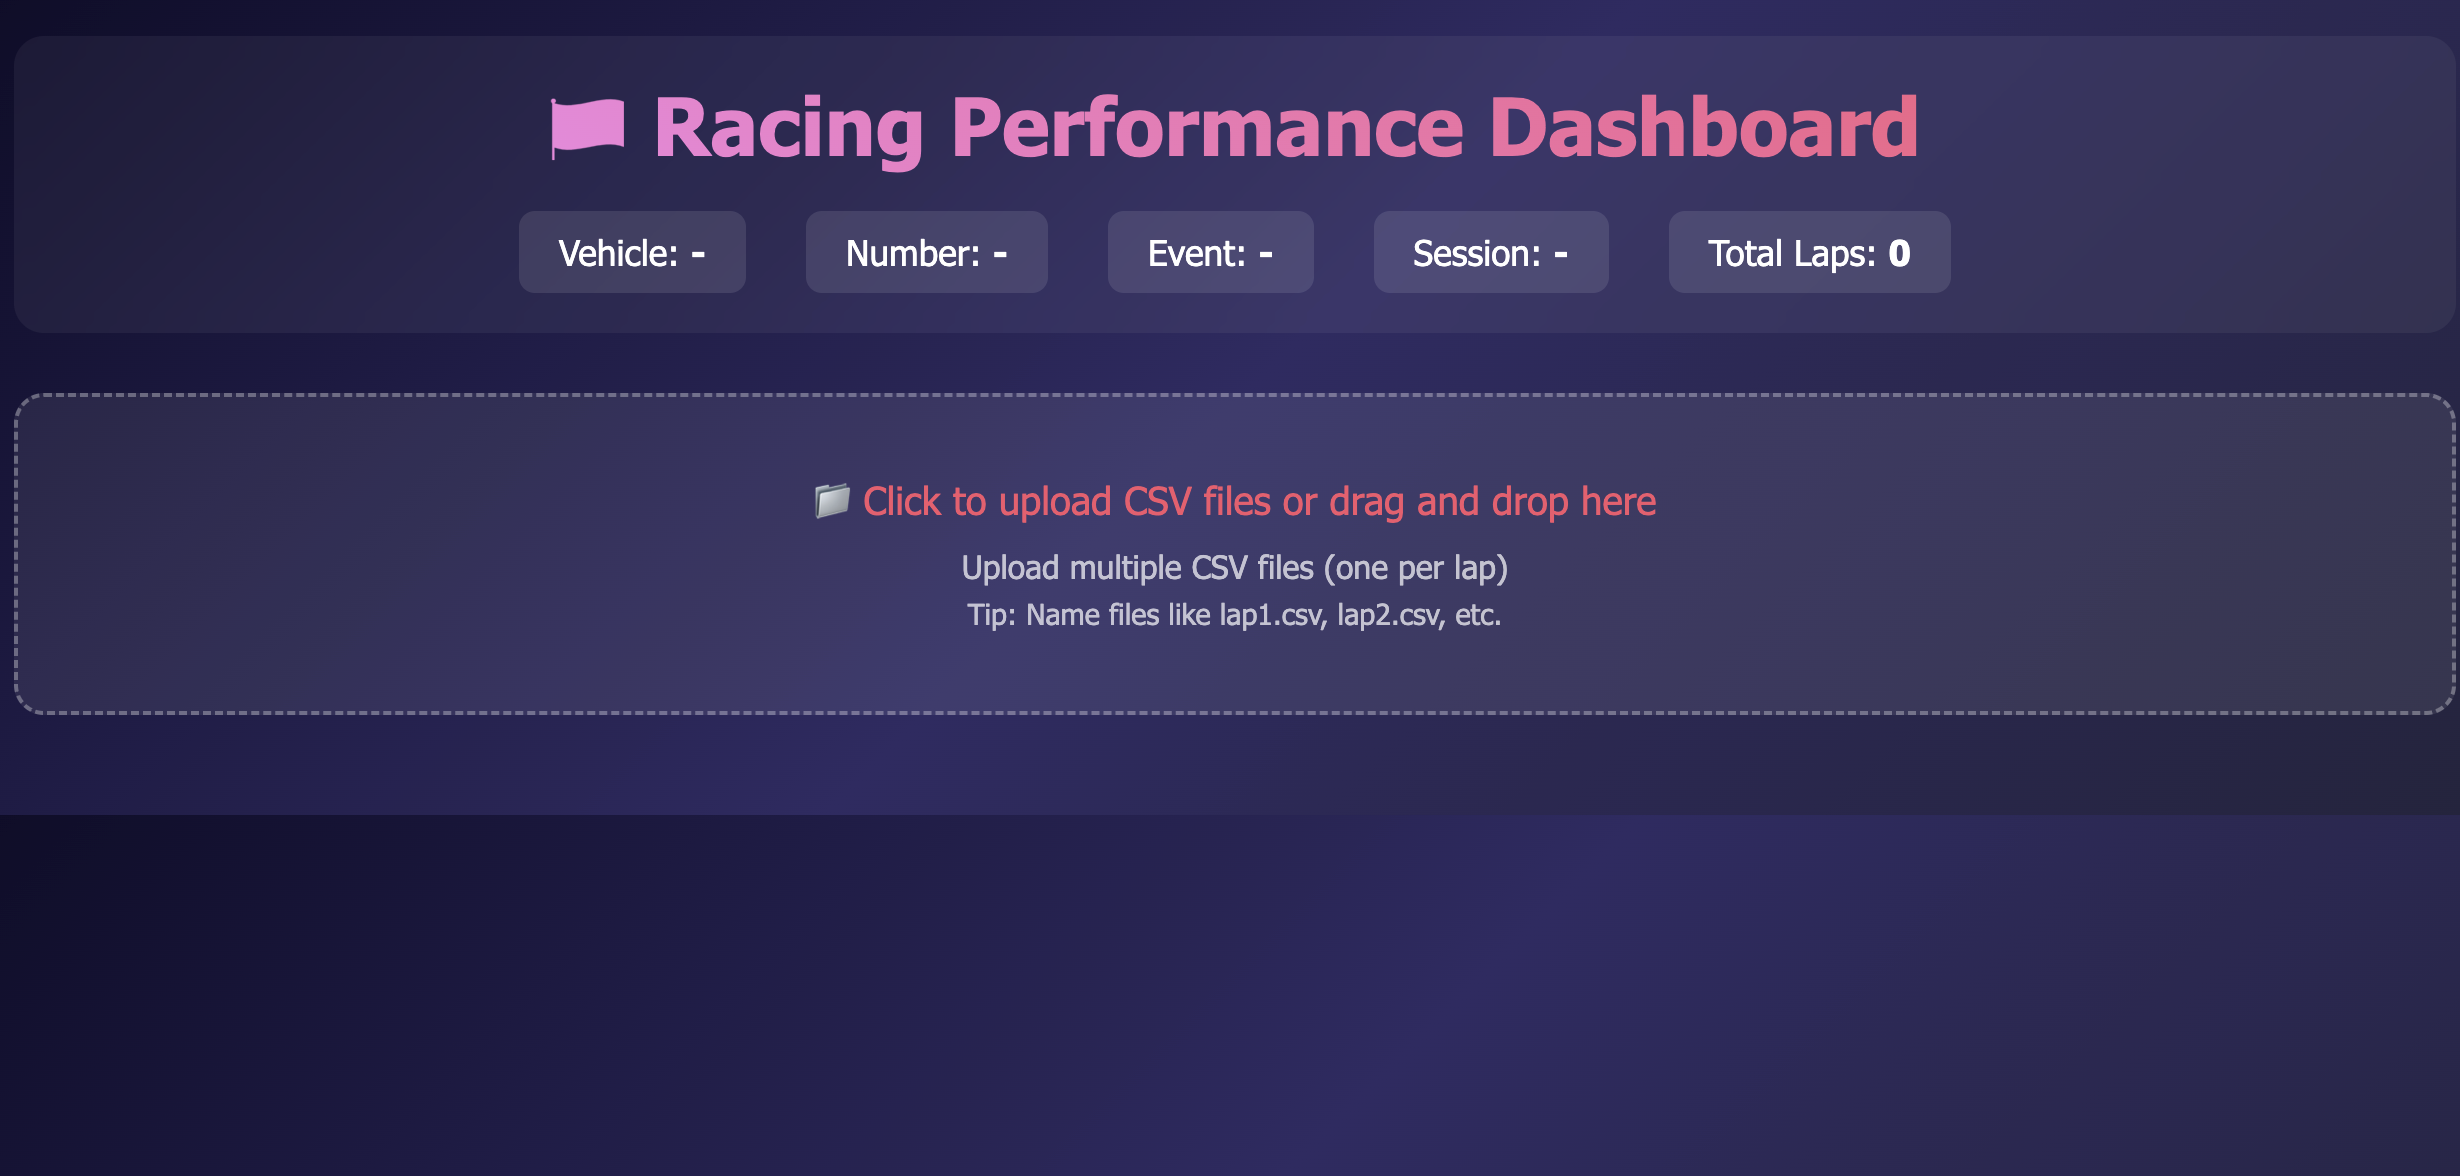
dashboard
-
Inspiration
By combining the on-car recorded data with the perfomance results your vehicle can be properly validated. The overall mission of this hackathon is to use the provided race datasets to develop a project that provides novel insights or tools for the racing community
What it does
This solution is a data-driven application designed to enhance driver performance analysis by providing detailed visualization and insight, optimizing speed and strategy on the track. Provide a visual tool to help drivers optimize their racing line, thereby identifying areas for performance improvement. Using racing telemetry data, here are 6 key visualizations and metrics that would be most effective for a performance dashboard: 1. Speed vs. Distance/Time Trace Why valuable: This is the foundation of lap analysis. Overlaying multiple laps shows exactly where a driver is gaining or losing time. You can identify braking points, acceleration zones, and corner exit speeds. The data includes speed and lap distance (Laptrigger_lapdist_dls), making this immediately actionable. 2. G-Force Plot (Lateral + Longitudinal Acceleration) Why valuable: The accx_can and accy_can data reveals how aggressively the car is being driven through corners and under braking/acceleration. A scatter plot or "traction circle" visualization shows if the driver is using the full grip potential of the tires. Peak lateral G-forces indicate cornering performance, while longitudinal shows braking and acceleration efficiency.
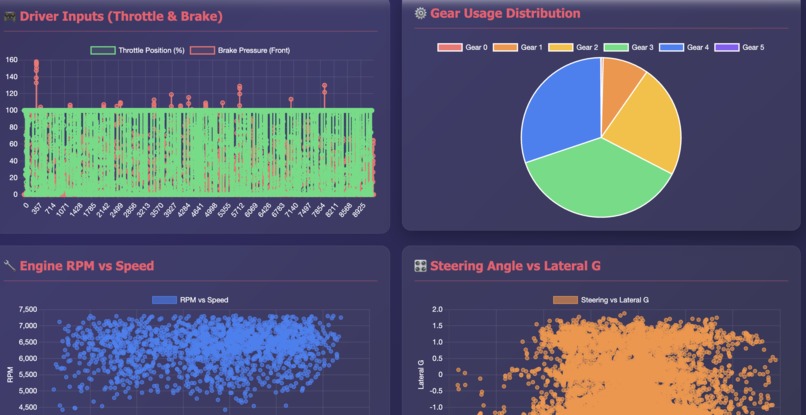
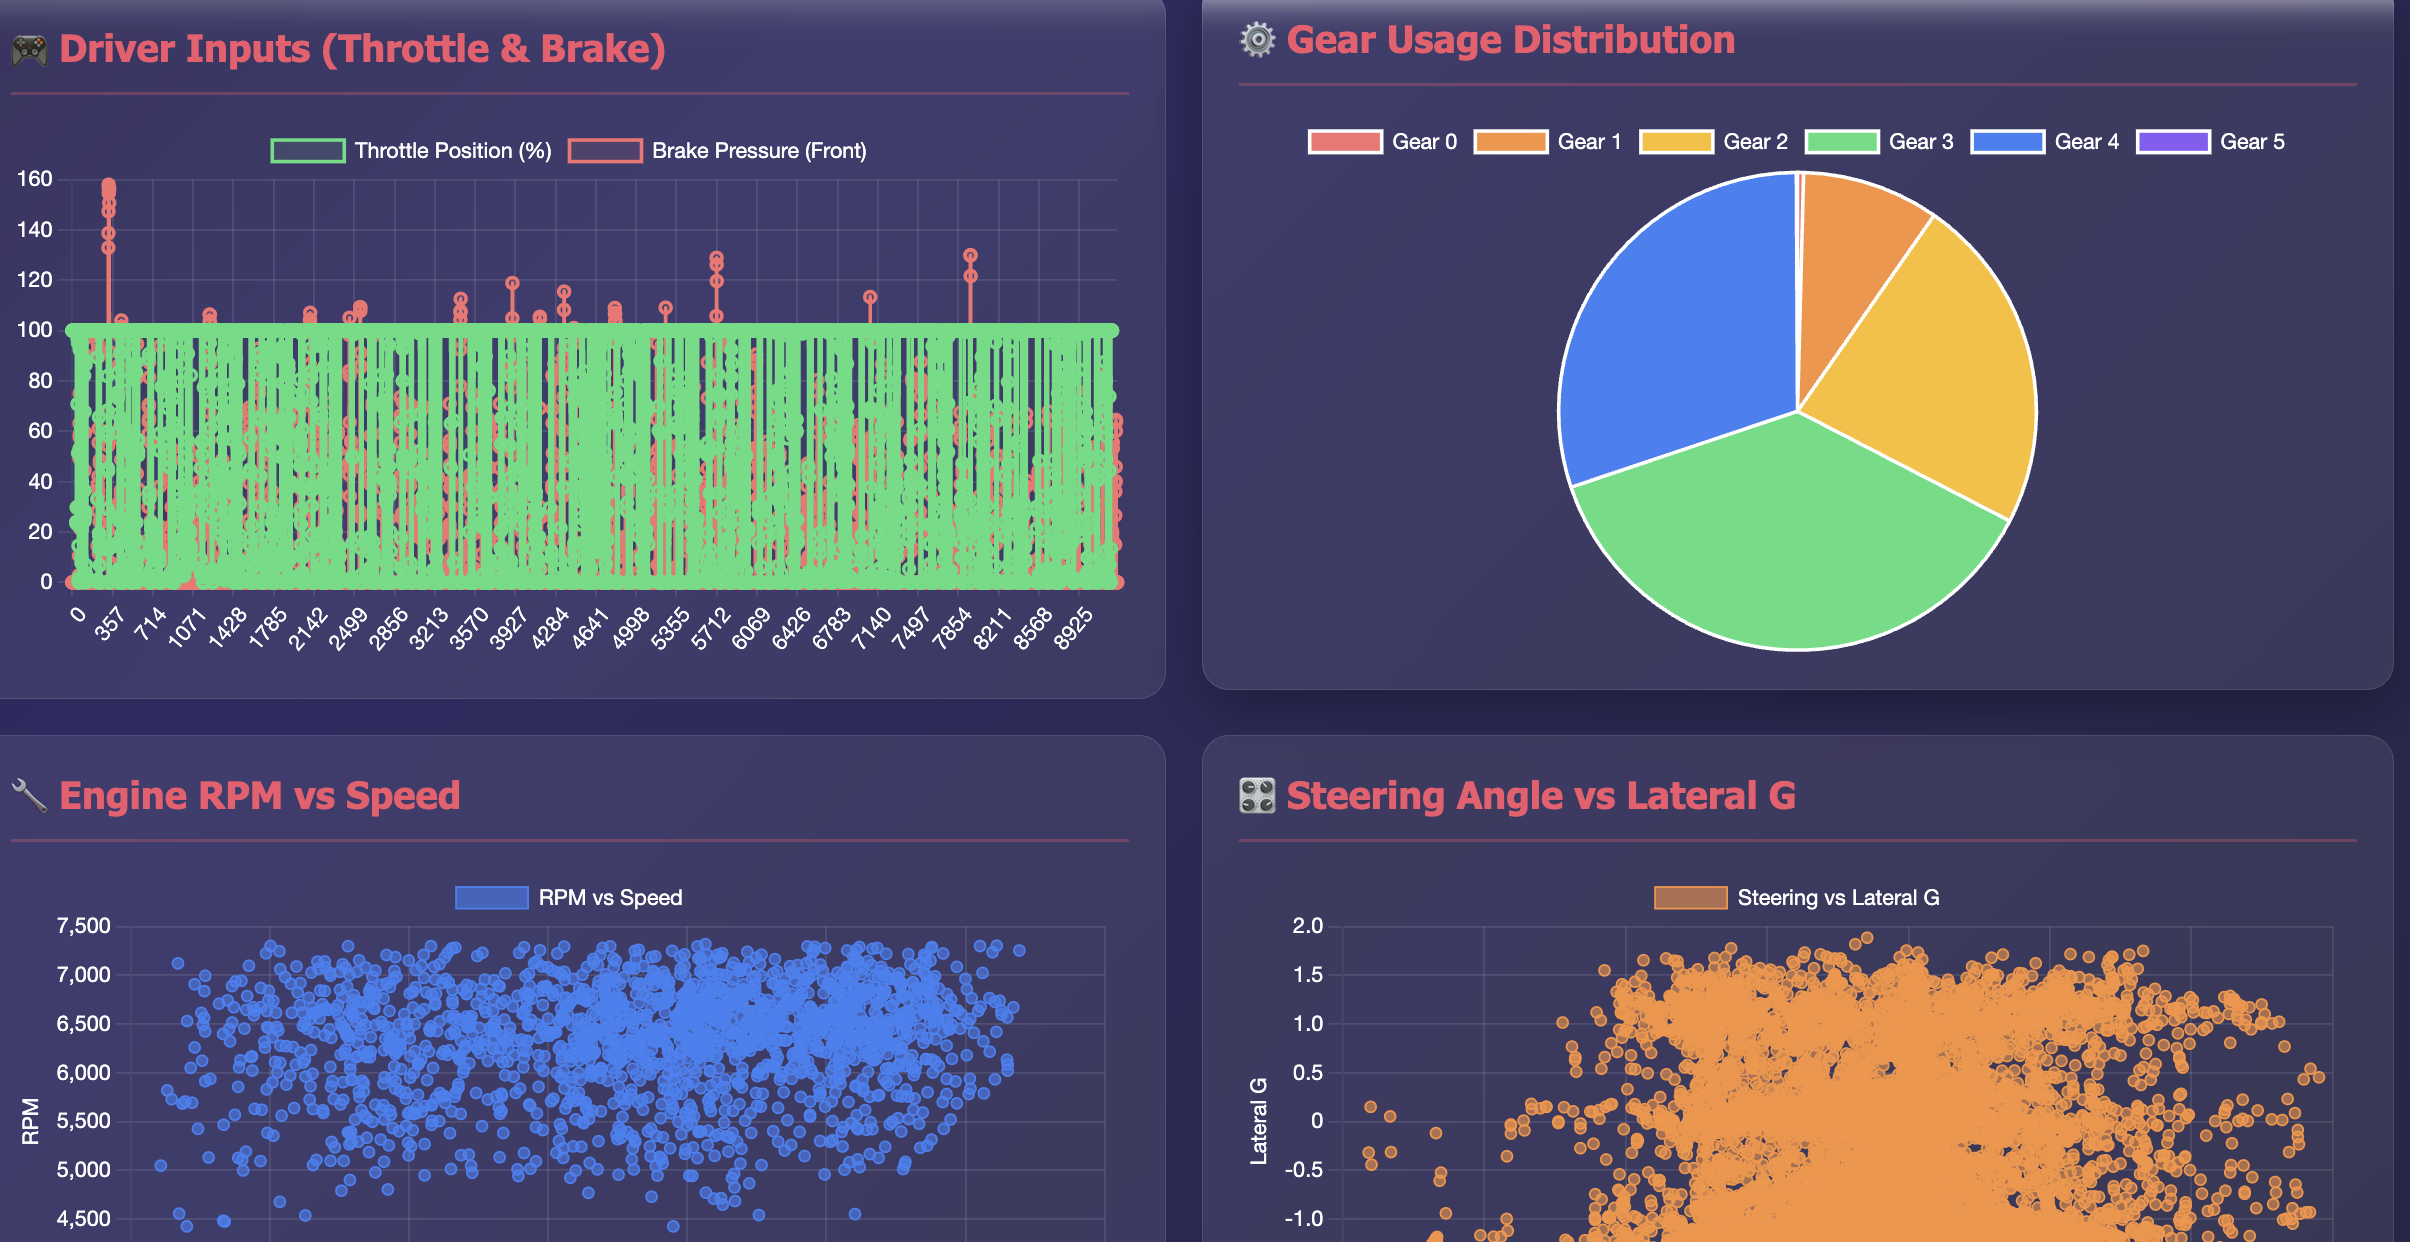
3. Throttle Position vs. Brake Pressure Overlay Why valuable: The aps (accelerator pedal position), pbrake_f, and pbrake_r data shows driver inputs. This reveals driving technique - smooth vs. aggressive inputs, trail braking behavior, and throttle application timing. Comparing this across laps identifies inconsistencies or areas for improvement. 4. Gear Selection Heatmap on Track Map Why valuable: Using gear, VBOX_Long_Minutes, and VBOX_Lat_Min (GPS coordinates), you can visualize which gear is being used at each point on track. This helps optimize shift points and identifies if the driver is in the wrong gear for certain corners, affecting acceleration and engine performance. *5. Engine RPM vs. Speed Analysis * Why valuable: The nmot (engine RPM) compared to speed reveals if the driver is optimizing gear ratios and staying in the power band. Low RPM at high speed suggests too tall a gear; high RPM with low speed indicates potential wheel spin or being in too low a gear. Critical for maximizing acceleration. *6. Steering Angle + Lateral G Correlation * Why valuable: Comparing Steering_Angle with accy_can shows how efficiently steering inputs translate to cornering force. Excessive steering angle without proportional lateral G suggests understeer or scrubbing speed. This helps diagnose handling balance and identifies where setup changes might help.
How we built it
created a comprehensive racing performance dashboard with interactive elements using the telemetry data from Barber R1/R2 CSV file. -Speed vs Time Analysis - Line chart showing speed progression throughout the lap -G-Force Traction Circle - Scatter plot showing lateral vs longitudinal acceleration (the classic traction circle used in racing) -Driver Inputs - Throttle position and brake pressure overlaid to show driving technique -Gear Usage Distribution - Pie chart showing time spent in each gear -RPM vs Speed Correlation - Scatter plot revealing gear efficiency and power band usage -Steering Angle vs Lateral G - Shows how steering inputs translate to cornering force -Acceleration Components - Dual line chart tracking both acceleration axes
Challenges we ran into
First time learning telemetry data.
Accomplishments that we're proud of
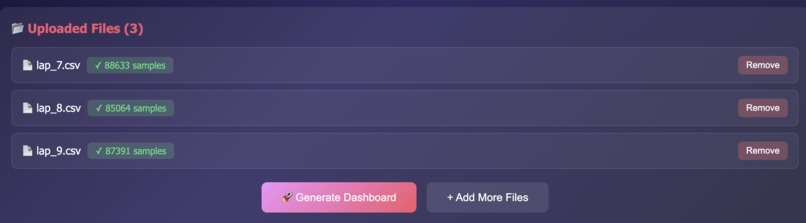
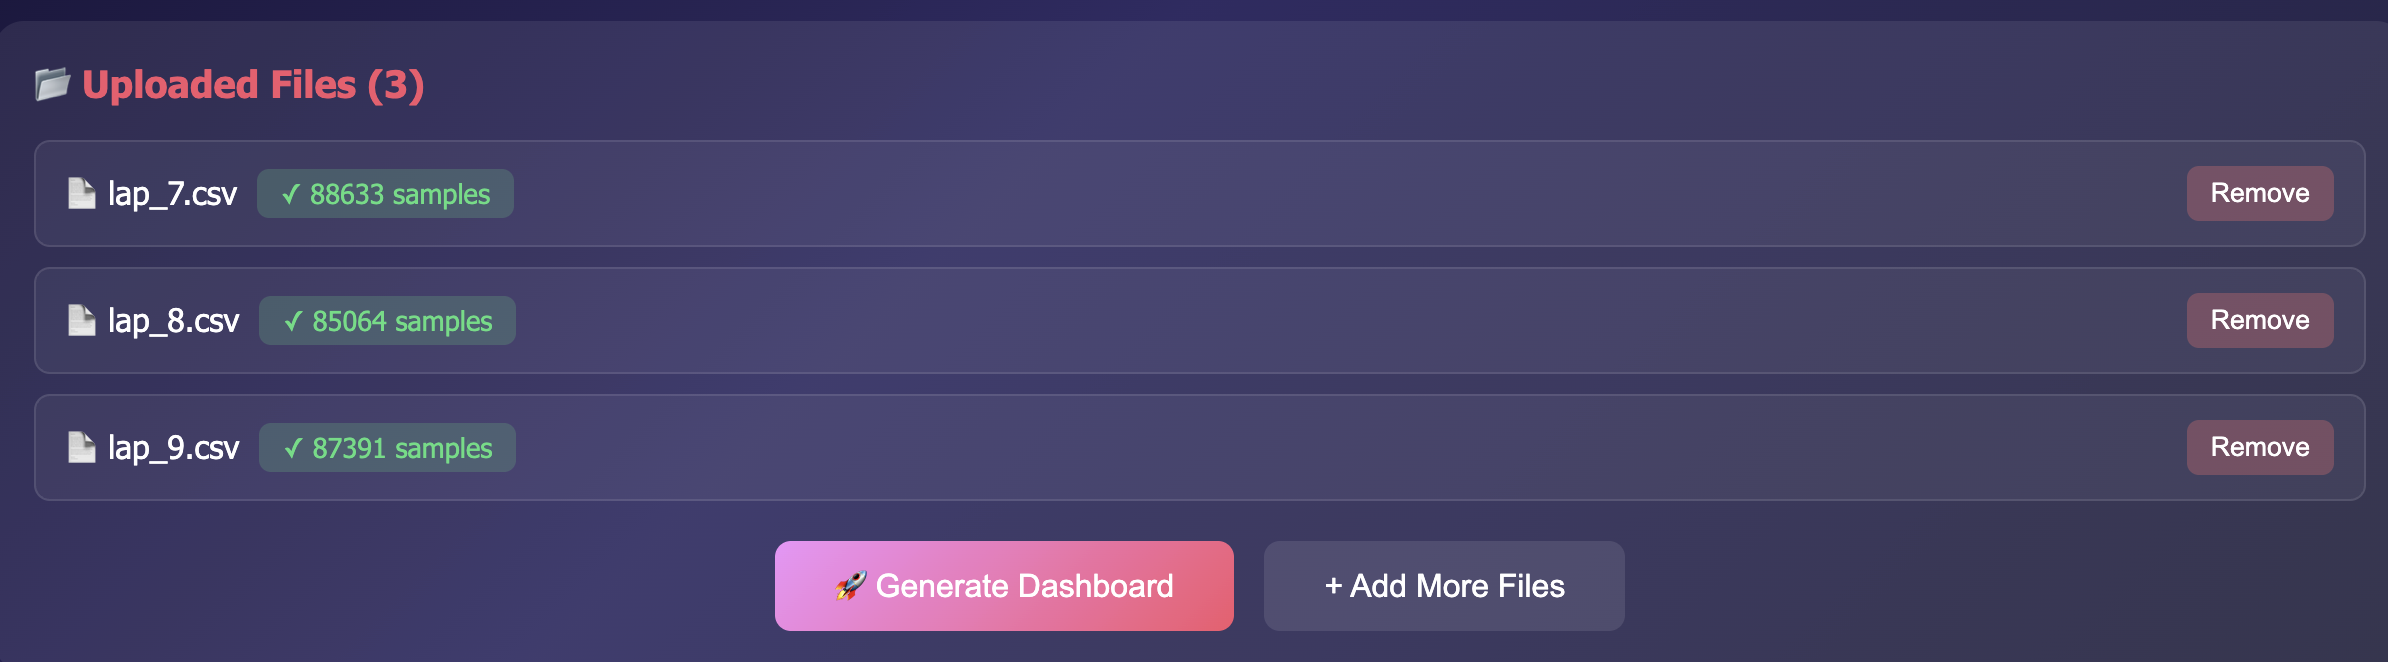
dashboard to include a file upload interface.
Click the upload area to browse for your lap_ .csv file Drag and drop the CSV file directly onto the upload area
What we learned
Telemetry data for data visualization
What's next for TelemetryX dashboard
Leverage high stakes data for Ml model

Log in or sign up for Devpost to join the conversation.