-
-
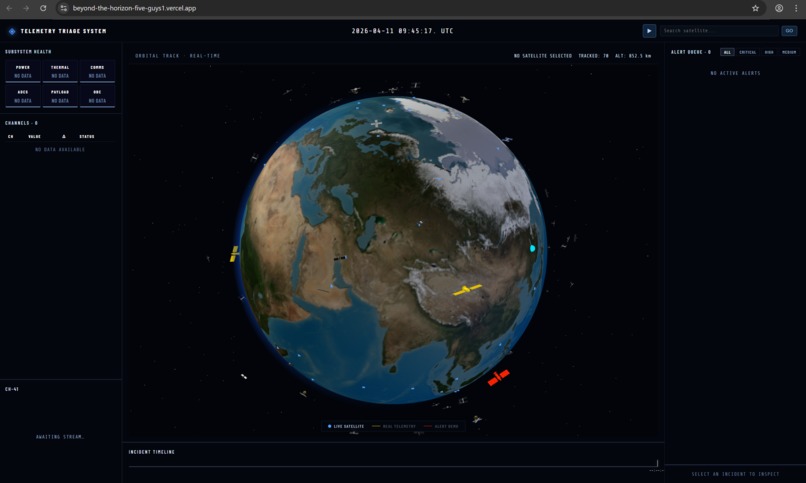
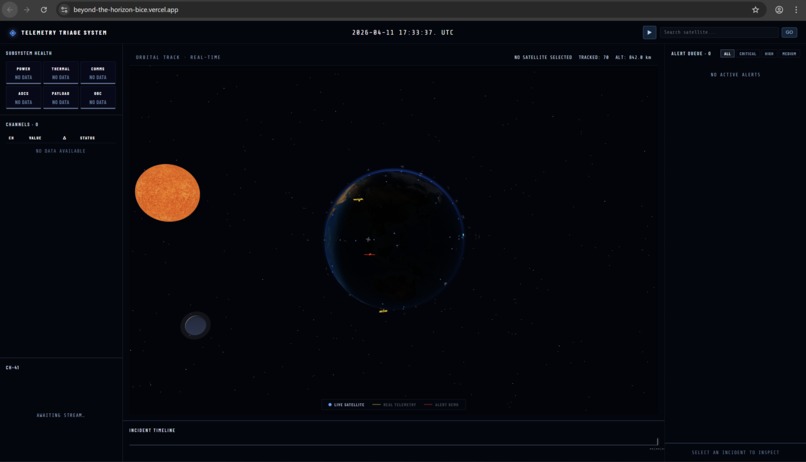
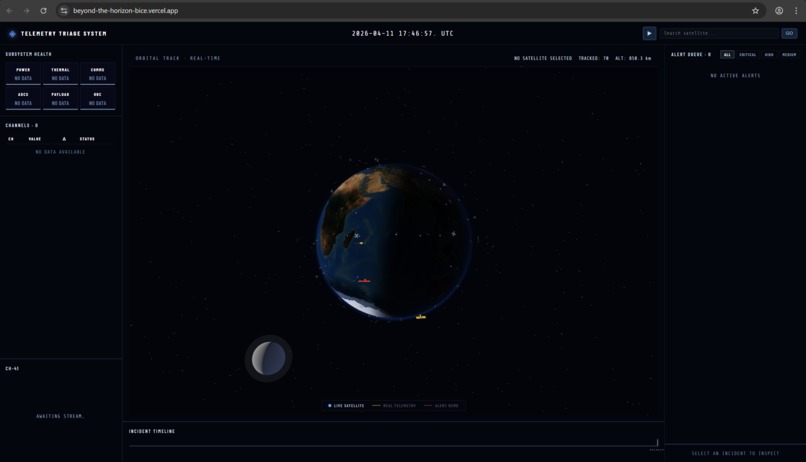
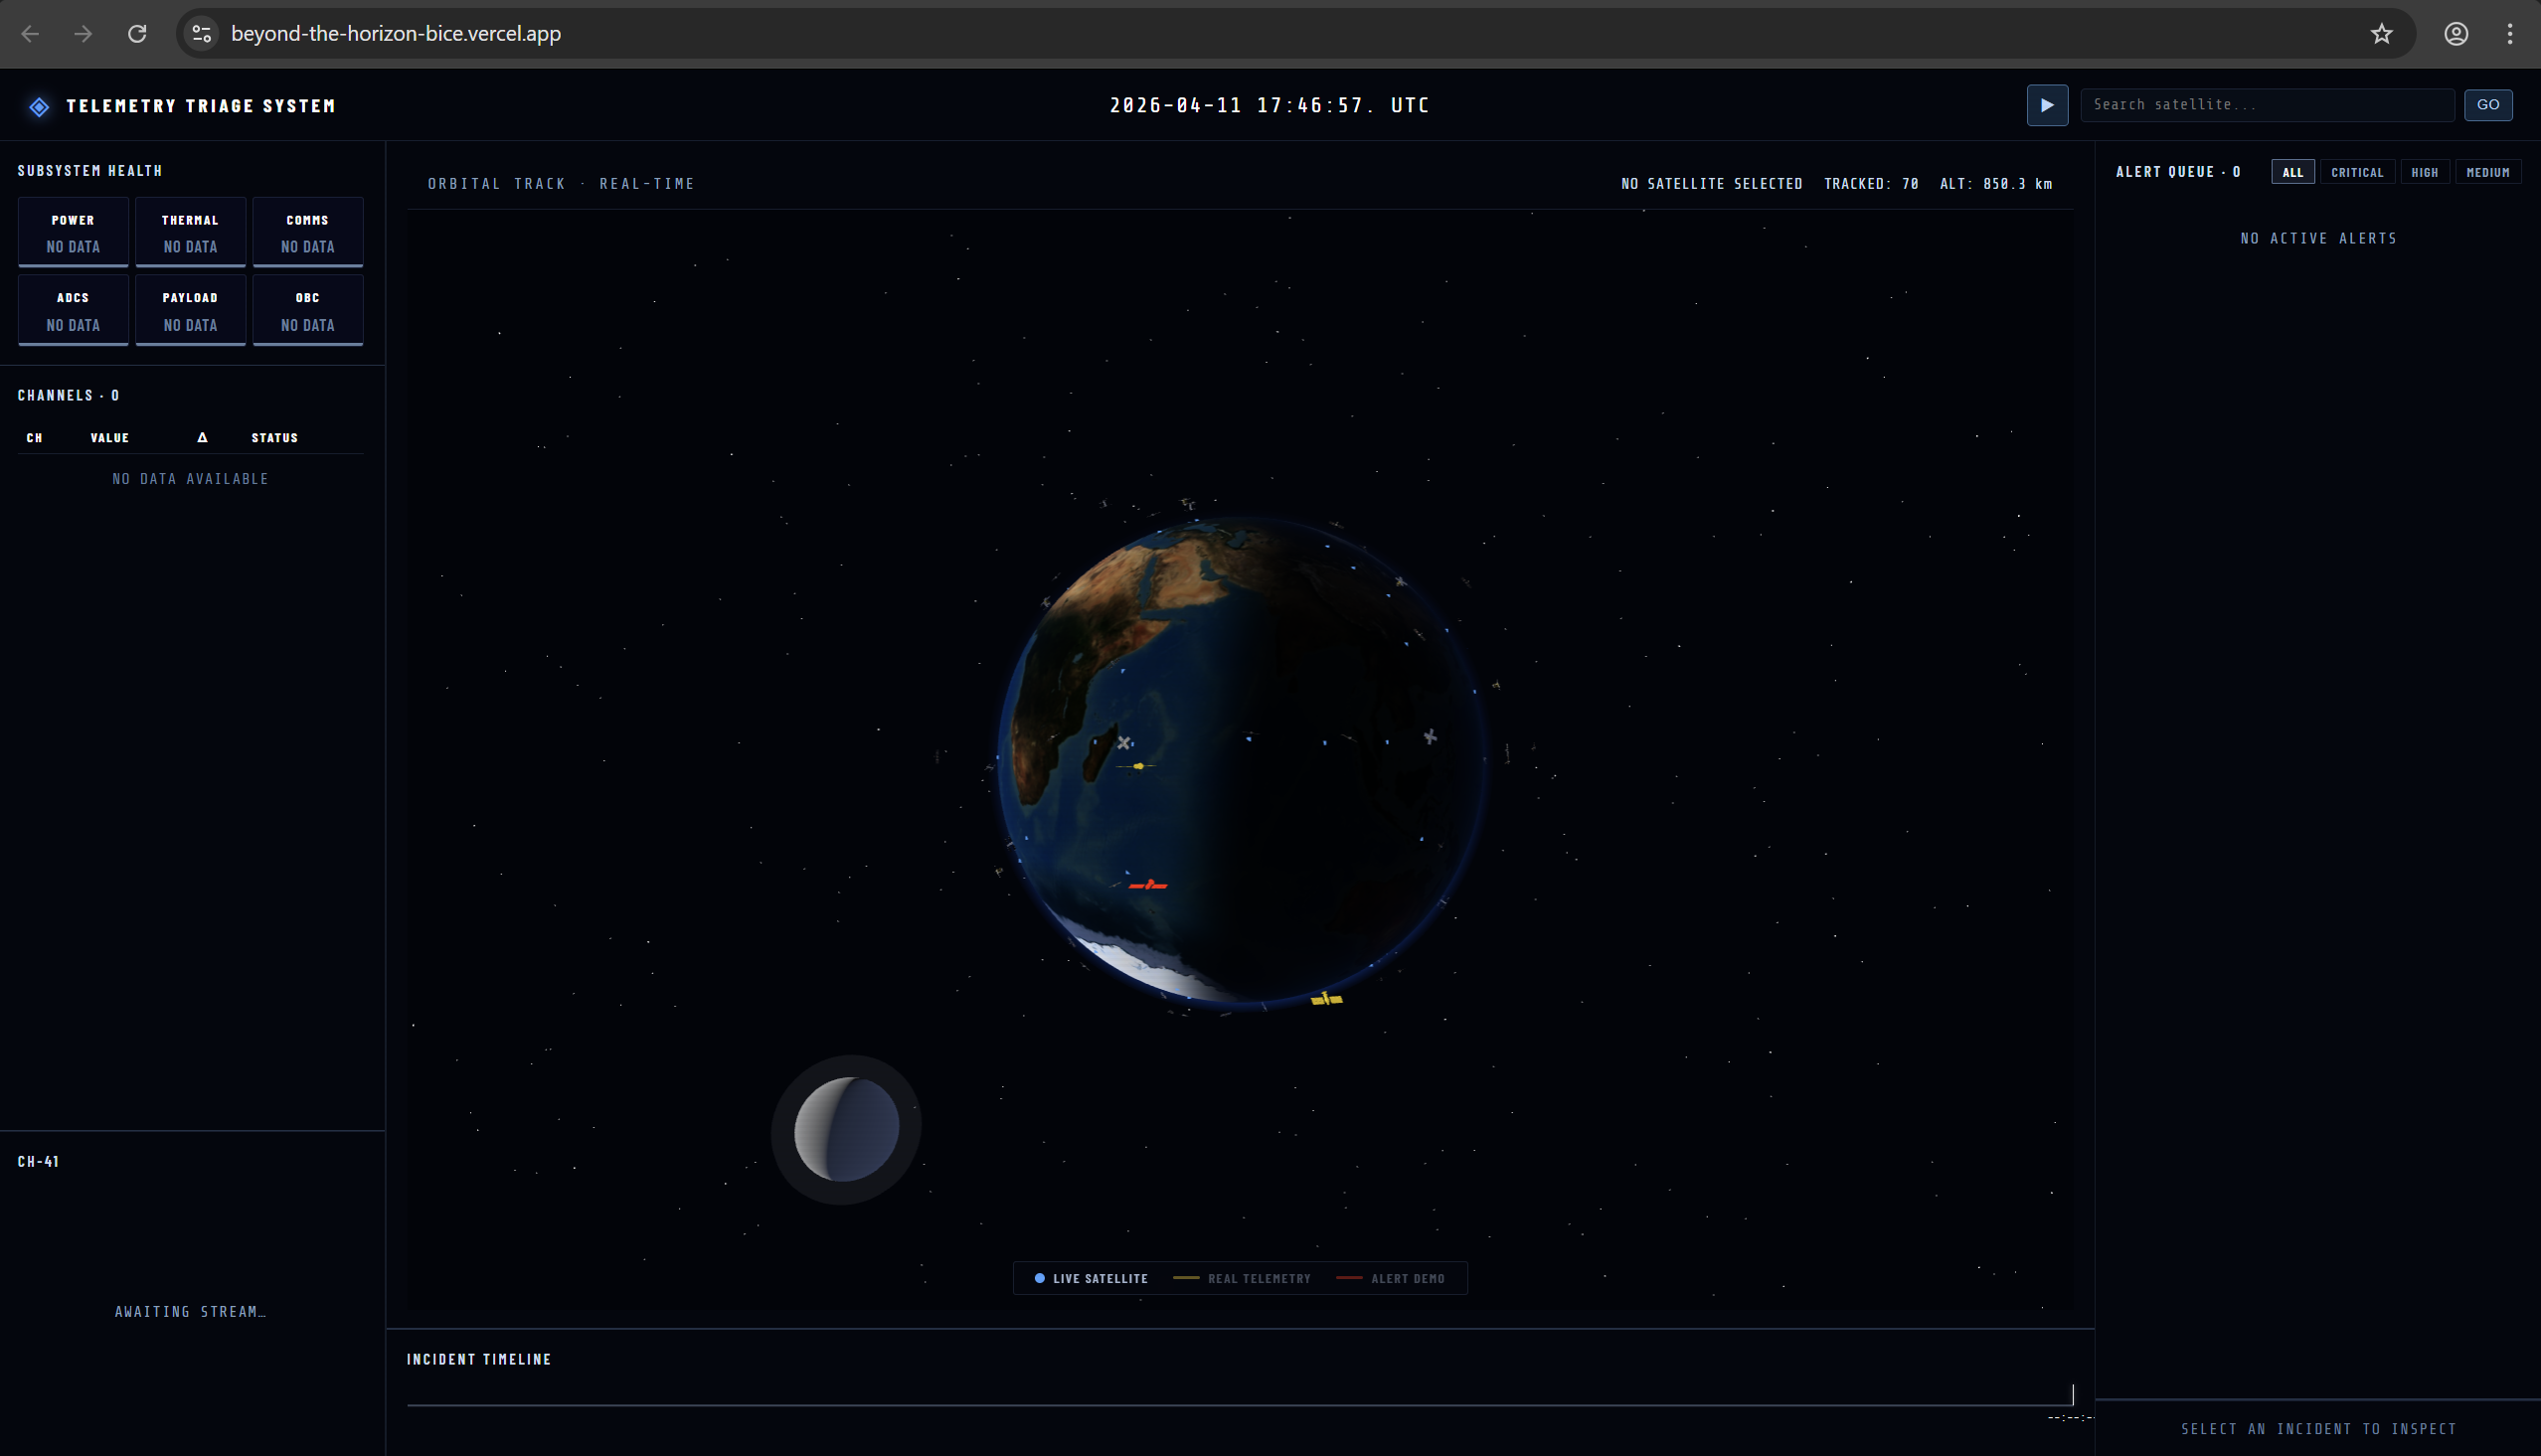
Landing Page
-
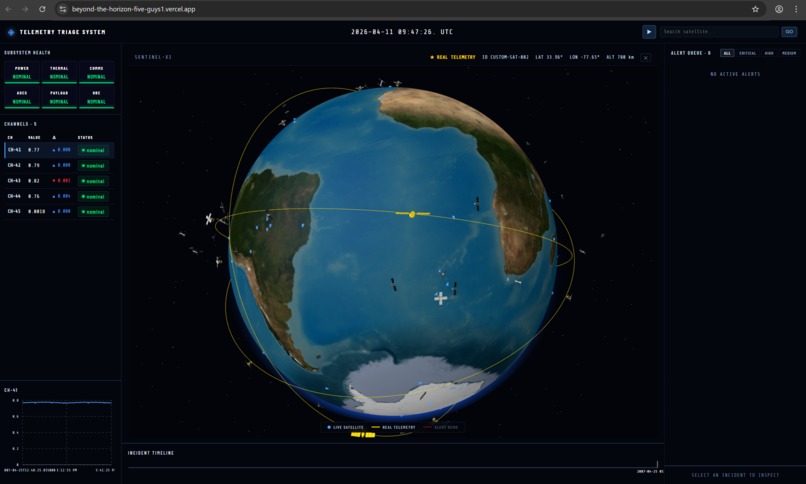
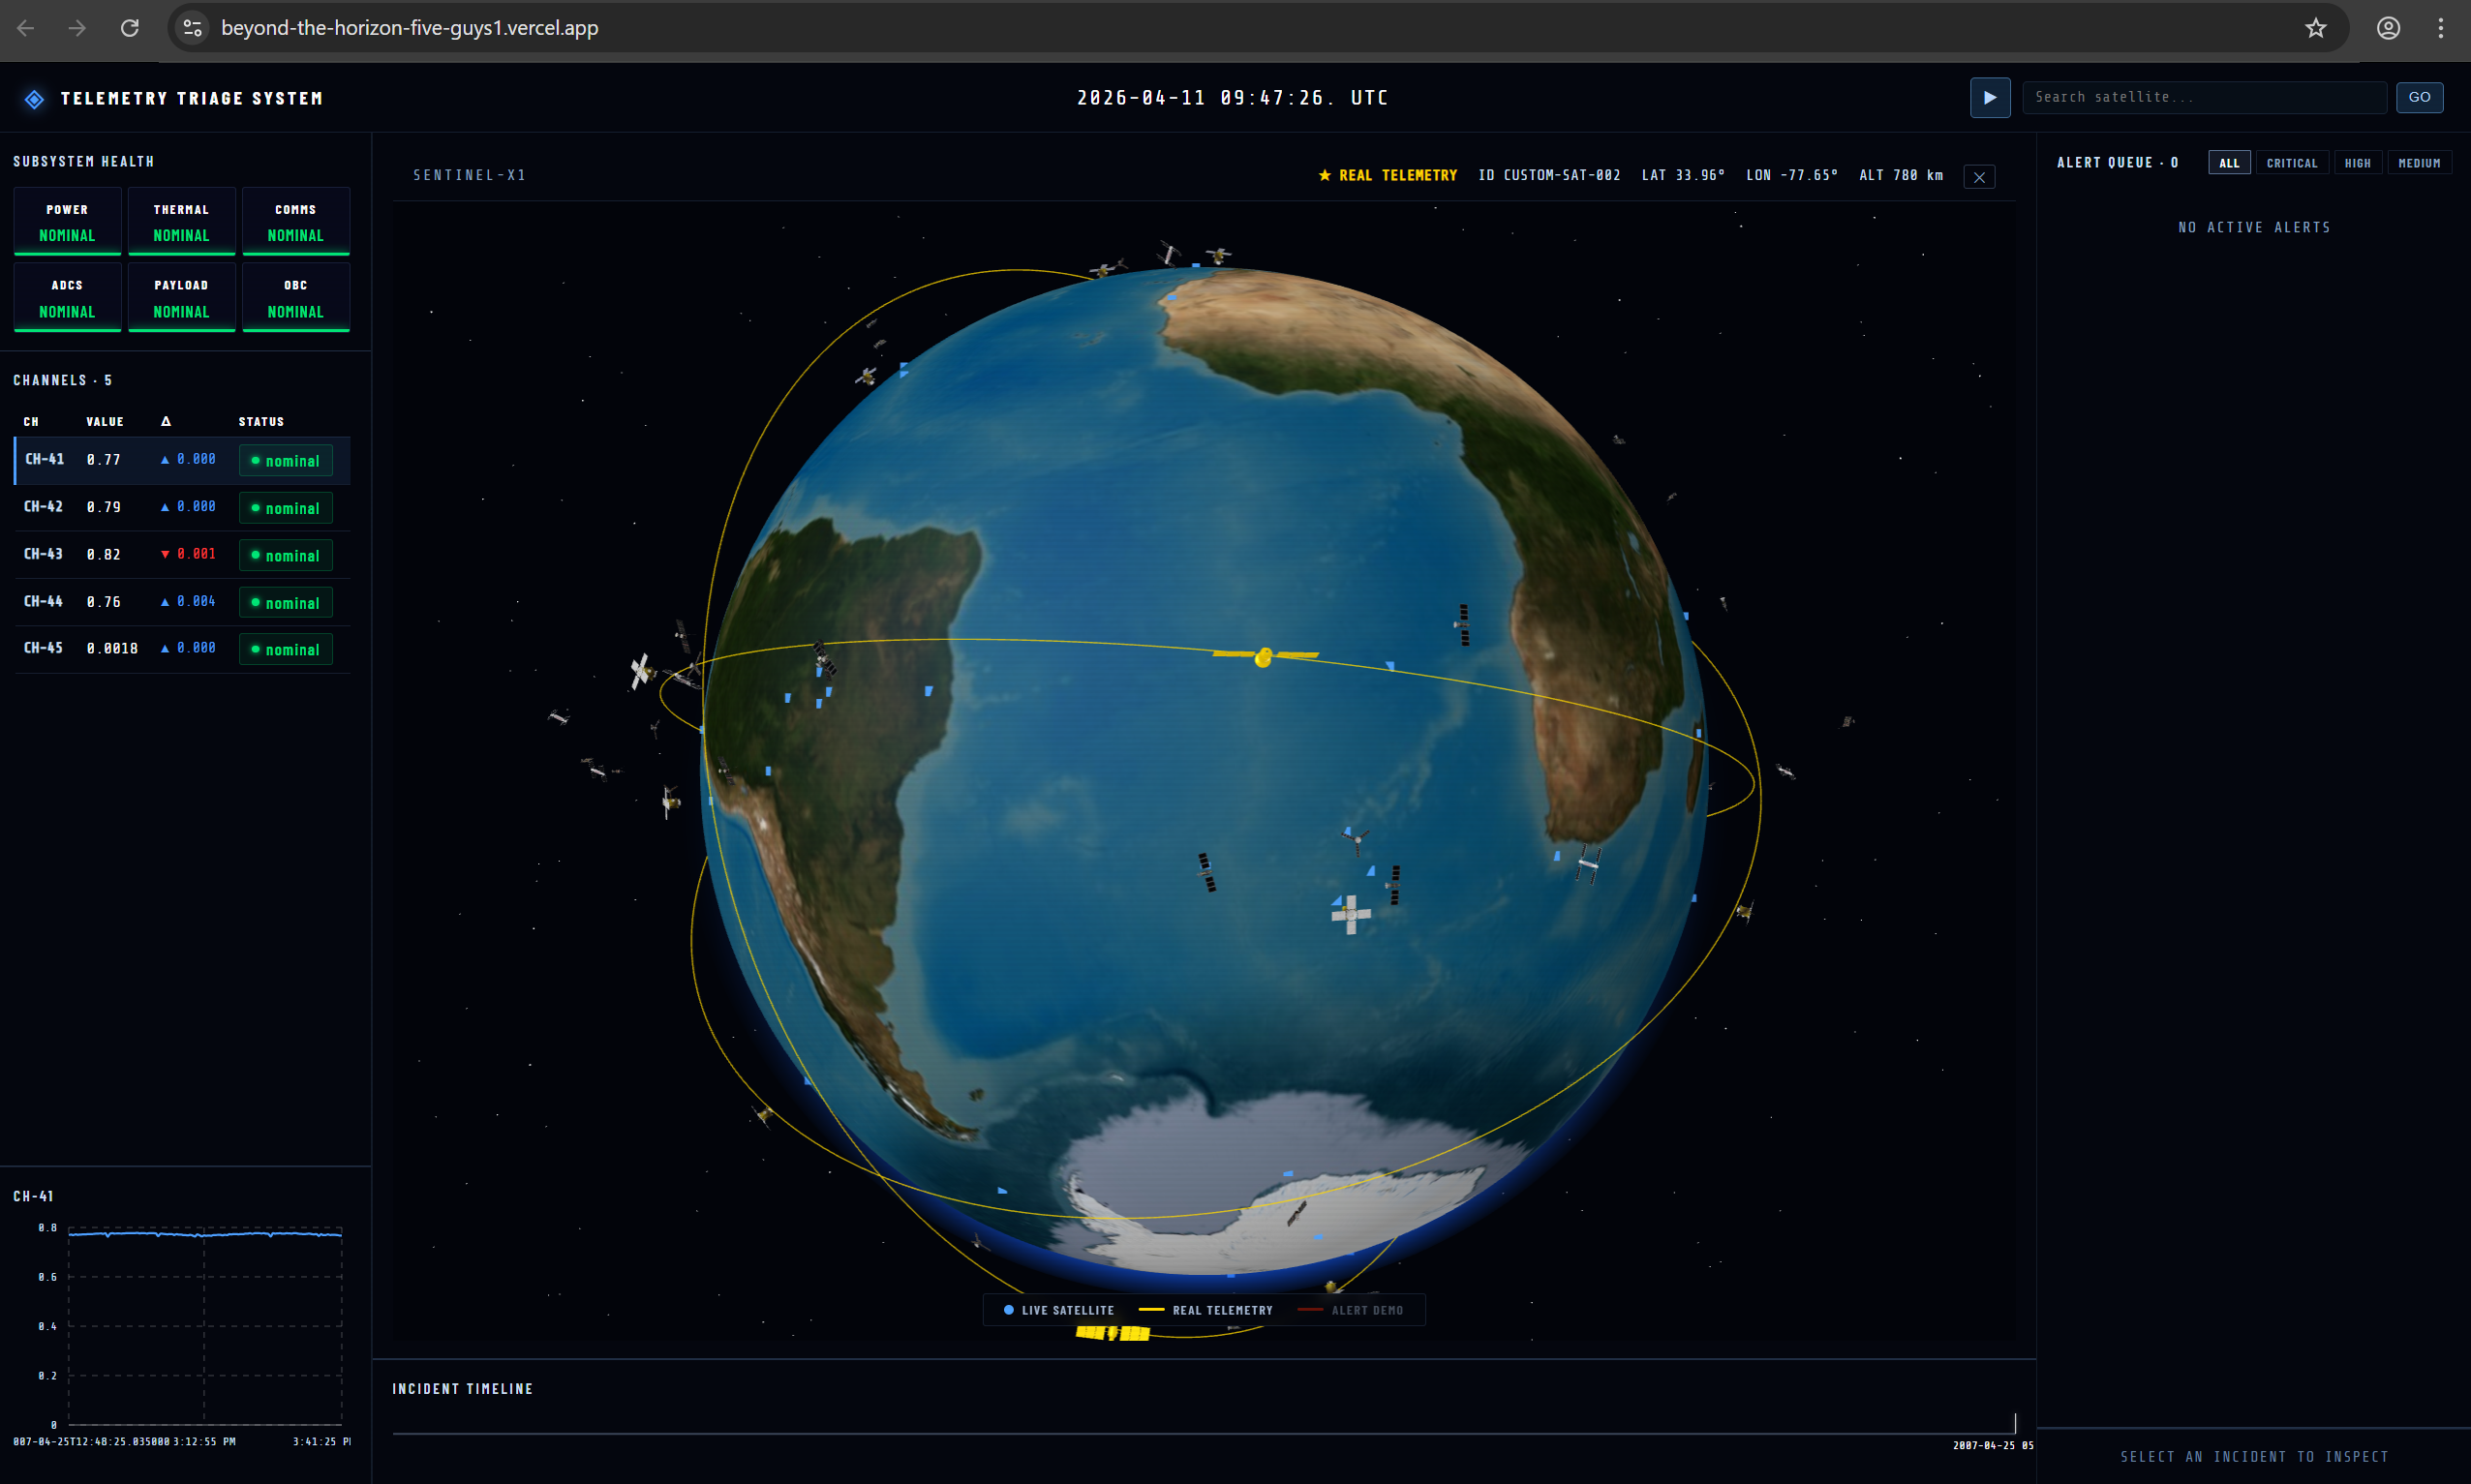
Live Telemetry
-
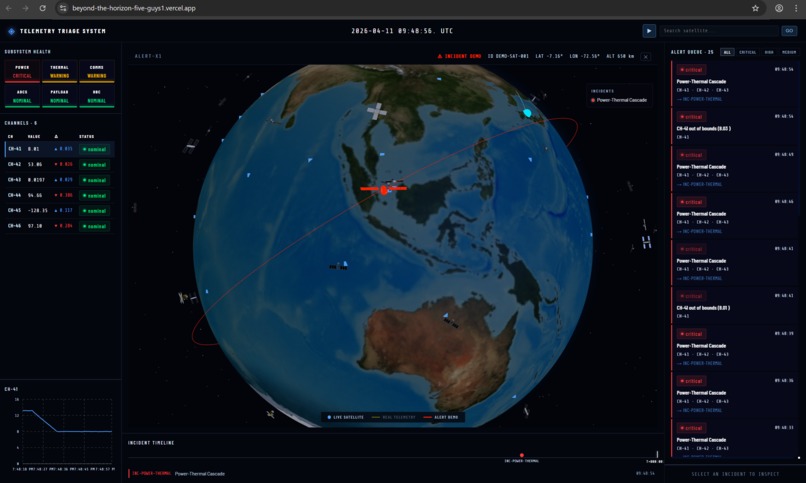
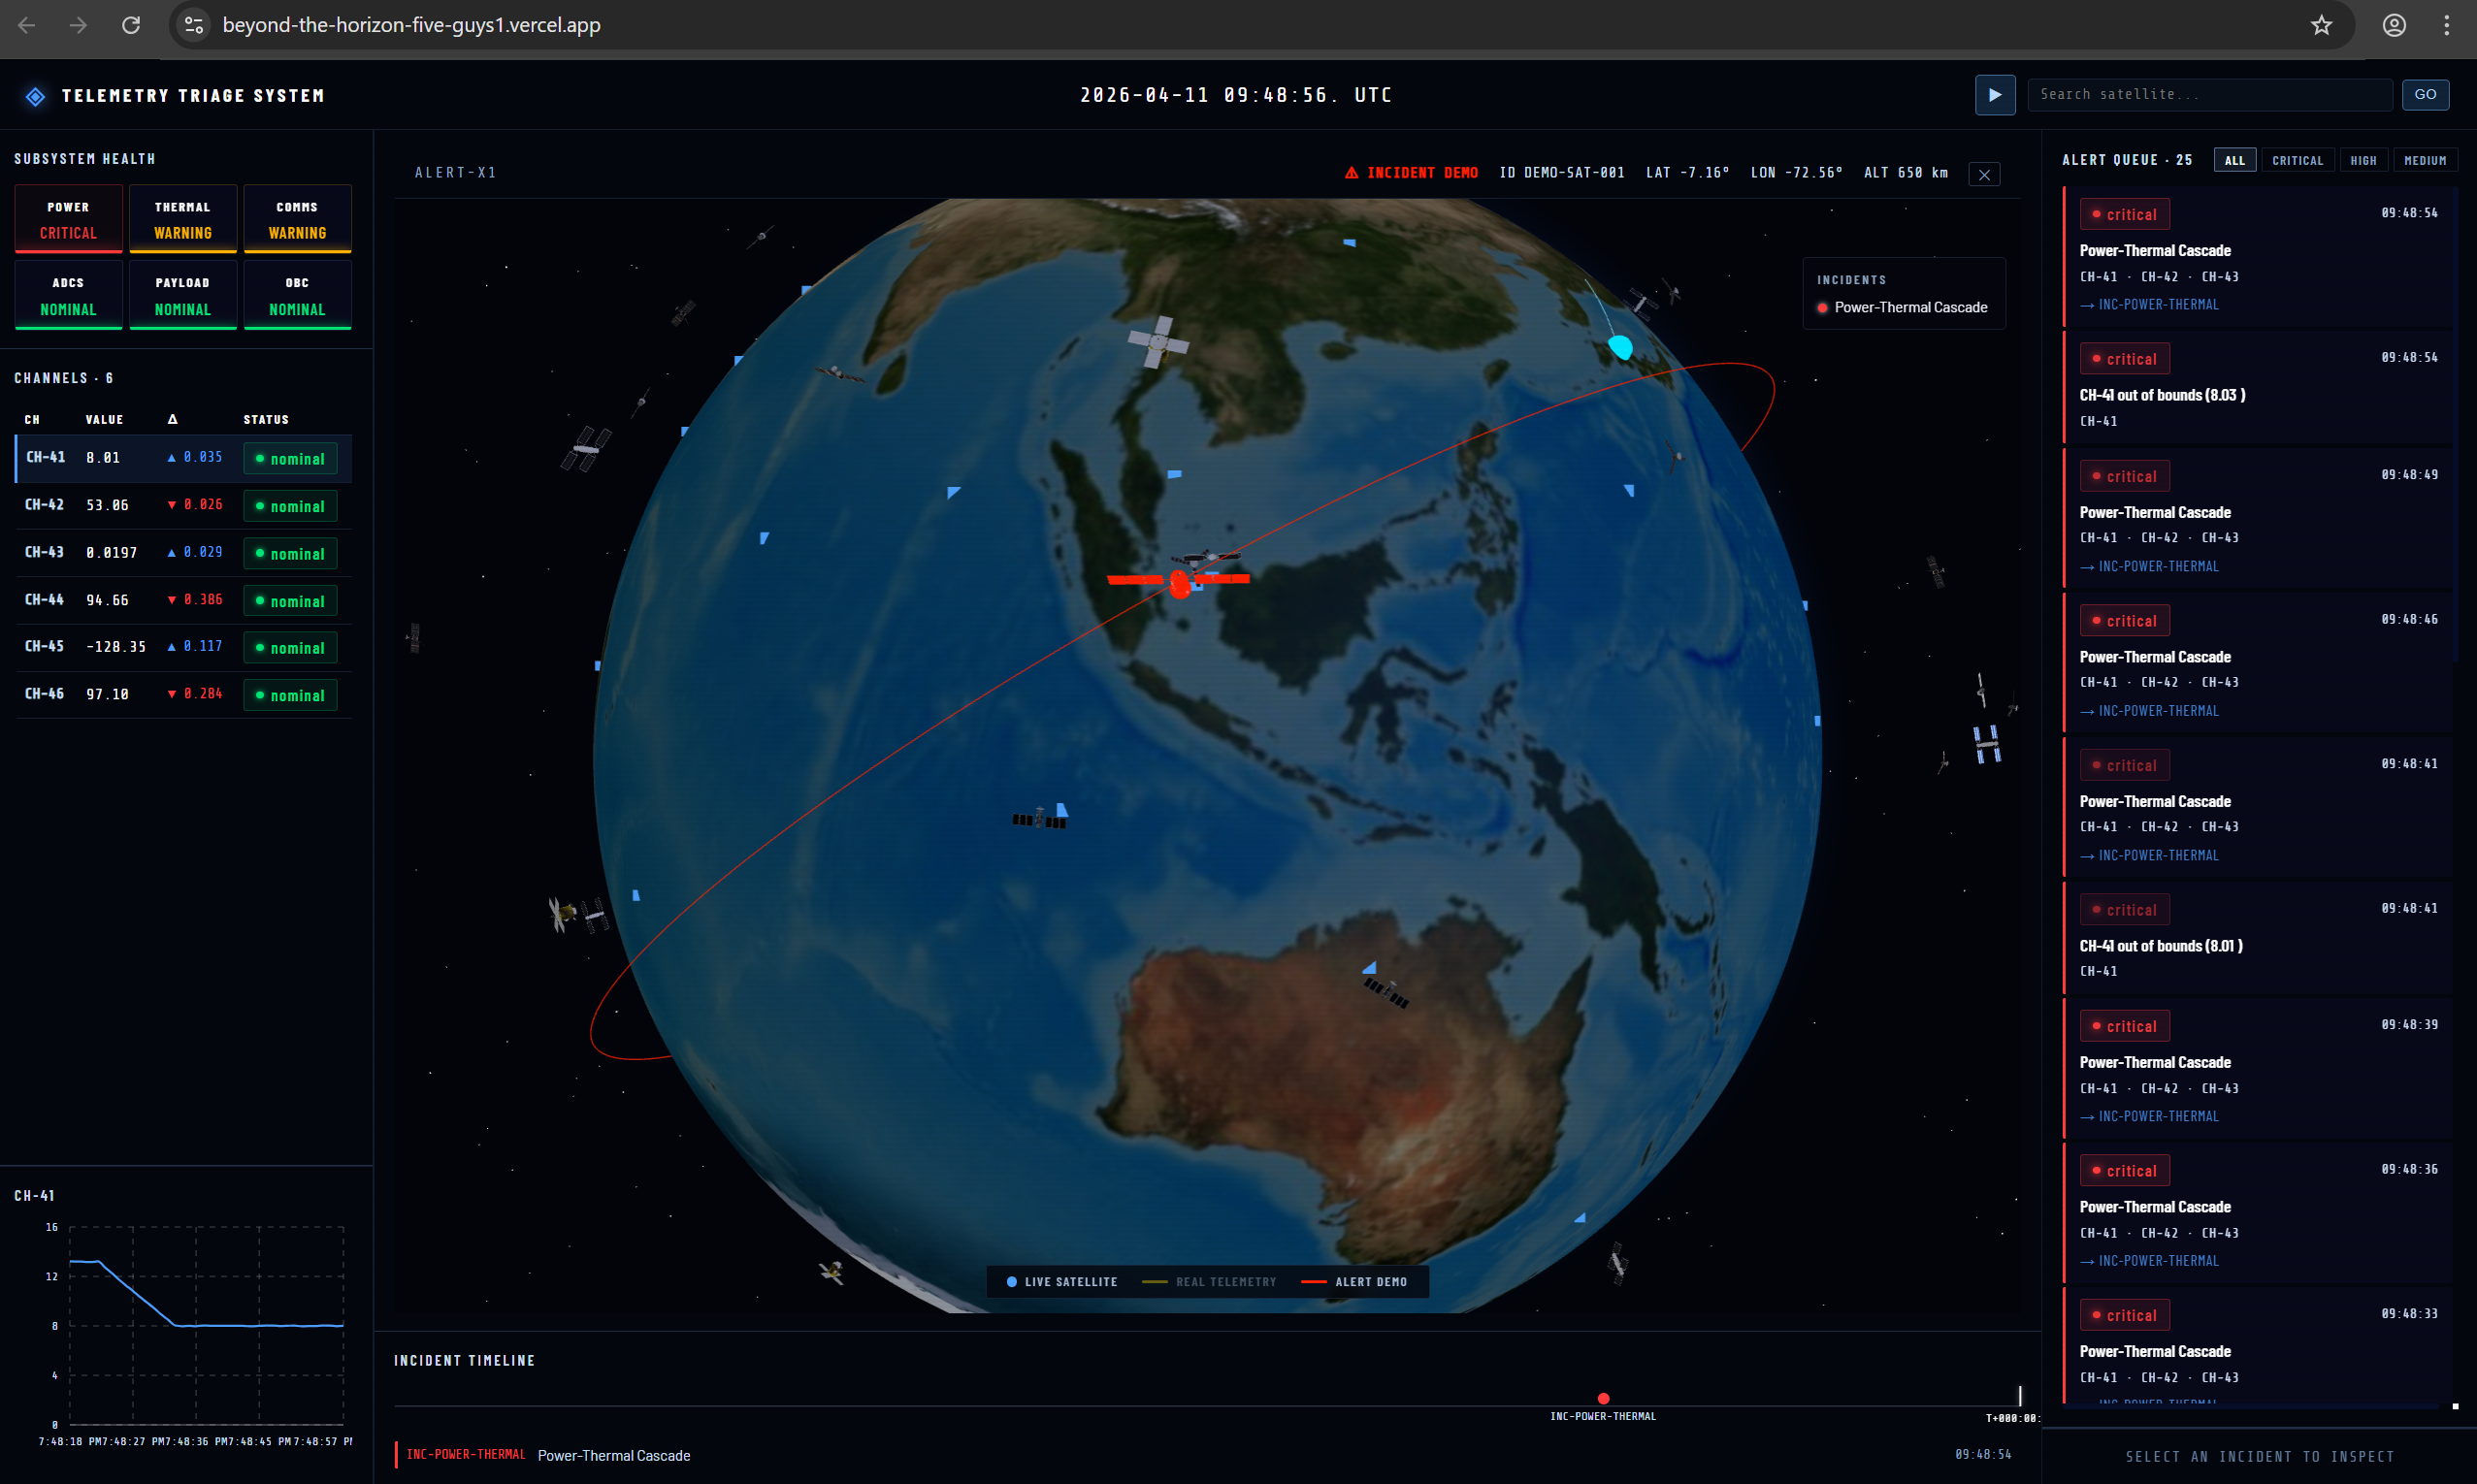
Alert Demo
-

Live Sattelite
-
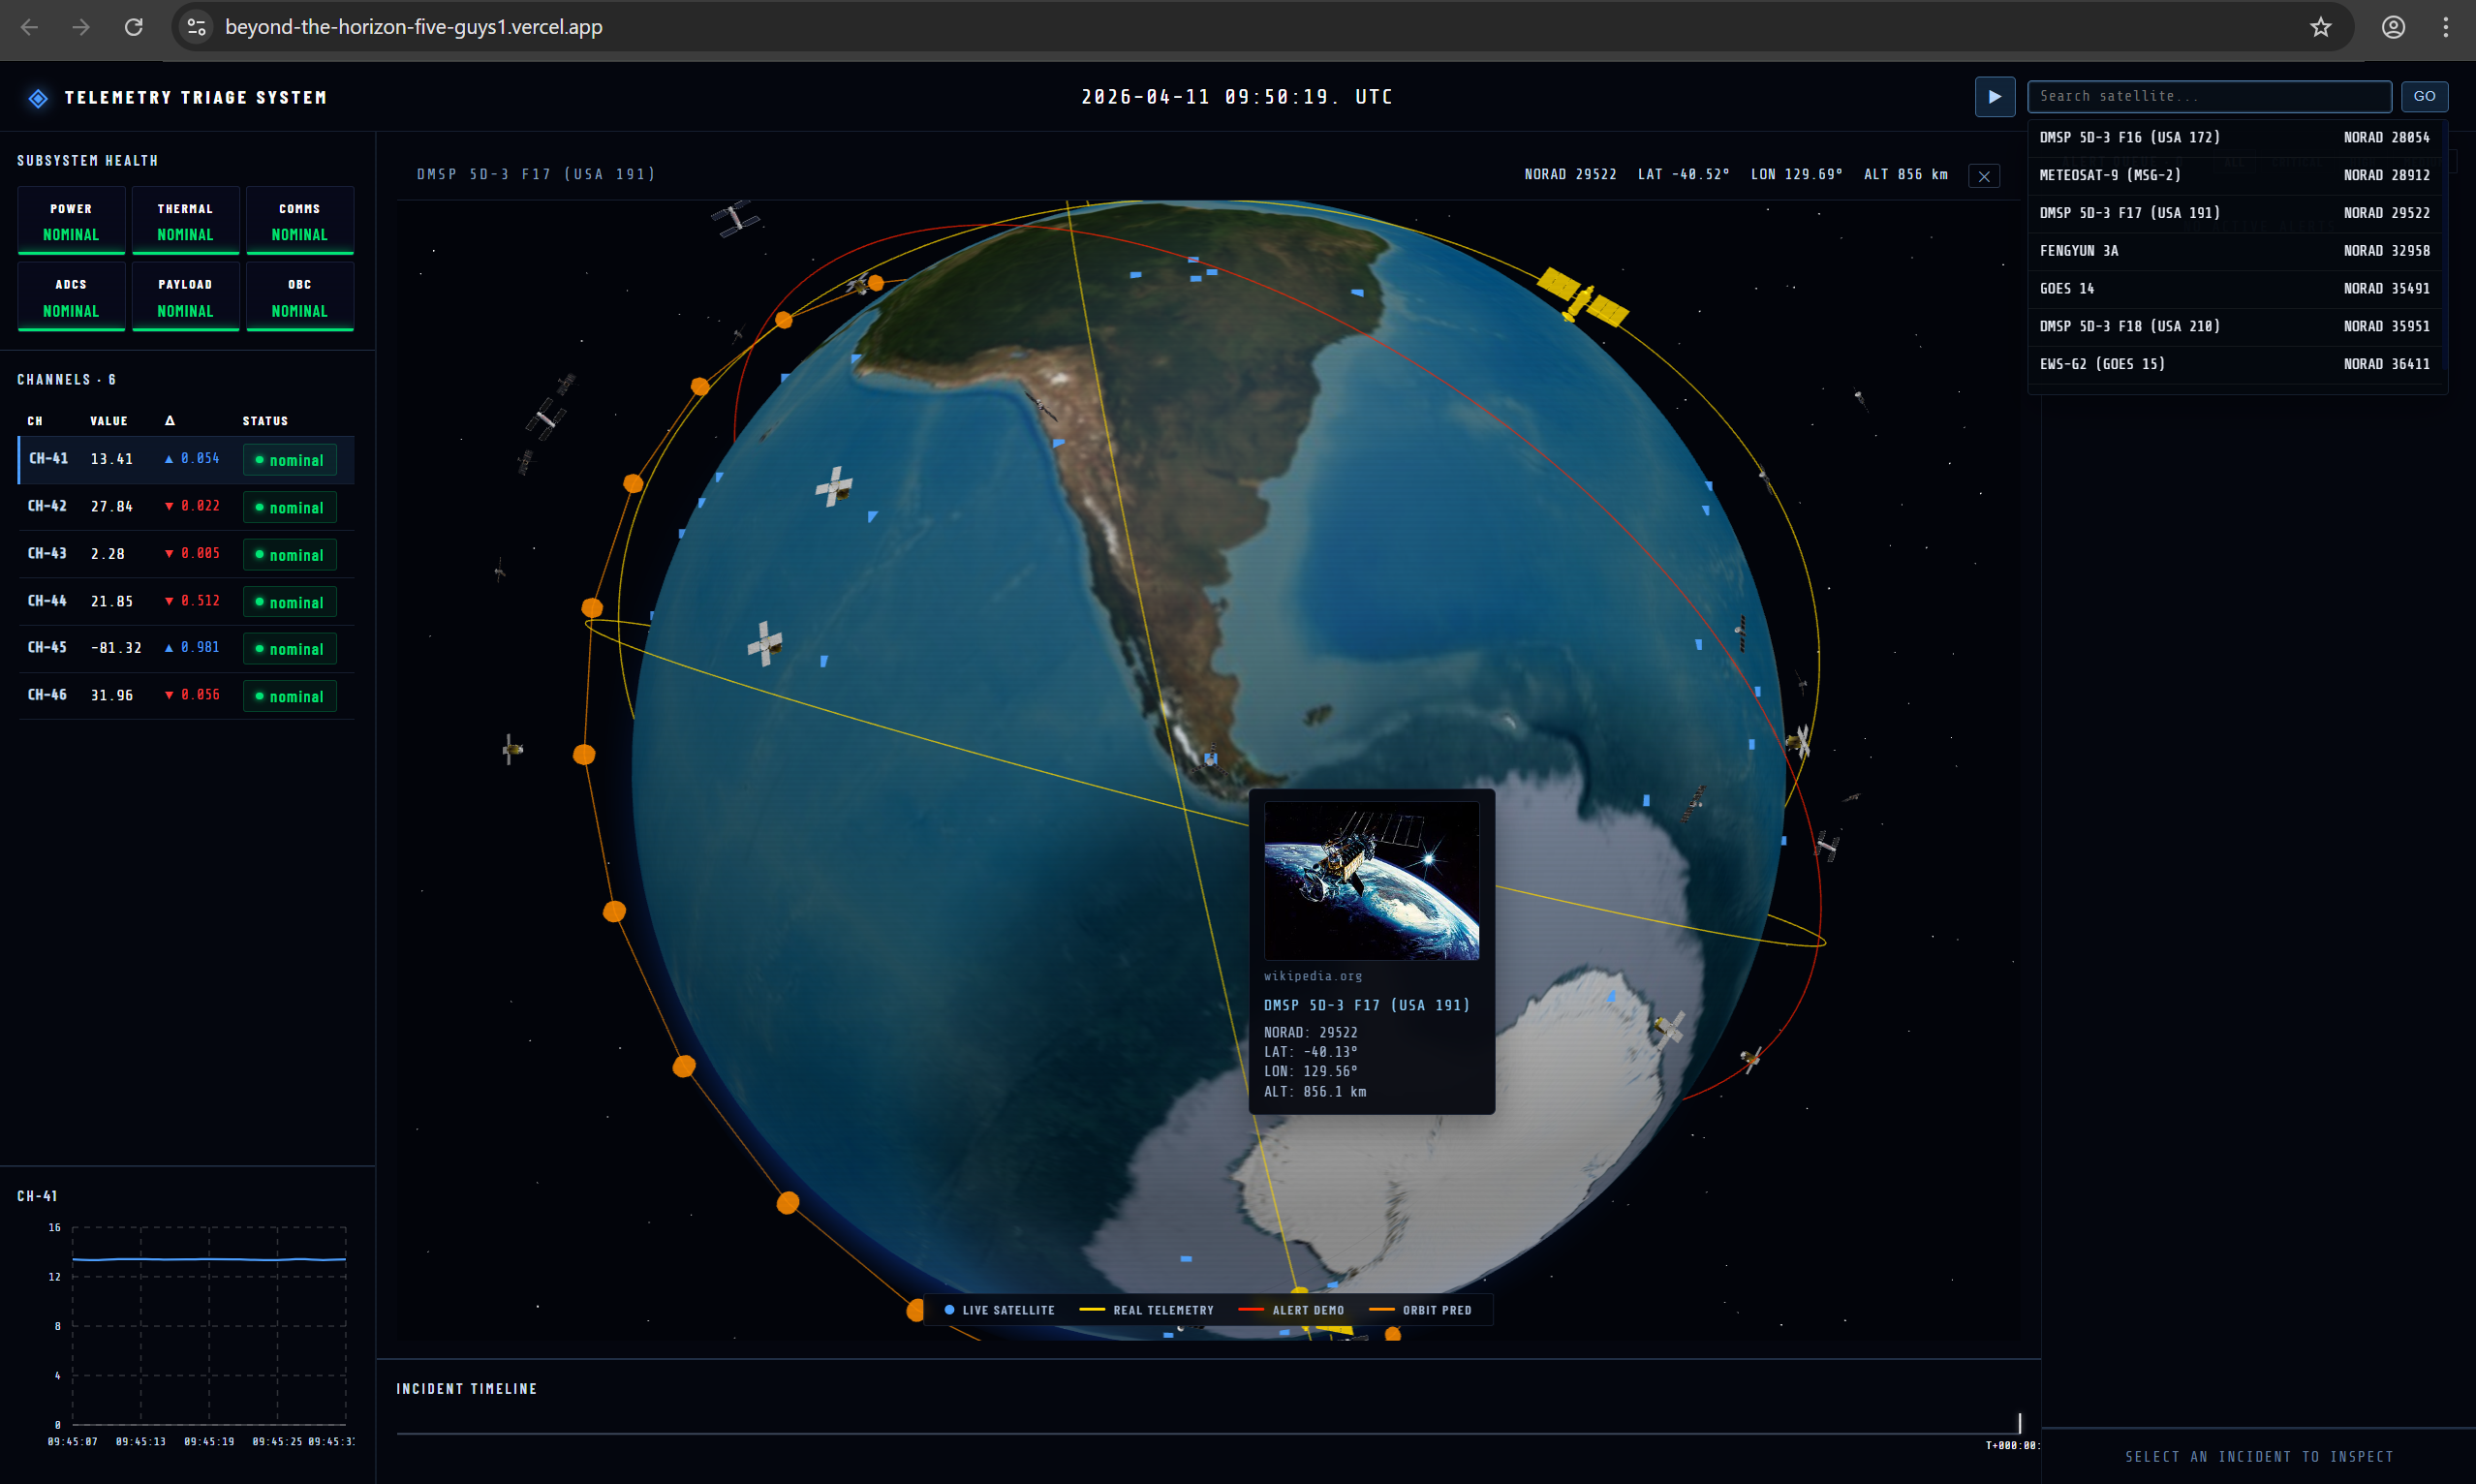
Satellite Searching
-

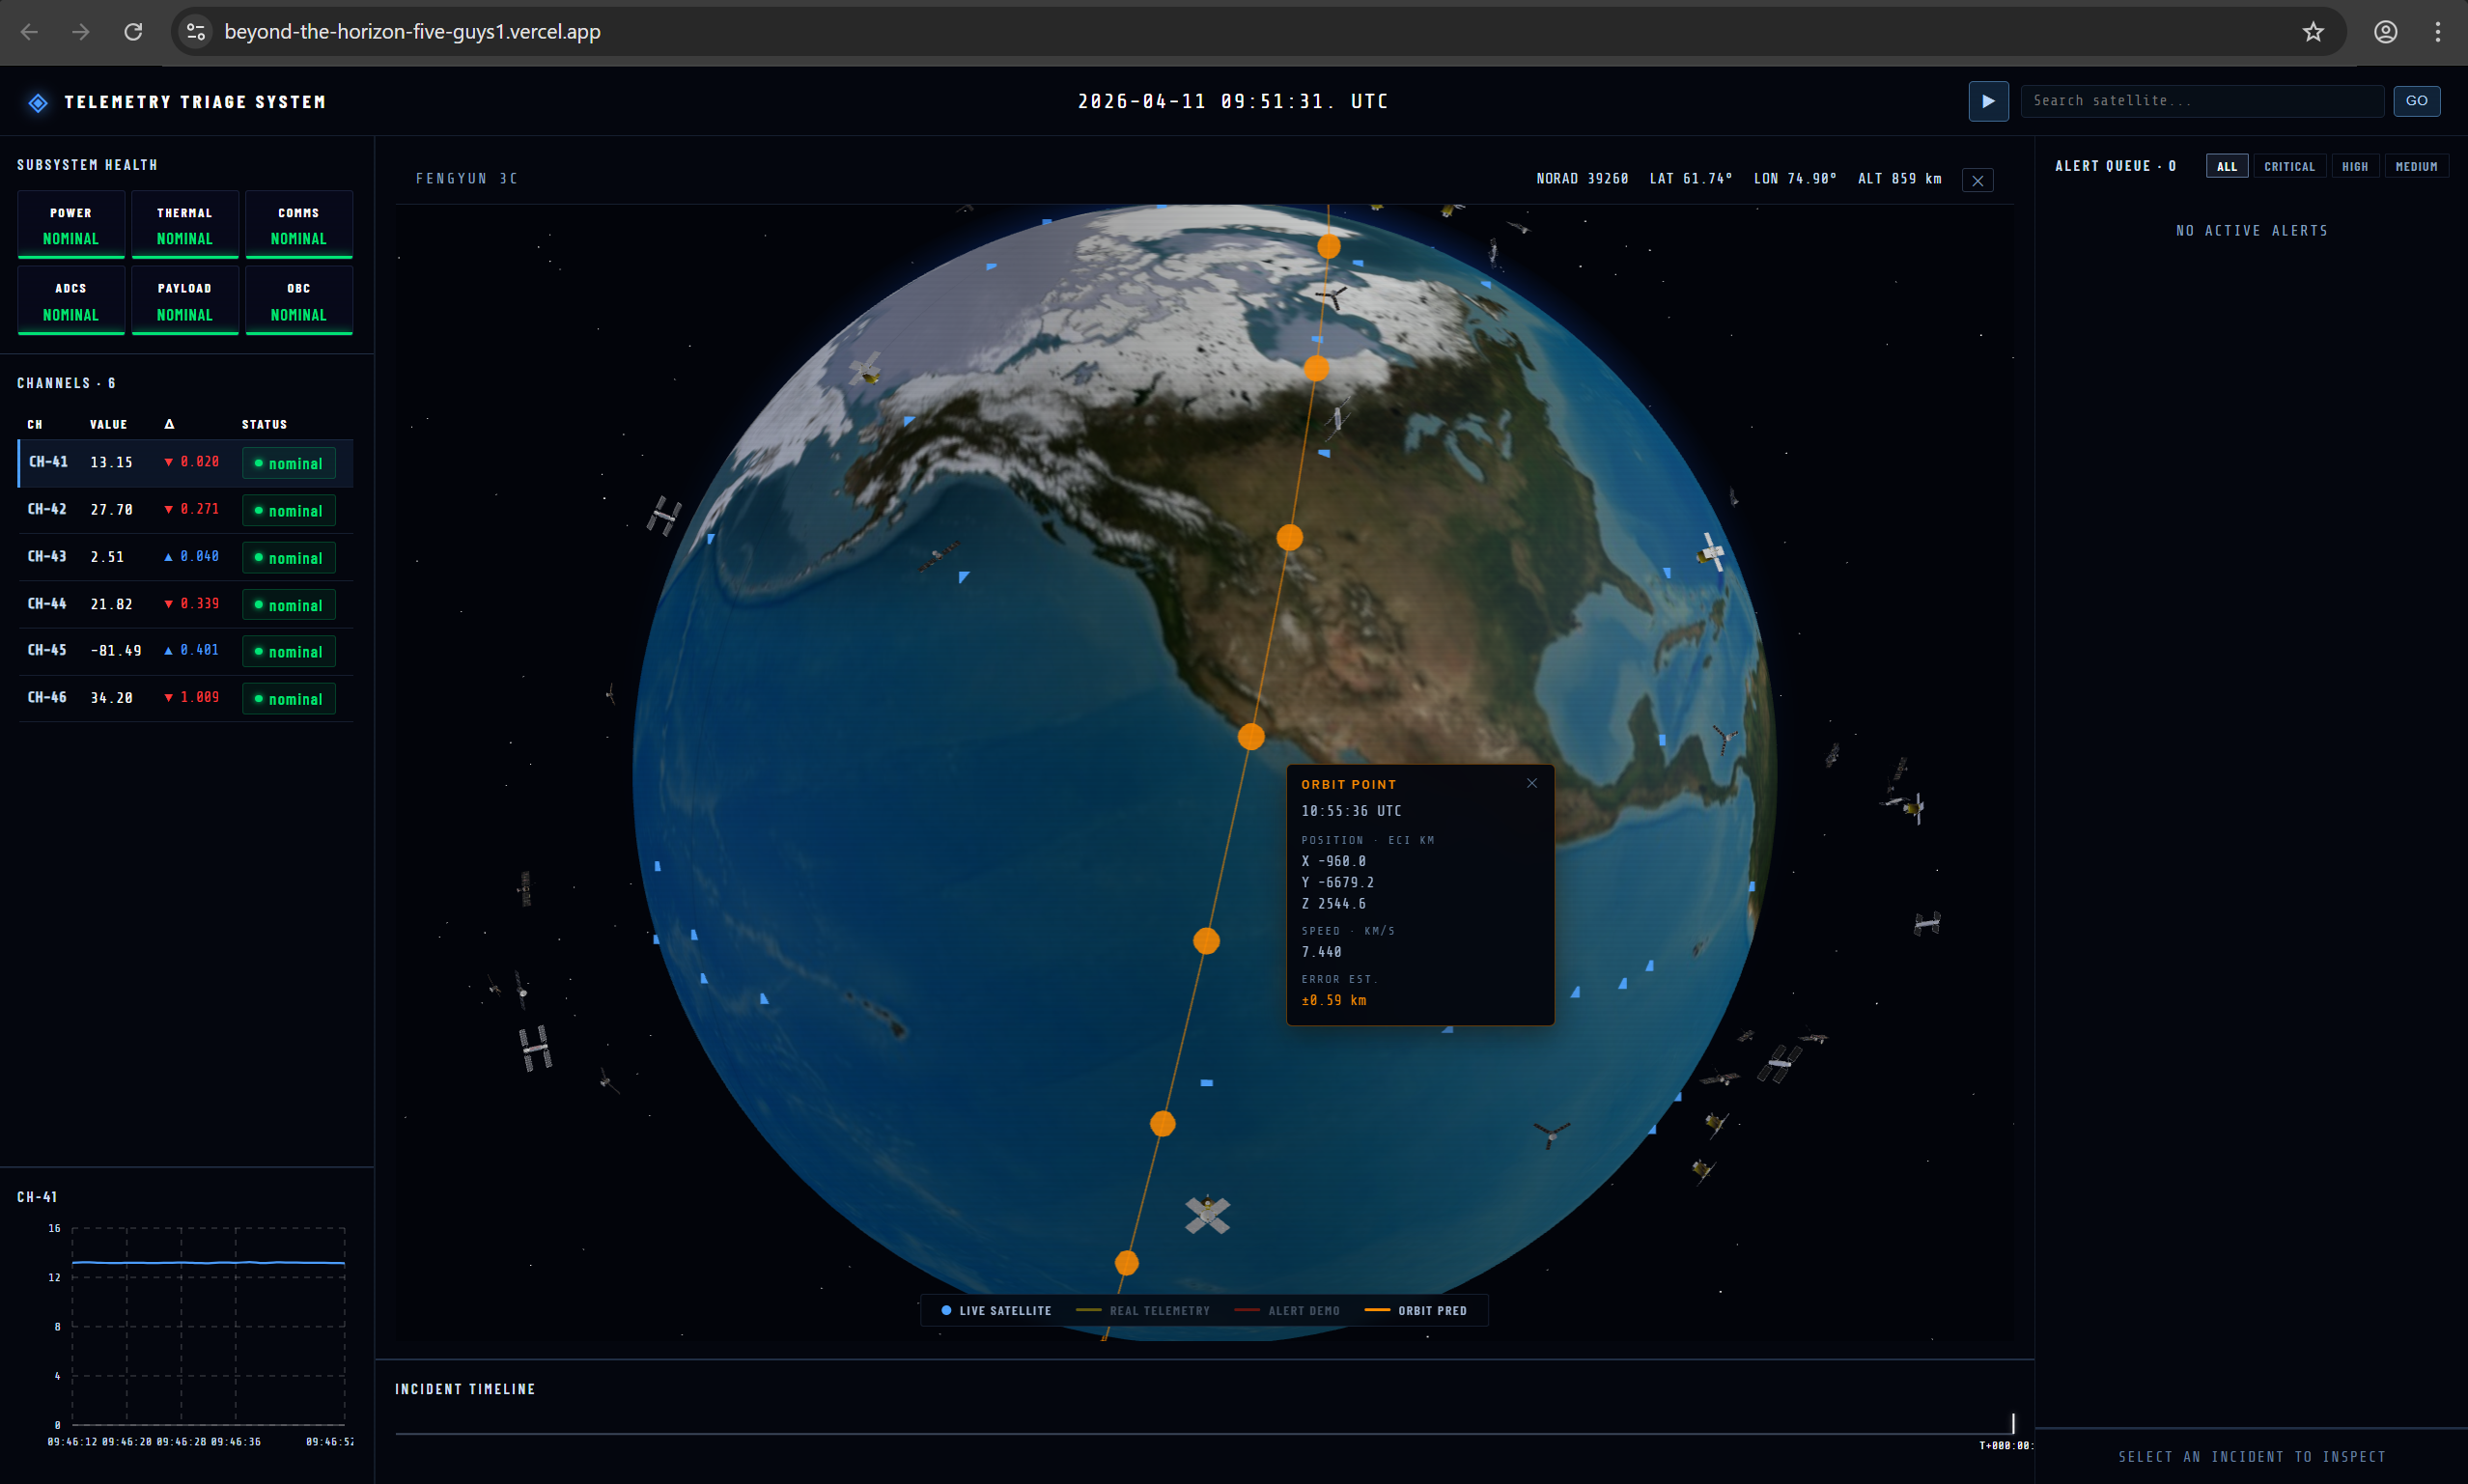
Orbit Tracking
-
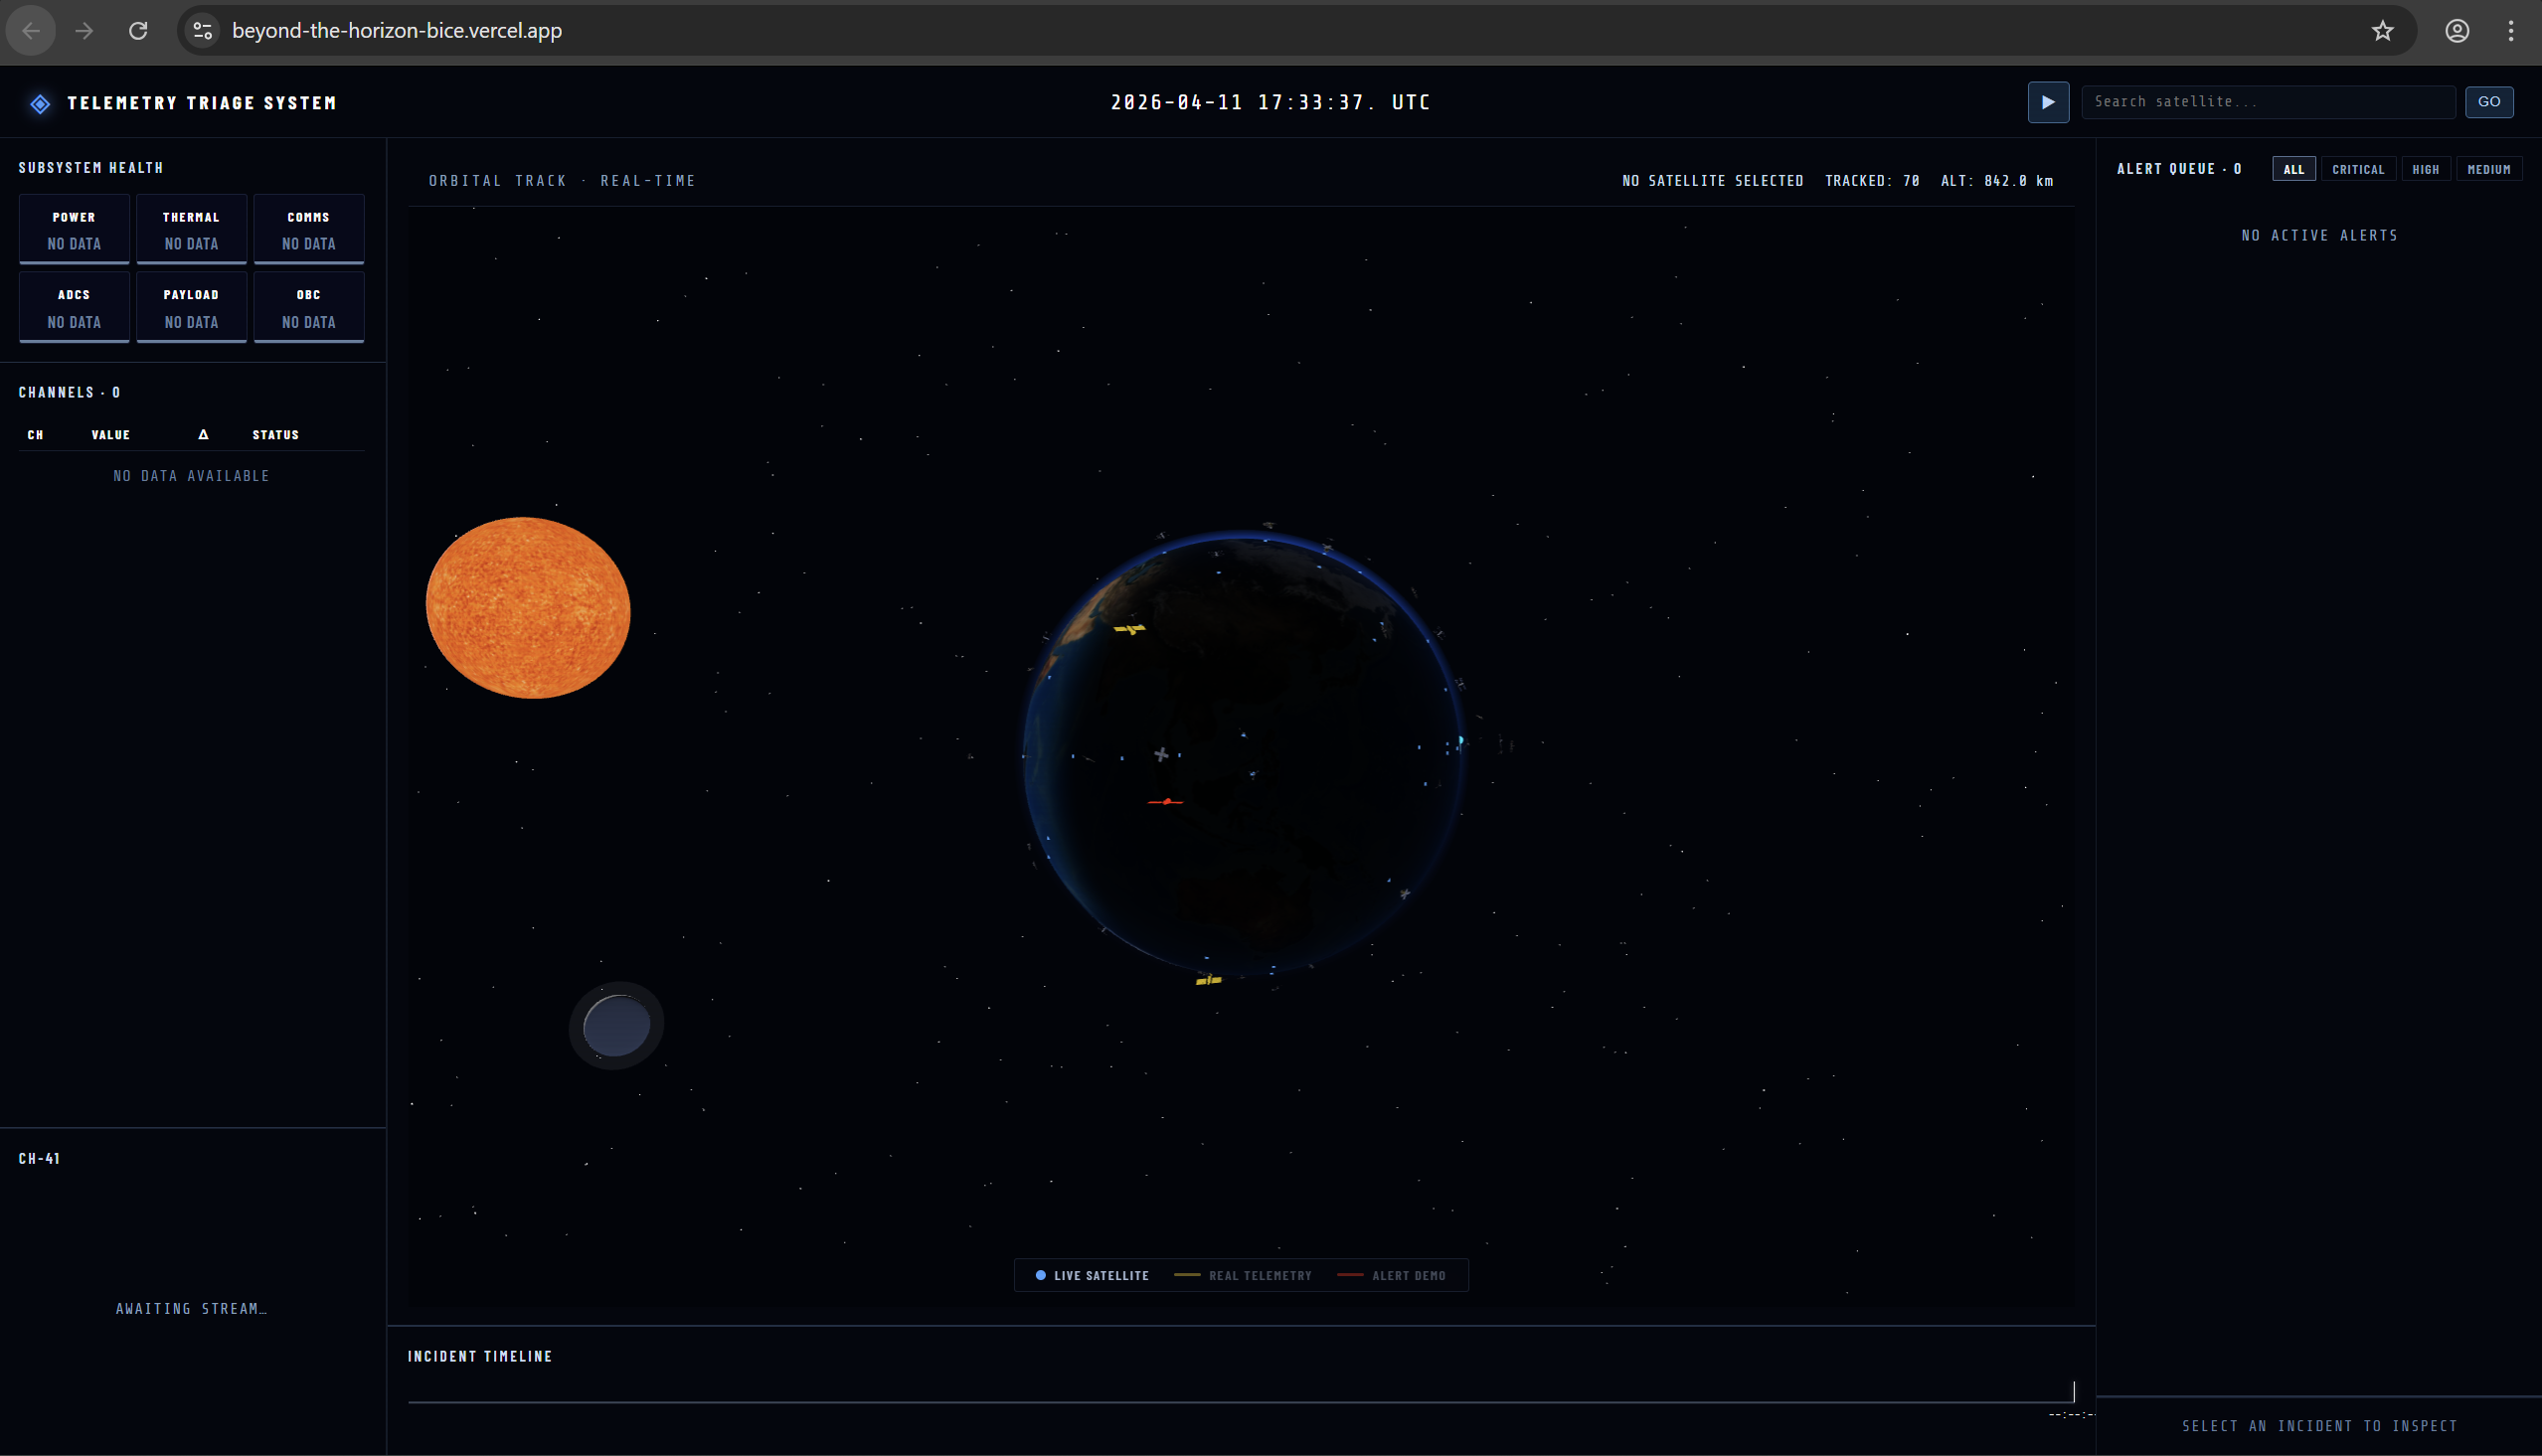
Sun and Moon
-
Light Ray Tracing

Inspiration
With the rapid growth of satellites in orbit, monitoring their health and behavior has become increasingly complex. Engineers are often required to analyze large volumes of telemetry data in real time, making it difficult to quickly identify anomalies or predict potential issues. We were inspired to build a system that simplifies this process, turning raw telemetry into intuitive visual insights, while also enabling predictive tracking of satellite orbit paths.
What it does
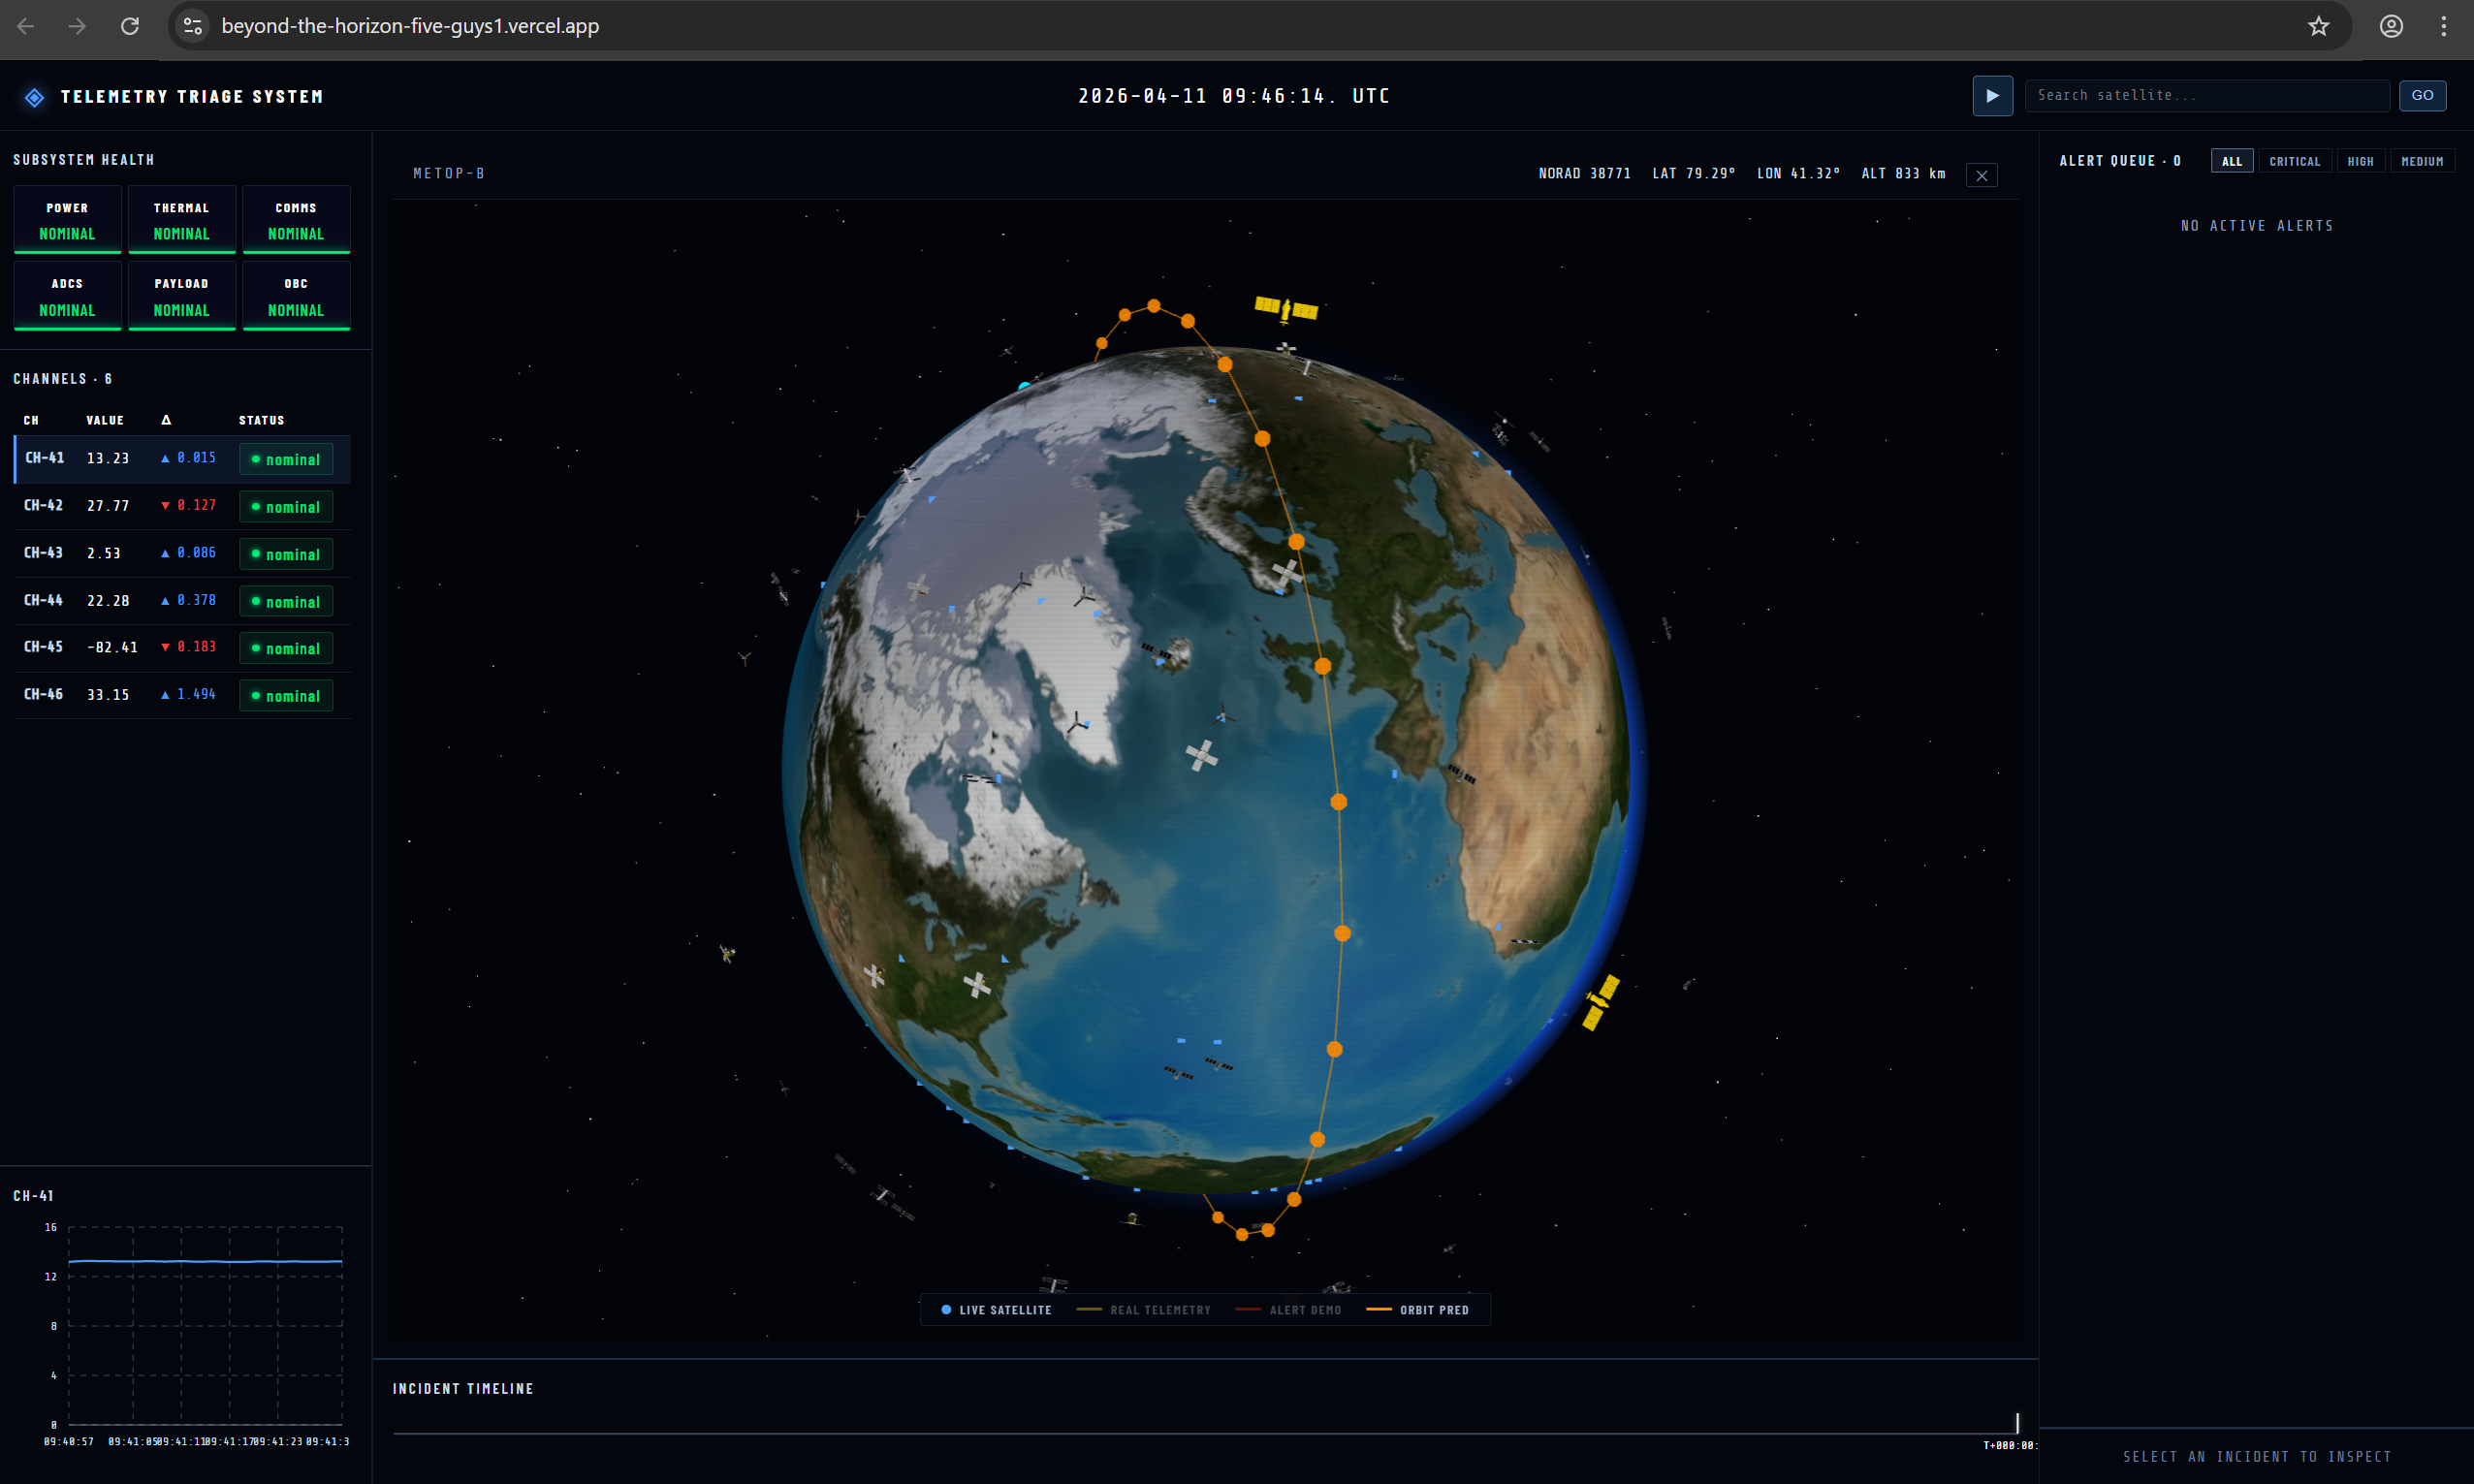
The Telemetry Triage System is an interactive dashboard for monitoring and analyzing satellite behavior in real time. It allows the users to:
- Visualize satellites orbiting Earth in an interactive 3D environment
- Click on individual satellites to inspect live telemetry channel data
- Detect anomalies when telemetry values deviate from expected ranges
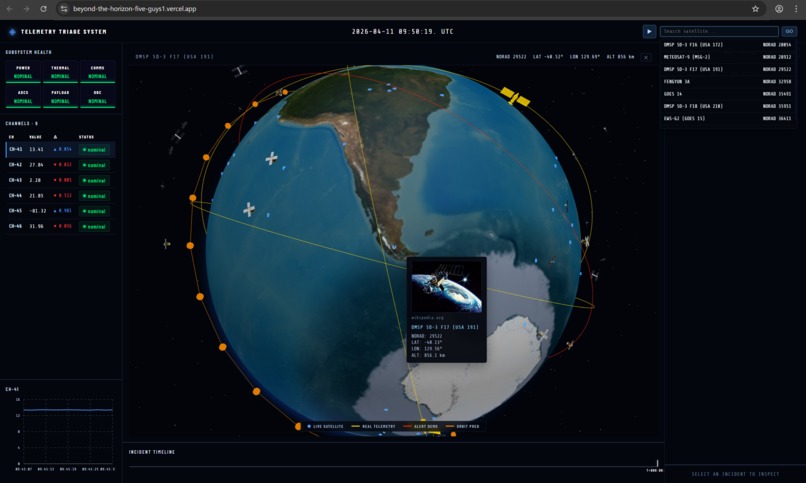
- Predict future orbital paths based on satellite parameters By combining visualization, anomaly detection, and orbit prediction, the system provides a comprehensive tool for satellite monitoring and decision-making.
How we built it
Our project comprised two major technical streams: an ML/statistical intelligence pipeline built on ESA satellite mission datasets, and an interactive web-based visual analytics dashboard for real-time monitoring and exploration.
On the data science side, we worked under realistic aerospace data constraints, where due to privacy and mission confidentiality policies, only unlabelled multichannel telemetry measurements from ESA missions were accessible, with no access to labelled anomalies or live satellite telemetry streams. Within this limitation, we designed the system around statistical reasoning and machine learning inference on high-dimensional telemetry channels, requiring careful treatment of incomplete ground truth, unsupervised signal interpretation, and anomaly-oriented analytical thinking.
For our dataset and data storage, we used the European Space Agency Anomaly Dataset, a large-scale real-world telemetry benchmark collected across multiple ESA missions. For local development, the dataset was stored directly within the repository for convenience and offline access. For deployment, however, the raw channel files were too large to bundle with the backend service, so we migrated the dataset to an AWS S3 bucket and configured the FastAPI server to load the required channel files on demand via S3 API calls at startup. This approach kept the backend image lightweight while still giving the server access to the full telemetry data it needed to run the anomaly detection pipeline.
On the backend side, we built a Python and FastAPI server to bridge the data science pipeline with the frontend. The API layer connected directly to the anomaly detection algorithms and preprocessing logic developed in Jupyter Notebooks, exposing structured REST endpoints that the dashboard consumed in real time. These endpoints served three core data streams: Live telemetry channel readings with per-channel health status, anomaly detection signals indicating whether the current observation window contained statistically significant deviations, and orbital prediction outputs including satellite position, velocity, and propagation error rate derived from the SGP4 model. This separation of concerns allowed the data science and frontend teams to work in parallel against a well-defined contract, and kept the heavier computation server-side rather than burdening the browser.
On the frontend and systems side, we engineered a high-performance satellite telemetry dashboard using React.js for modular dashboard architecture and reusable interface components, alongside Three.js for advanced 3D rendering and spatial visualisation. We implemented browser-side caching strategies for external API integrations, including Wikipedia satellite imagery and CelesTrak orbital position feeds, significantly improving responsiveness, reducing redundant requests, and lowering API overhead. At the same time, we remained conscious of production tradeoffs, recognising that in industry-grade real-time systems, aggressive caching of live telemetry would need to be constrained to preserve operational accuracy.
For the 3D visualisation layer, we applied vector mathematics, geospatial coordinate transformations, and dynamic rendering techniques to build an interactive Earth model capable of accurately mapping live satellite positions onto a 3D globe. This required translating orbital or positional data into visually correct globe coordinates, synchronising those with continuous rendering updates, and optimising client-side performance to maintain both visual fidelity and smooth interactivity. We also used SGP4 propagator to predict and visualise the satellites path, noting that with real-time data, we can actually compare the real path with the predicted one and categorise it as anomaly. The result was a system that balanced technical correctness, computational efficiency, and polished user experience. We also included 3D rendered models of the Sun and Moon, with their real-time astronomical positions fetched from the Astronomy API. Using these positions, we implemented a ray tracing and directional lighting approach to dynamically illuminate the Earth globe - the hemisphere facing the Sun is rendered bright, while the opposing face falls into darkness.
For deployment, the ESA telemetry dataset was hosted on AWS S3 bucket, allowing the backend to fetch large channel files at runtime without bloating the service image. The FastAPI backend was containerised with Docker and deployed on Railway, while the React frontend was deployed on Vercel. These deployments are automatic via GitHub, happening whenever there is a code change in the main branch.
Challenges we ran into
One of the biggest challenges was working with restricted telemetry data. While we had access to real channel values, the meaning of each channel was not available due to confidentiality constraints. This made it difficult to interpret what the system was actually predicting and forced us to rely on statistical patterns rather than domain-specific knowledge when designing our anomaly detection. Visualizing satellites and their predicted orbital paths also proved challenging. The large difference in scale between Earth and satellite trajectories made it difficult to render both accurately while keeping the interface clear and intuitive. We had to carefully balance realism with usability in our 3D visualization. Handling real-time updates added another layer of complexity. Continuously updating telemetry data and satellite positions required efficient data flow and rendering to ensure the dashboard remained responsive. From a system and integration perspective, we also faced several engineering challenges:
- Setting up a FastAPI backend and integrating it with a Jupyter Notebook pipeline for data processing
- Resolving CORS issues between the React frontend and backend services
- Configuring an AWS S3 bucket for data storage and connecting it to the backend
- Finding, importing, and rendering 3D satellite models (GLB) using Three.js
- Deploying the backend on Railway and the frontend on Vercel, while managing API communication and multiple environment variables across services These challenges required us to work across the full stack, from data engineering to frontend visualization and deployment, while ensuring all components functioned seamlessly together.
Accomplishments that we're proud of
- We built a complete end-to-end system that integrates telemetry processing, anomaly detection, and orbit prediction into a single dashboard.
- We created an interactive visualization of satellites and their orbital paths, making complex spatial data easier to explore and understand.
- We implemented real-time telemetry updates, allowing users to monitor channel data live and quickly identify anomalies.
- We successfully developed and deployed a full-stack application using React, FastAPI, AWS S3, Railway with Dockerfile, and Vercel, with stable communication between all components. Despite not knowing the exact meaning of the telemetry channels, we designed a working anomaly detection approach based on statistical patterns.
What we learned
Satellite systems and telemetry: How satellites operate, what telemetry data represents, and how spacecraft health is monitored through multichannel sensor readings in real mission environments
ESA dataset ingestion and ML pipelines: Sourcing and loading data from a trusted aerospace organisation, processing high-dimensional unlabelled telemetry, and building end-to-end anomaly detection pipelines using statistical and machine learning methods
Real-time orbital data and prediction: Fetching live satellite data from CelesTrak, parsing TLE formats, and implementing SGP4-based orbit propagation to predict and visualise future satellite trajectories. Telemetry anomaly detection, analysing time-series behaviour across telemetry channels to identify statistical deviations and reason about anomalies without labelled ground truth
3D Earth rendering with Three.js: Building an interactive globe with drag, spin, zoom, and hover interactions, and rendering live satellite positions using geospatial coordinate transformations
3D model integration: Sourcing open-source GLB satellite models and placing them accurately on the 3D canvas at precise latitude, longitude, and altitude coordinates
Caching and performance optimisation: Implementing request and data caching strategies on the frontend to reduce API overhead and improve dashboard responsiveness
FastAPI and React Vite development: Running a full local development stack with backend monitoring logs and frontend hot reload for efficient debugging and performance profiling
AWS S3 for dataset storage: Configuring S3 buckets and loading large telemetry files into the backend at runtime to keep the deployed service lightweight
Full-stack deployment: Deploying the backend on Railway using Docker images and frontend on Vercel, managing environment variables across services, and resolving CORS and cross-origin API communication issues in production
What's next for TELEMETRY TRIAGE SYSTEM
We plan to find and integrate fully labeled telemetry data, allowing us to better understand what each channel represents and improve the accuracy and interpretability of our anomaly detection. We also aim to conduct deeper research into telemetry systems, enabling us to move beyond purely statistical approaches and incorporate domain-specific insights into our models. We would like to expand the platform with historical data analysis and visualization, so users can track trends over time rather than only viewing real-time data. Ultimately, we want to extend the platform to support decision-making by providing actionable insights and recommendations based on predicted satellite behavior, rather than just visualizing the data.
Built With
- amazon-web-services
- astronomyapi
- celestrakapi
- docker
- esa-dataset
- fastapi
- jupyternotebook
- python
- railway
- react
- sgp4
- three.js
- vercel
- vite


Log in or sign up for Devpost to join the conversation.