-
-

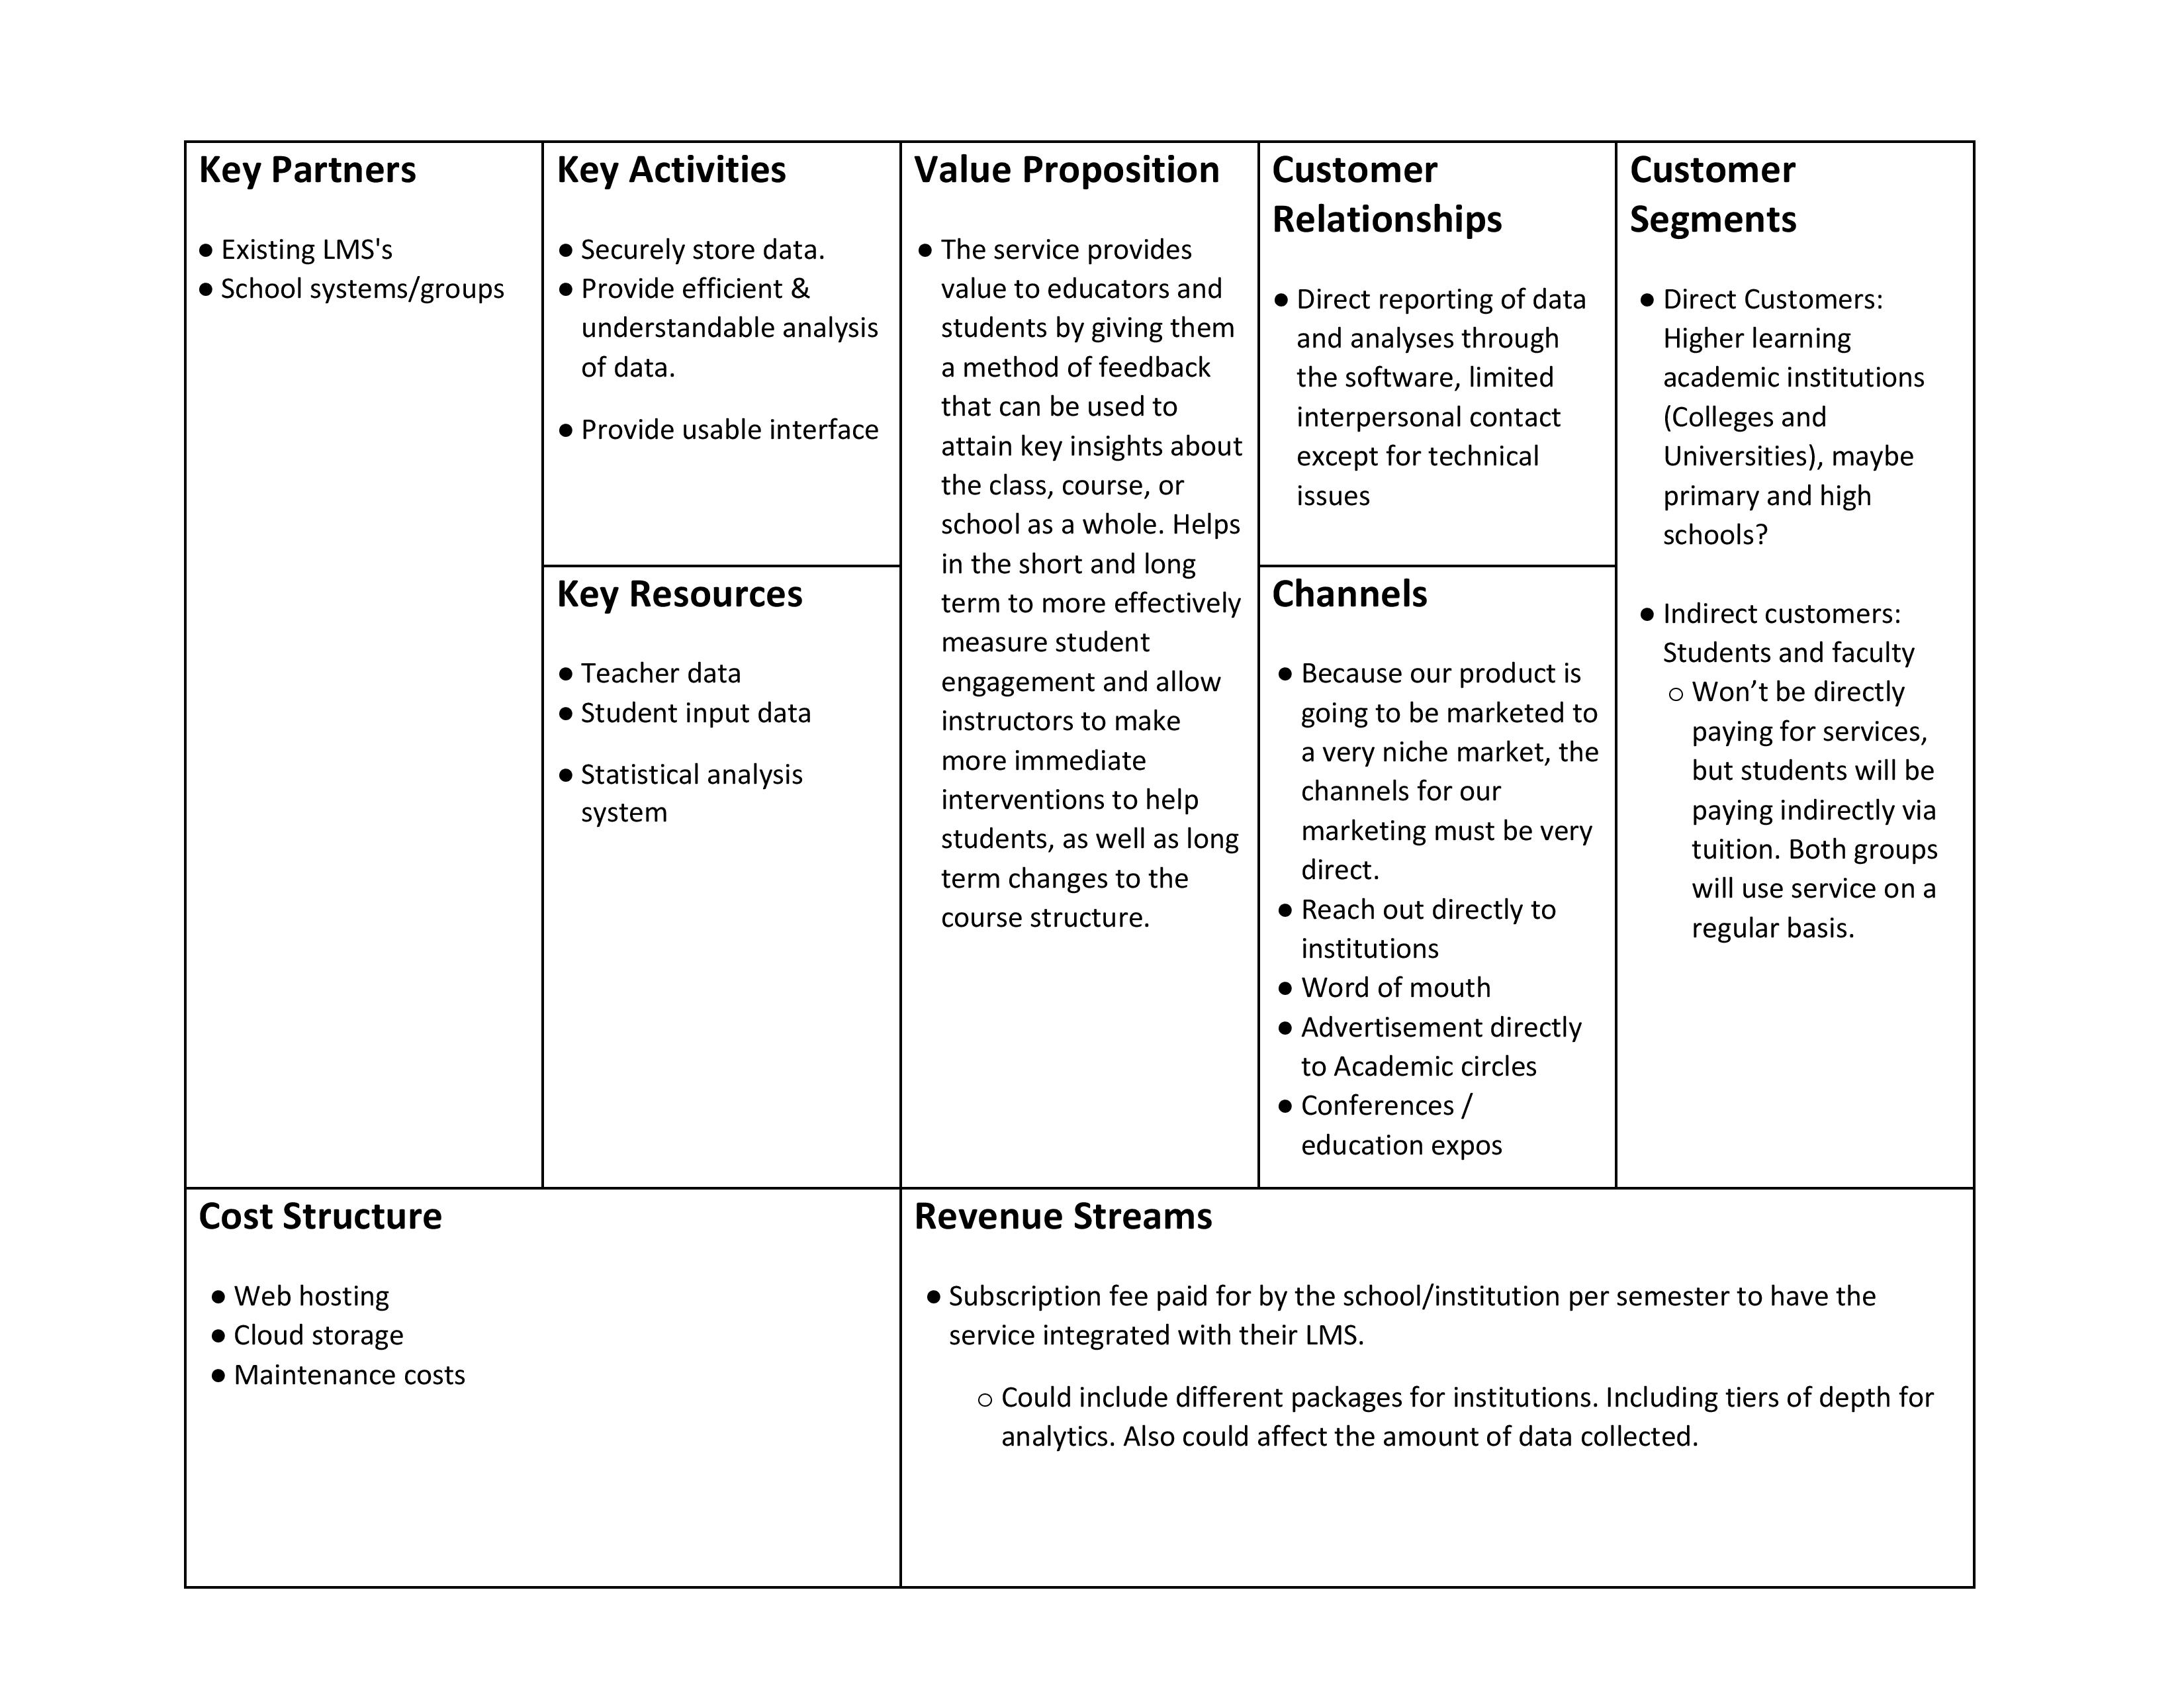
Business Model Canvas
-
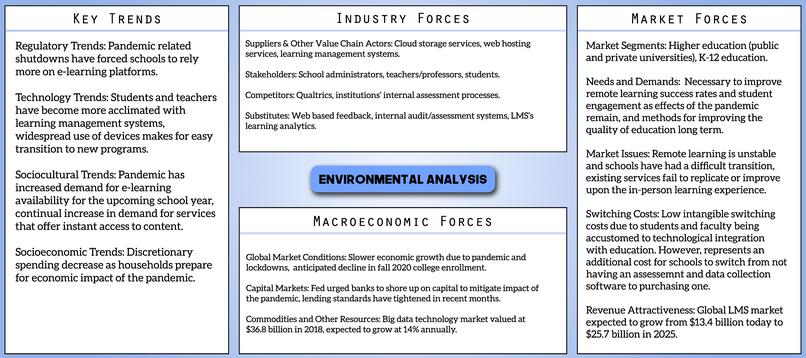
Environmental Analysis
-
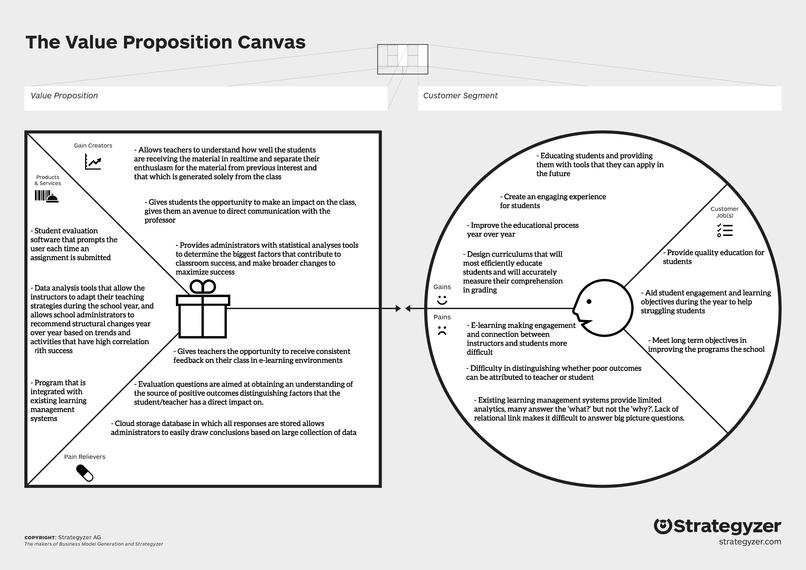
Value Proposition
-
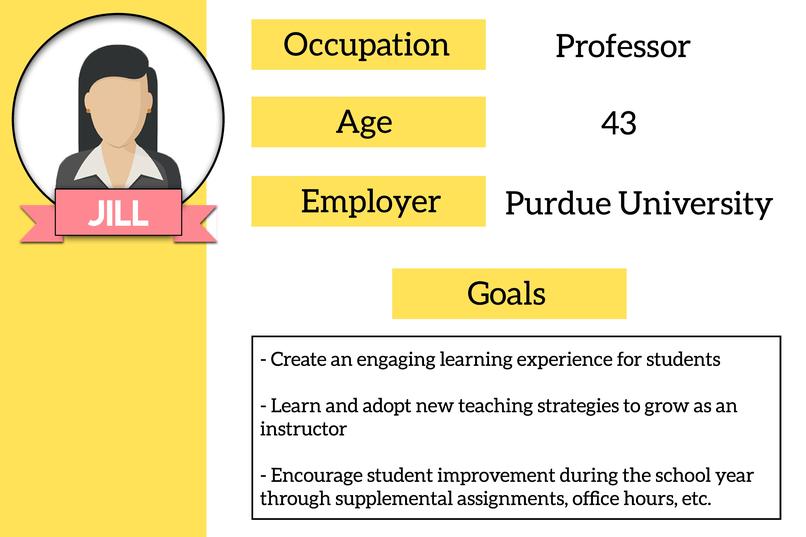
Customer Persona

Try It Yourself!
STEP Software Demo
Download Test Data for Demo
Project Overview
Due to the COVID-19 pandemic, millions of students and educators have been forced to complete their work from home. However, they continue to be held to the same high-standards they faced during in-person instruction. This creates a problem, as most students and educators have spent their entire lives learning and teaching face-to-face. To address this imperative issue, our team has decided to tackle the improvement of remote-style learning within higher education systems using a plug-in software program to analyze student & professor data.
Team Members
Pro Squad
The product team used their computer science and software knowledge to tackle the physical creation of our product.
- Erik Searle (Project Manager, Data Science @ Purdue University)
Erik helped to manage and guide the scope of the project as our team's project manager. He also worked to implement the data analysis and visualization code for our product. - Jimmy Sung (Computer Engineering @ Purdue University)
Jimmy worked on the integration of our Python data analysis with the StreamLit web-app framework. He also aided in setting up the StreamLit environment on AWS. - Ryan Wilks (Computer Engineering @ Saint Louis University)
Ryan helped to develop the user interface design for our project. He worked to make the product visually appealing and efficient for users to easily interact with.
Go Squad
The go-to-market team used their business and industry knowledge to effectively market and ensure our product's usability for customers.
- Garrett Harris (Biomedical Engineering @ Purdue University)
Garrett researched current issues higher-education students face in their e-learning environments to implement into our data analysis. He also identified our customer segment and how to best market our product to their needs. - Edward Hribal (Finance & Statistics @ Indiana University)
Edward performed initial research to guide our product solution and assisted in choosing what statistical methods our program should implement. He also helped complete our team's go-to-market items and our final product presentation. - Madison Lindfelt (Mechanical Engineering @ Rose-Hulman Institute of Technology)
Madison helped develop an effective business plan by researching gaps in the existing learning management systems. She also compiled a list of important data points to collect to best provide beneficial analyses for professors.
How did we choose our customer segment & problem?
One of the largest issues that e-learning has brought to light is the lack of communication between professors and their students. This divide has negative impacts on the effectiveness of student learning as well as professors' teaching. Professors are unable to gauge how well the material is being understood, while students are unable to easily engage and ask questions.
To tackle this problem, we decided to target university-level students & professors to improve their e-learning education experience. We recognized that the existing learning management systems were not providing what was necessary for the current state of the education system. Understanding this, we compiled the following list of existing issues so we could incorporate solutions to them in our product's design.
- numerous platforms used across professors
- no future steps for improvement
- lack of student-professor communication
How did we build our final solution?
Using these target issues existing in the current e-learning environment, we wanted to create a product that addresses all 3 of them effectively and efficiently.
To first approach the problem involving the multitude of platforms used by professors, we agreed that some type of plug-in or add-on software program would be beneficial. This would allow for all school systems to utilize our product across their different learning management systems.
Next, by understanding the current market's gaps, we knew that our product should not only store student & professor data, but also analyze it. To set itself apart from existing products, our design implements statistical analysis methods on the data, providing users with future steps towards improvement.
Finally, we recognized that no matter how accurate of information our product provides, it will prove no help to current students if professors only receive feedback at the end of a semester. To approach this, we decided to implement student input questions that can be attached at time of submission for different assignments. With a few simple questions, students can provide feedback to demonstrate to professors what is and isn't working within their classes.
Technical Architecture
Key Tools, Libraries & Frameworks
- Streamlit
We chose Streamlit because it is a free, open-source framework, which allowed us to quickly dive-in and begin focusing on the problem that our team wanted to tackle. We were able to effectively generate our web application without having to learn new web development methods in their entirety. - Amazon Web Services
We chose to use AWS as it offered a free tier of hosting, which we used to deploy a publicly accessible demo of our solution. - Pandas
We utilized Pandas for our data manipulation due to its ubiquitous nature in nearly any data science focused script. It assisted in tasks such as grouping variables, averaging columns, and sub-setting data frames. - Matplotlib
We used Matplotlib to generate the plots that graphically display the user's inputted data on the Streamlit web app. - NumPy
NumPy was chosen as it is the most popular and well supported mathematical library for Python. This was used for the generation of our test data. - Python
We chose Python as our primary language due to its wide support for data science focused processes and workflows as well as the thousands of data science libraries it provided us with. We used Python for the entire development and deployment of the product.
If we had another 5 weeks, what would our future steps be?
- Implement Additional Data Analysis
In our product demo, we have strong data analysis that allows us to answer multiple correlation questions. These can be used by professors to improve e-learning for their higher education students. However, if given more time, we would aim to implement a few more technically-advanced statistical analysis methods. We would implement the ANOVA system, which would help identify any additional correlations between different sections in our data. - Machine Learning
Along with implementing improved statistical methods, we would want to include some type of machine learning into our program. This would decrease the need for manual maintenance to our software and allow for continuous improvement which would be beneficial to our users. - Robust Framework
Our software's framework is currently in a novel state, as we focused most of our efforts on implementing simple statistics and an efficient user interface. In future upgrades, we would look to improve the framework and possibly create an app for our program. This would allow students to more easily provide input and feedback on their e-learning experiences in addition to the web-based program. - Expand into K-12 School Systems
Our current marketing targets higher-education schools corporations. However, in the future we could expand this to also target K-12 systems by modifying our program to best fit their needs. Additionally, STEP has the potential to become a product that is used in all learning environments, not only in e-learning settings.
Additional Items
GitHub Repo
Business Model Canvas
Environmental Analysis
Value Proposition
Customer Persona
Presentation Slide Deck


Log in or sign up for Devpost to join the conversation.