-
-
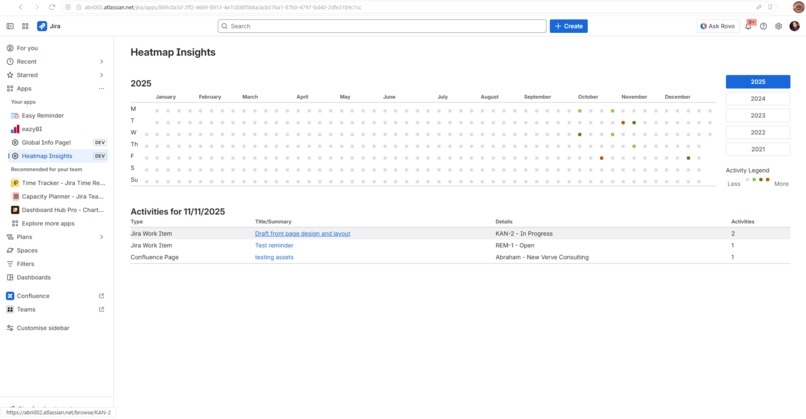
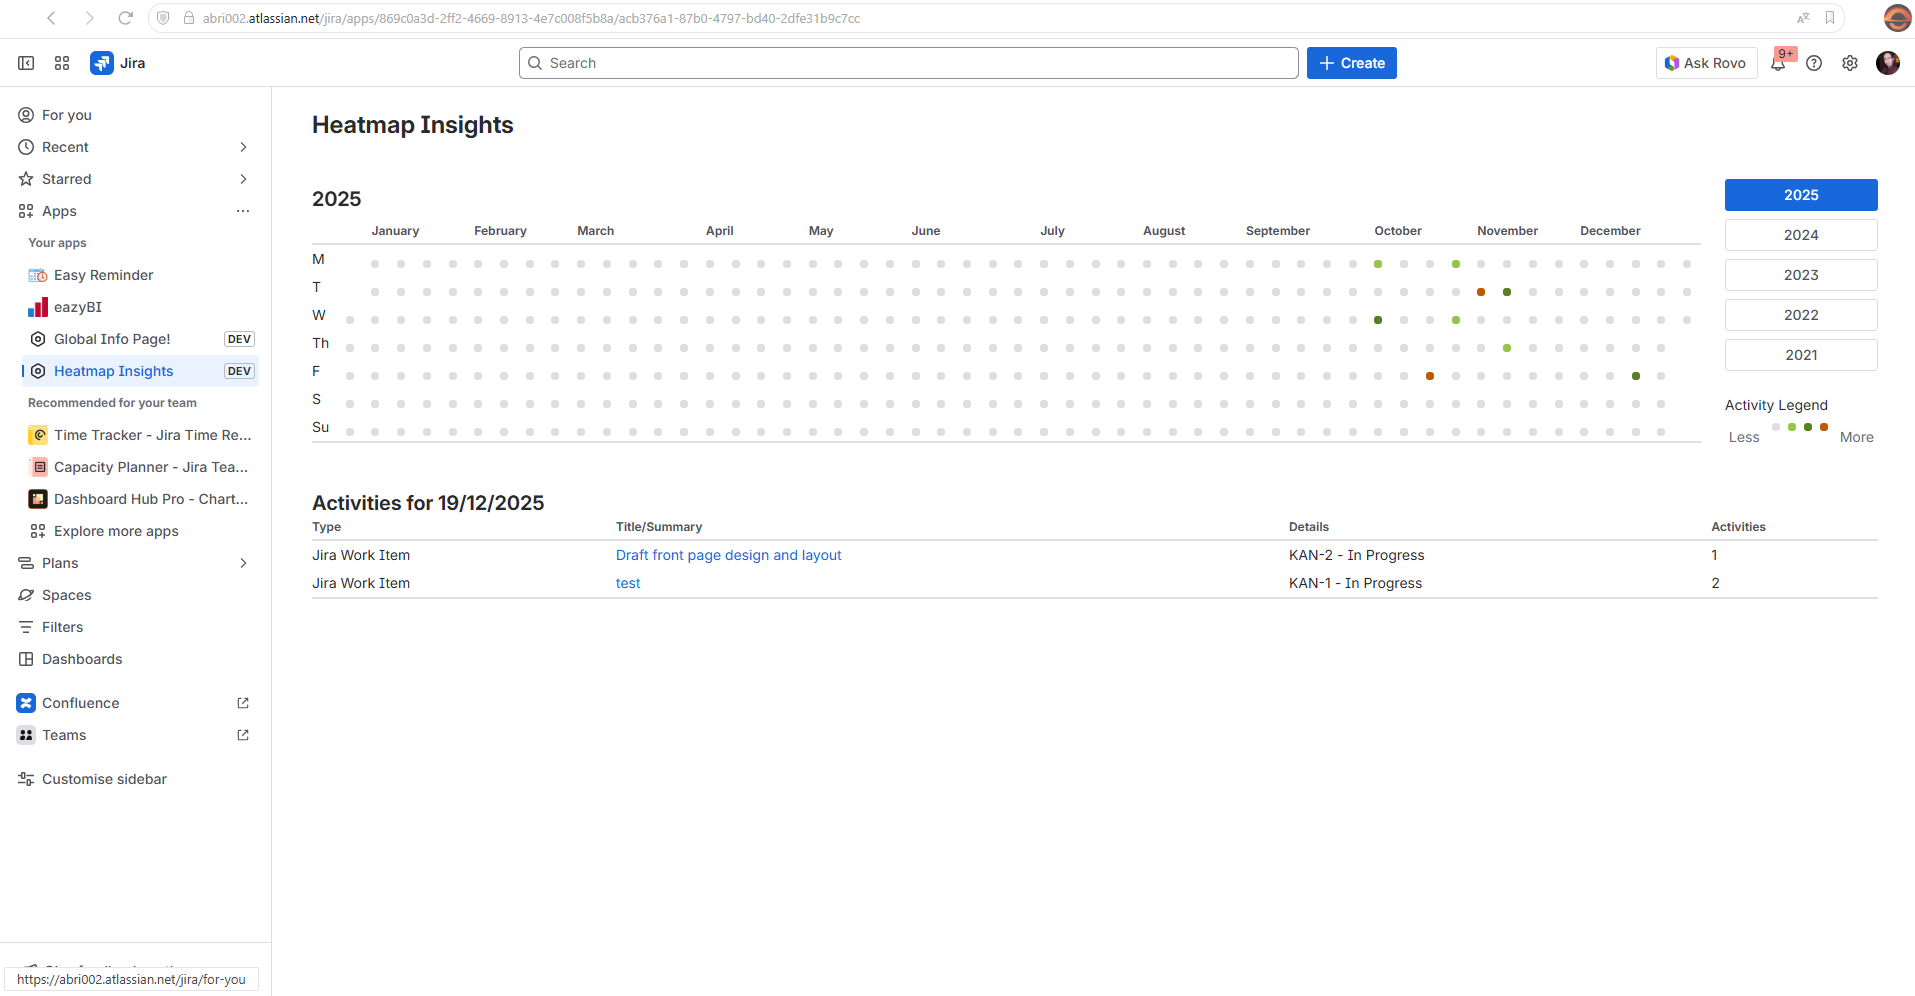
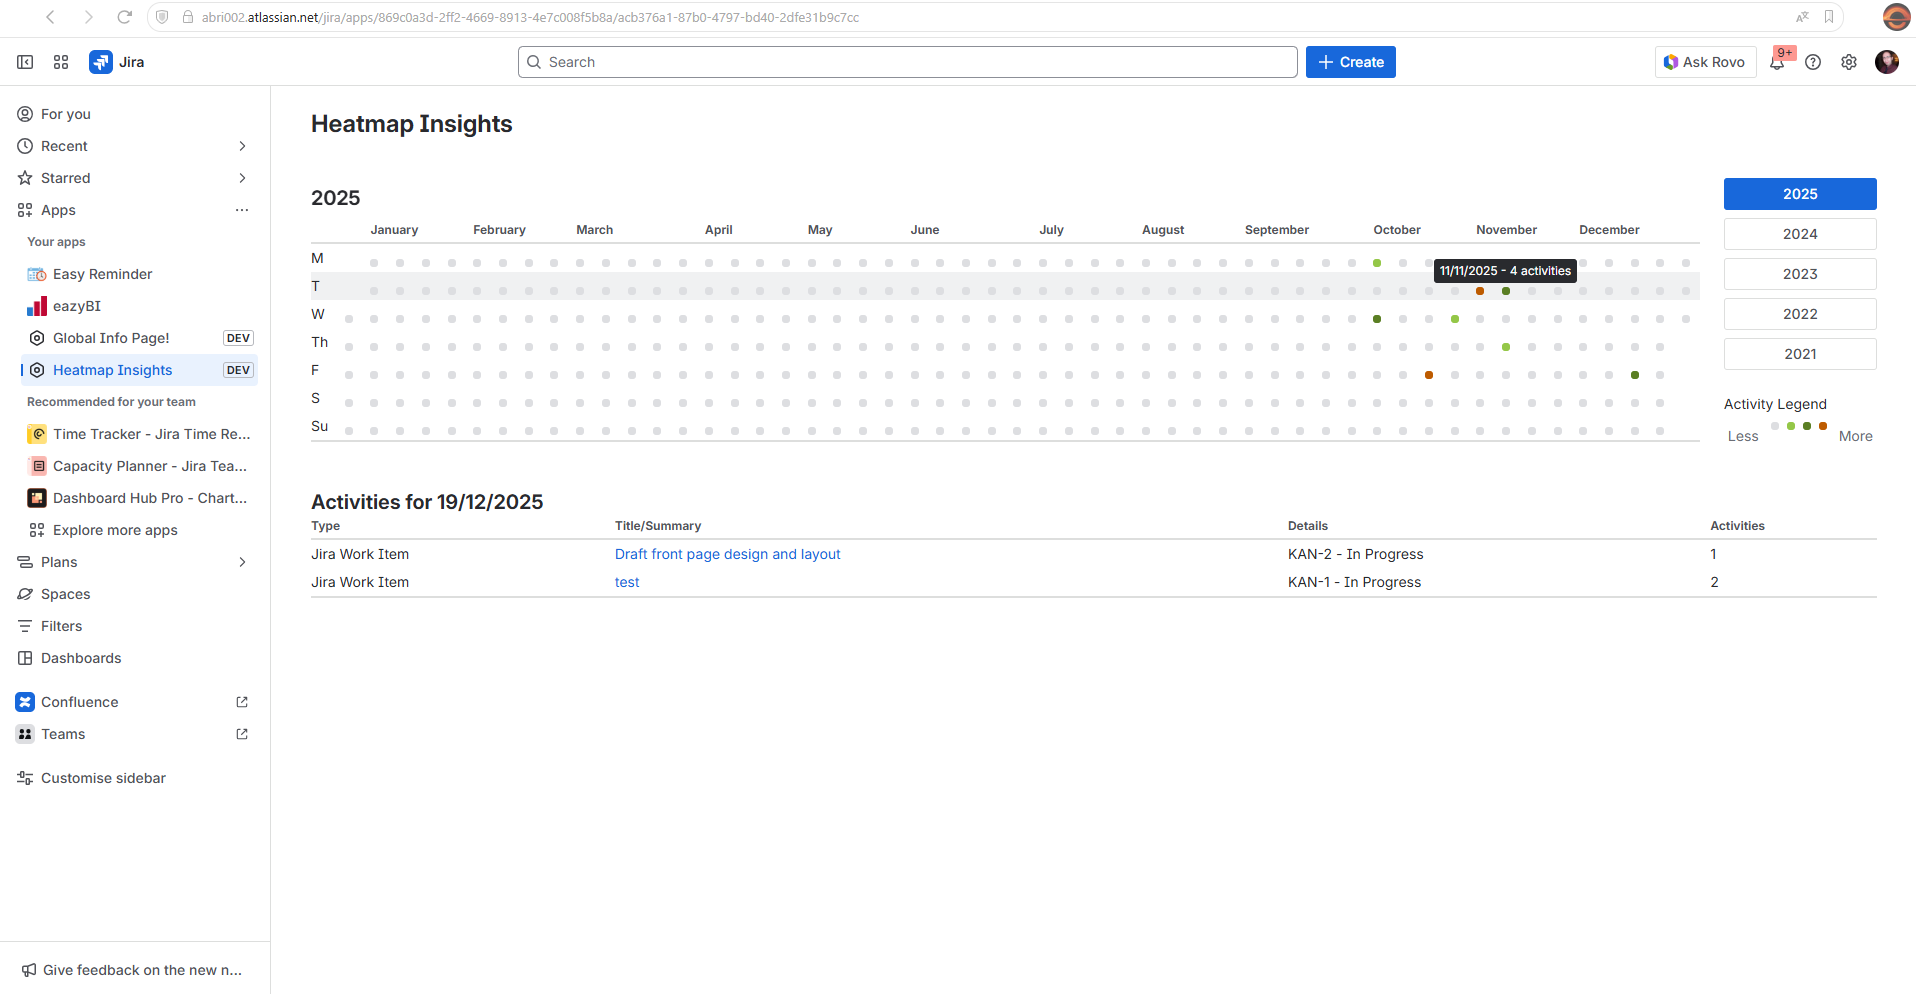
Jira and Confluence activities are displayed for each day
-
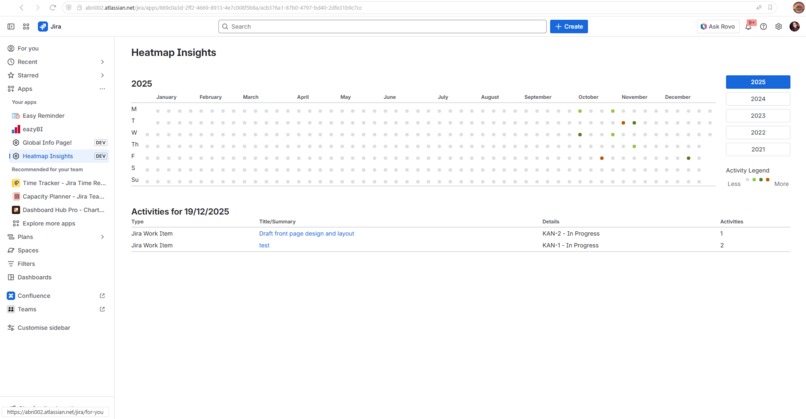
Simple heatmap with activities covering a whole year in a very compact space
-
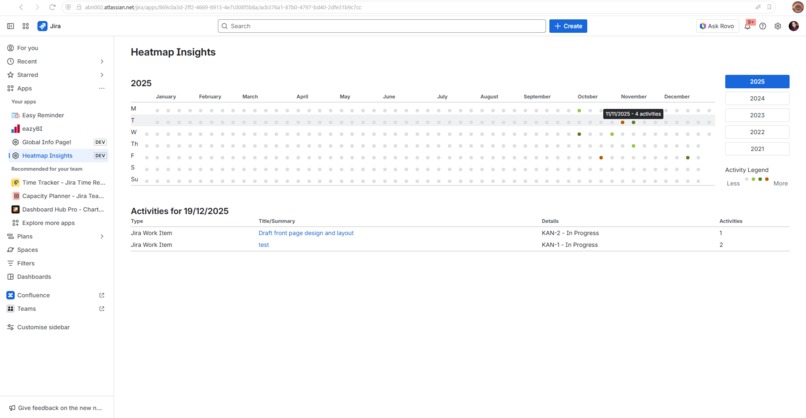
Practical and clear tooltip

Inspiration
Heatmap Insights was born from the everyday challenge of tracking and understanding past work. Whether it’s finding logged time for a specific work item, estimating future tasks based on historical data, or helping managers spot capacity issues and bottlenecks.
While Atlassian is advancing the Teamwork Graph to unify insights across its apps (through initiatives like the new Atlassian Home page and Teams space), we wanted something simple, fast, and immediately useful. The GitHub contribution heatmap served as our minimalistic inspiration, showing that a clear visual overview can deliver high value with minimal complexity.
What it does
Heatmap Insights provides a simple, centralized contribution heatmap for Jira, Confluence, and hopefully Bitbucket in the future, unifying scattered activity into a compact, visual timeline. It allows contributors, teams and managers to quickly see who is contributing, when work happens, and where effort is concentrated, saving time and improving visibility without manual reporting. By turning raw activity into a clear, intuitive view, it helps teams track progress, make better estimations based on historical data, balance workloads, and recognize contributions at a glance.
How we built it
We built Heatmap Insights as a Forge app for Jira Cloud, leveraging Atlassian’s Forge framework to securely access Jira and Confluence data. The app aggregates activity via REST API calls while using Teamwork Graph principles to display it in a responsive, easy-to-read heatmap. The interface was designed with simplicity and usability in mind, ensuring that teams can understand their activity patterns without leaving their usual workflows.
Challenges we ran into
One of the biggest challenges was aggregating data from multiple Atlassian tools in real time while maintaining performance and security. Mapping different activity types—issues, pages, commits—into a single cohesive timeline required careful data modelling. Additionally, designing a heatmap that was both informative and visually compact, without overwhelming users, required multiple iterations and feedback sessions. We aimed to rely entirely on Atlassian infrastructure, using UI Kit to deliver a fast, seamless solution without the complexity of external systems.
Accomplishments that we're proud of
We’re proud of creating an intuitive, single-pane-of-glass view for team contributions that brings immediate value to users. Despite the complexity of integrating multiple data sources, the app delivers smooth performance and an elegant interface. It’s also fully extensible, meaning future enhancements can include additional Atlassian products while keeping the same simple and user-friendly experience.
What we learned
Building Heatmap Insights taught us the importance of balancing functionality with simplicity. While it was tempting to include every possible metric, we learned that focusing on core, actionable insights drives adoption. We also gained experience in Forge app development, data aggregation across Atlassian tools, and creating visualizations that are meaningful without being overwhelming.
What's next for Heatmap Insights
Next, we plan to expand support to additional Atlassian products, offering a truly comprehensive view of team activity, making use of the new Teamwork Graph API once fully available for Forge (currently in EAP). The add needs permissions and the ability to select multiple users, groups or teams for quick insights that affect more than one user. We also aim to introduce more customizable visualizations and analytics, enabling teams to track progress and productivity trends over time. Our goal is to make Heatmap Insights the go-to tool for teams that want a simple, powerful way to visualize contributions across the Atlassian ecosystem.

Log in or sign up for Devpost to join the conversation.