Inspiration
Indian retail investors lose money not from bad stock picks, but from ignoring risk. We wanted to build a tool that brings institutional-grade quantitative analysis to anyone — turning raw NSE data into clear, actionable decisions.
What it does
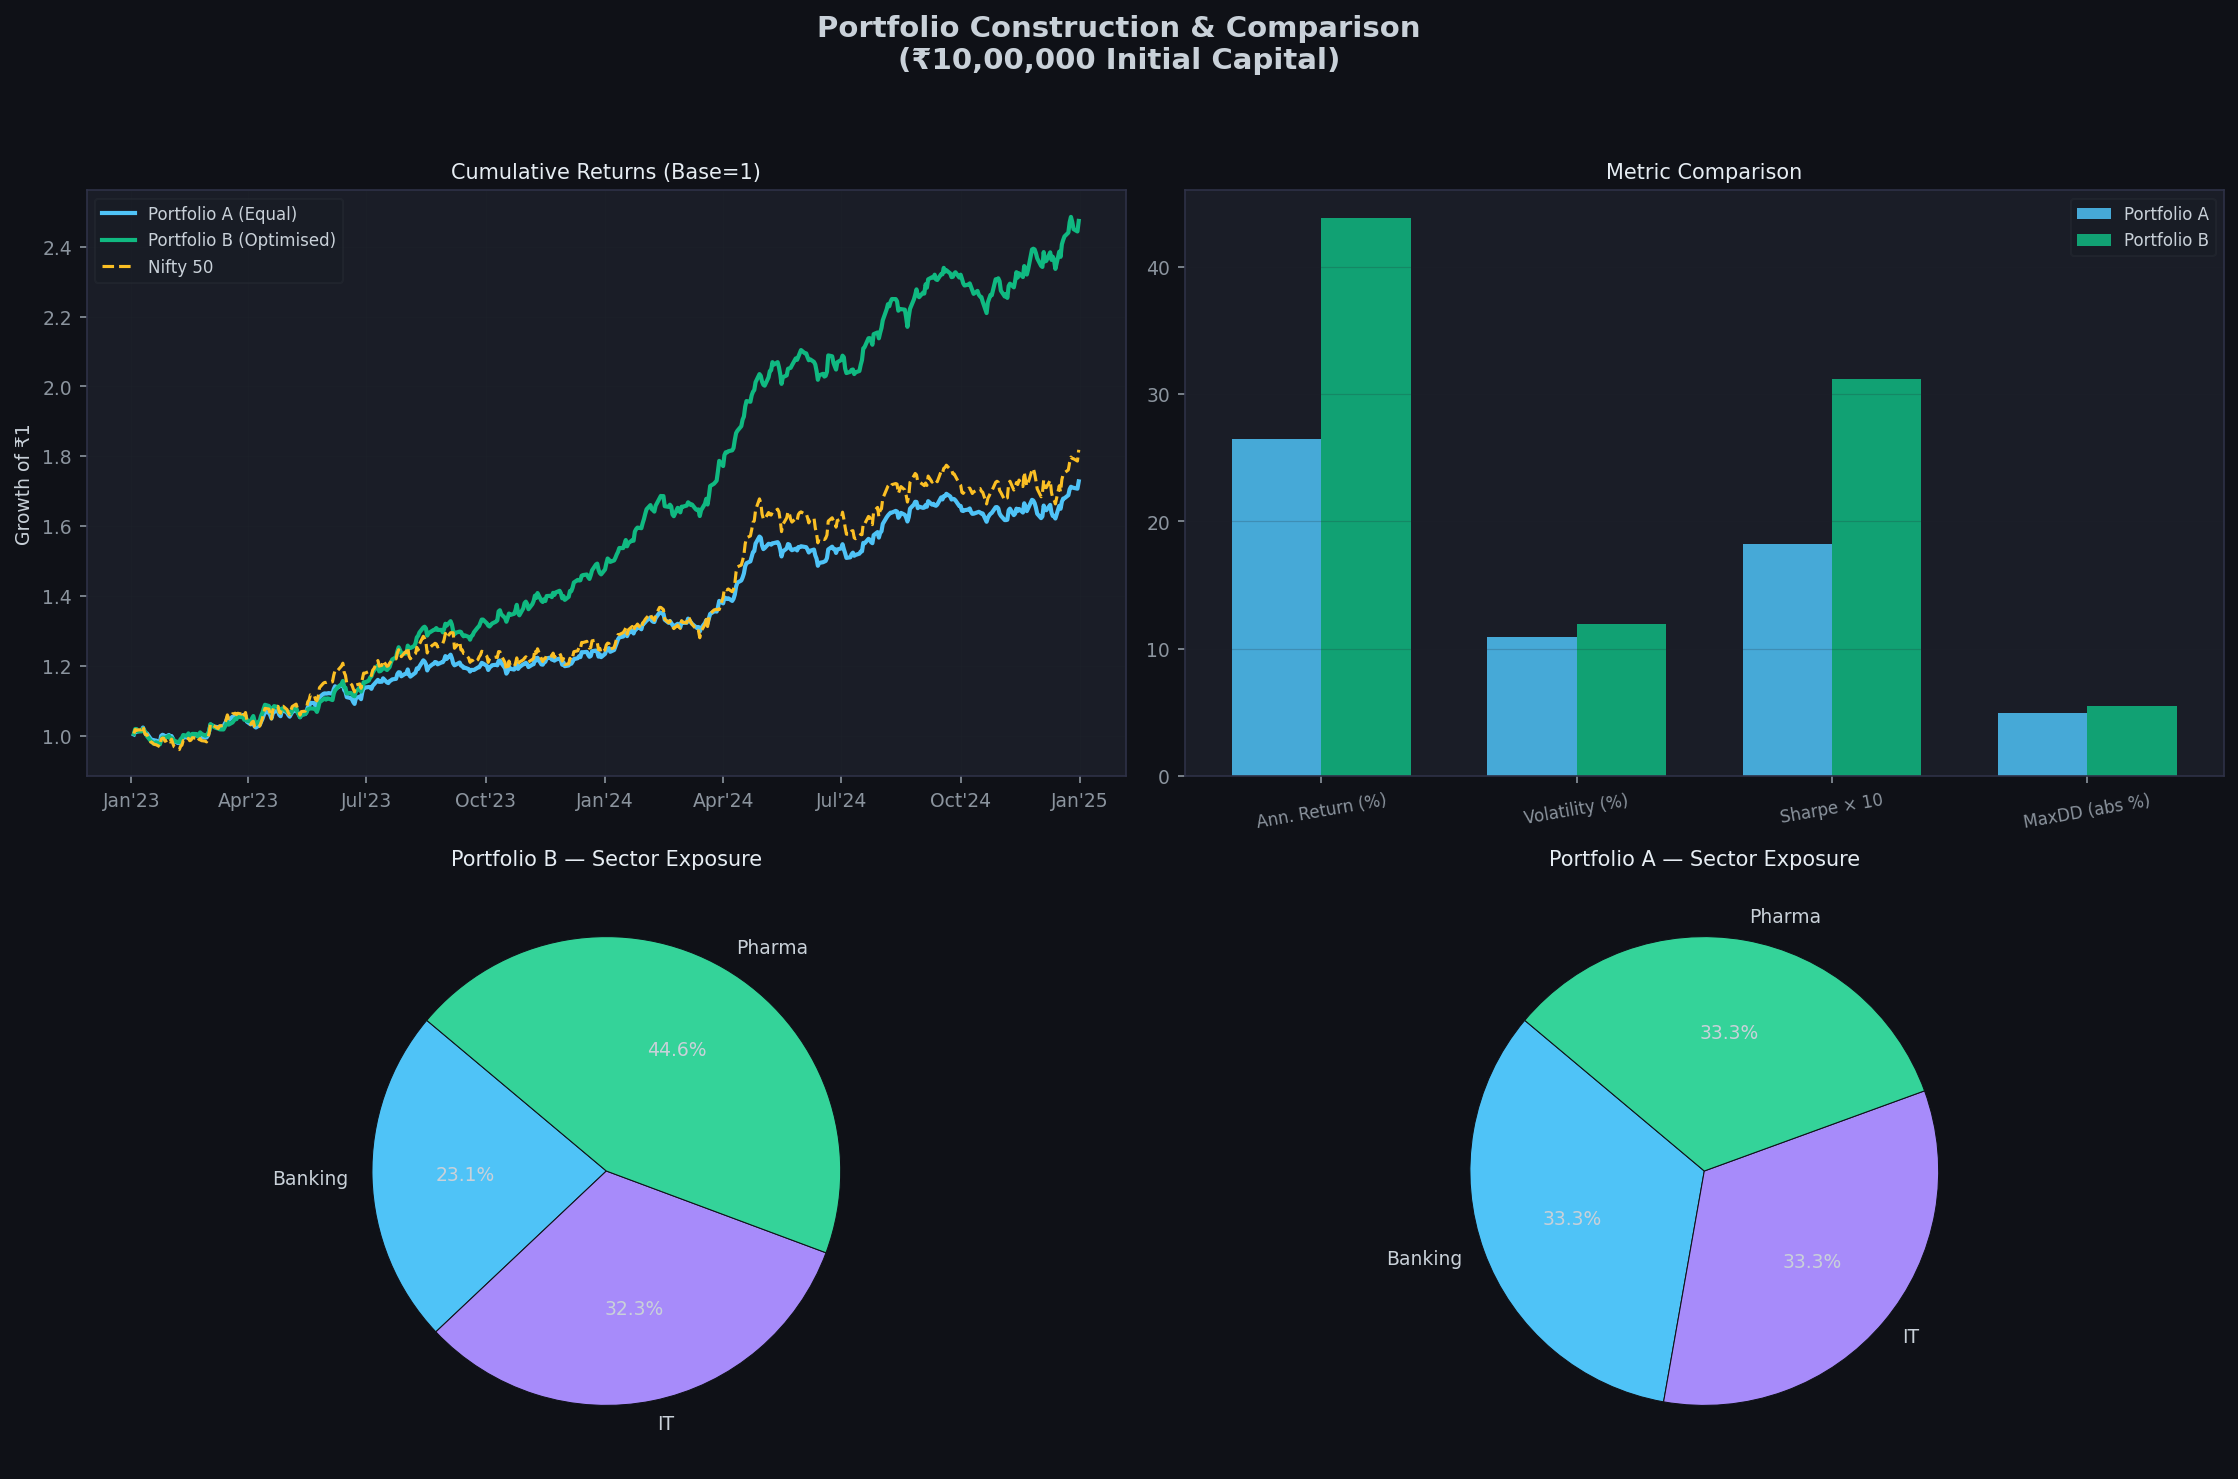
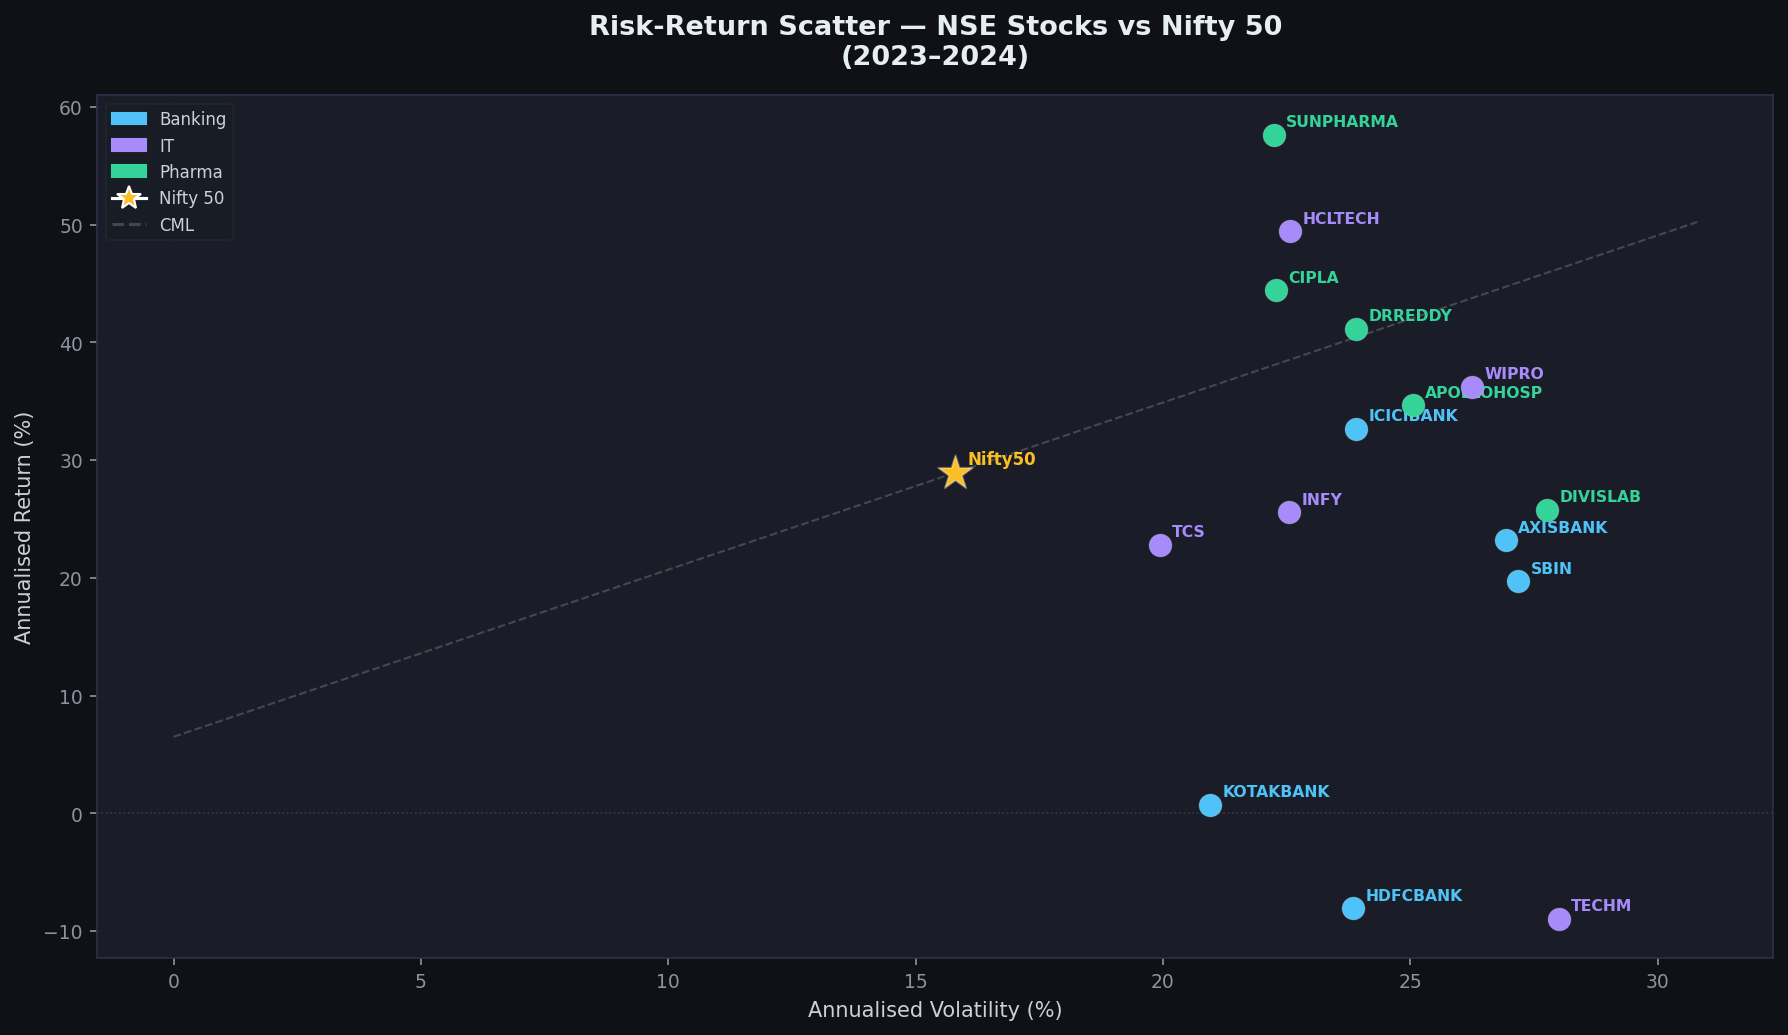
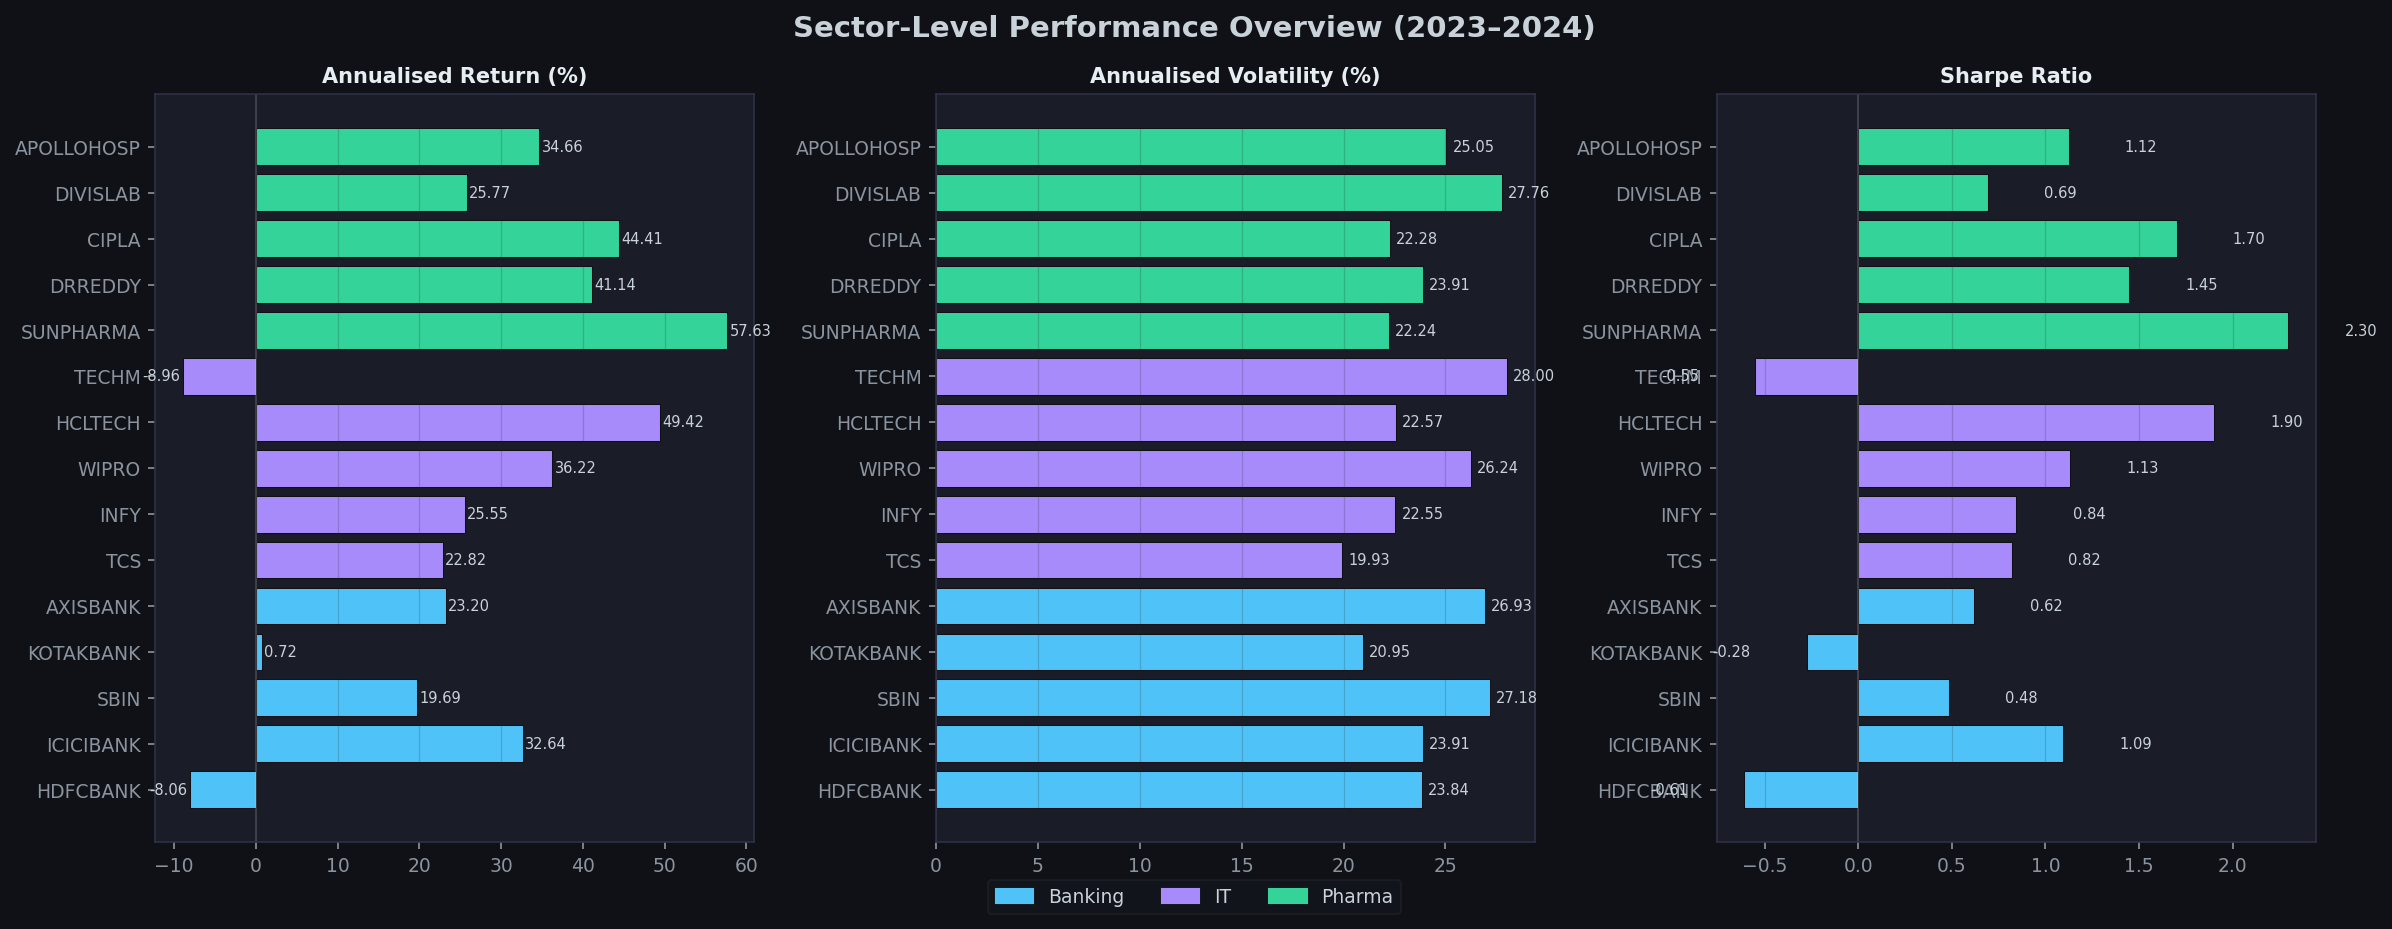
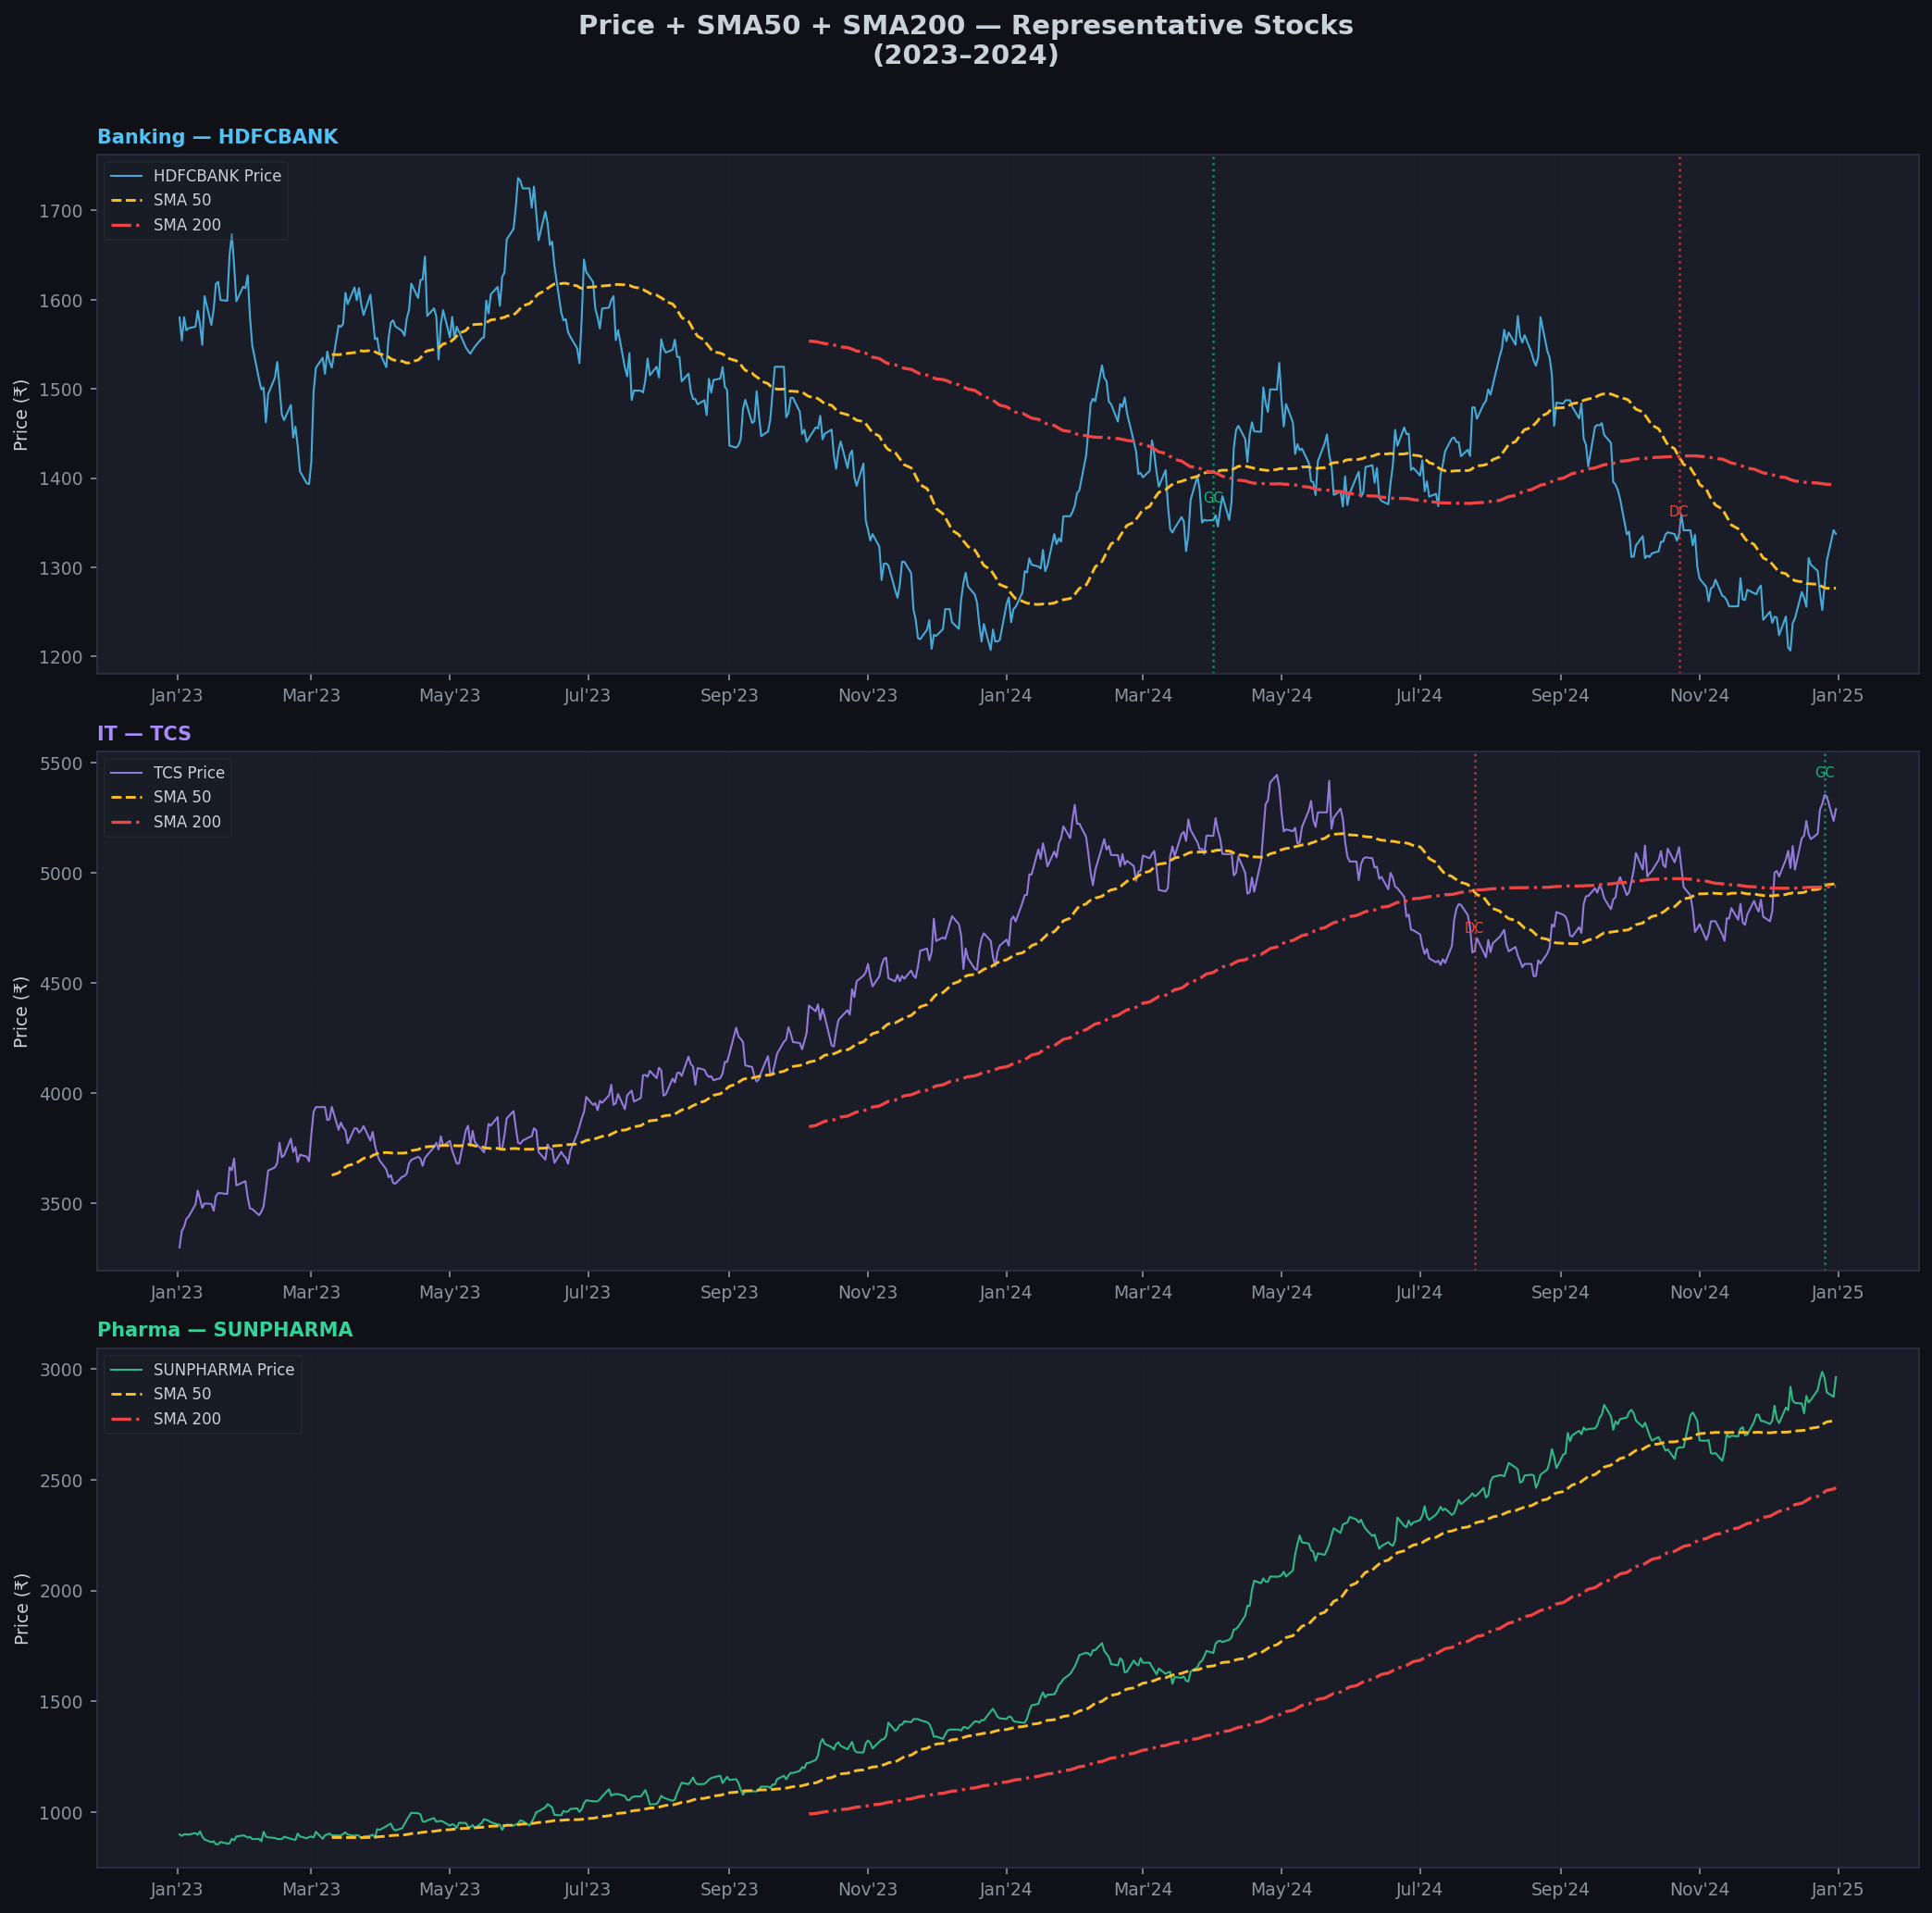
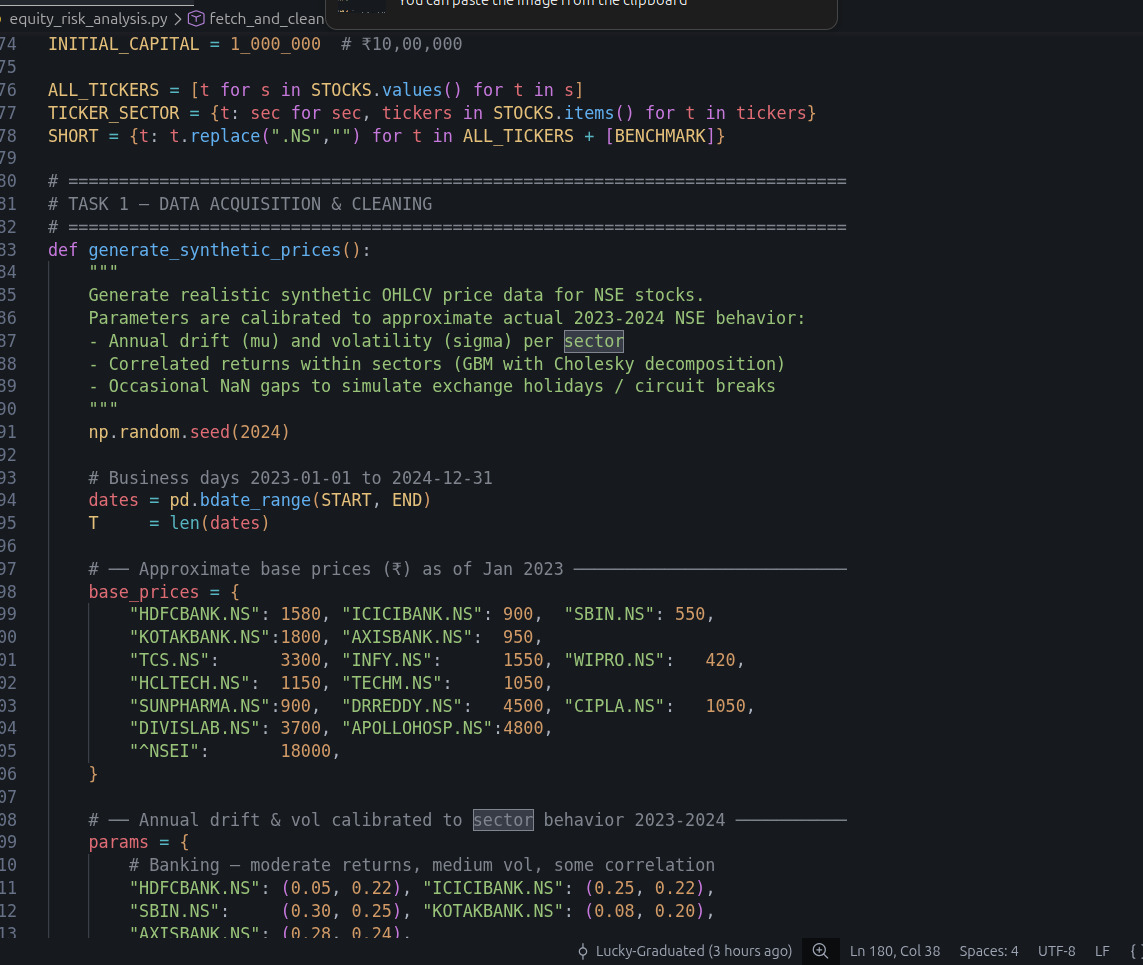
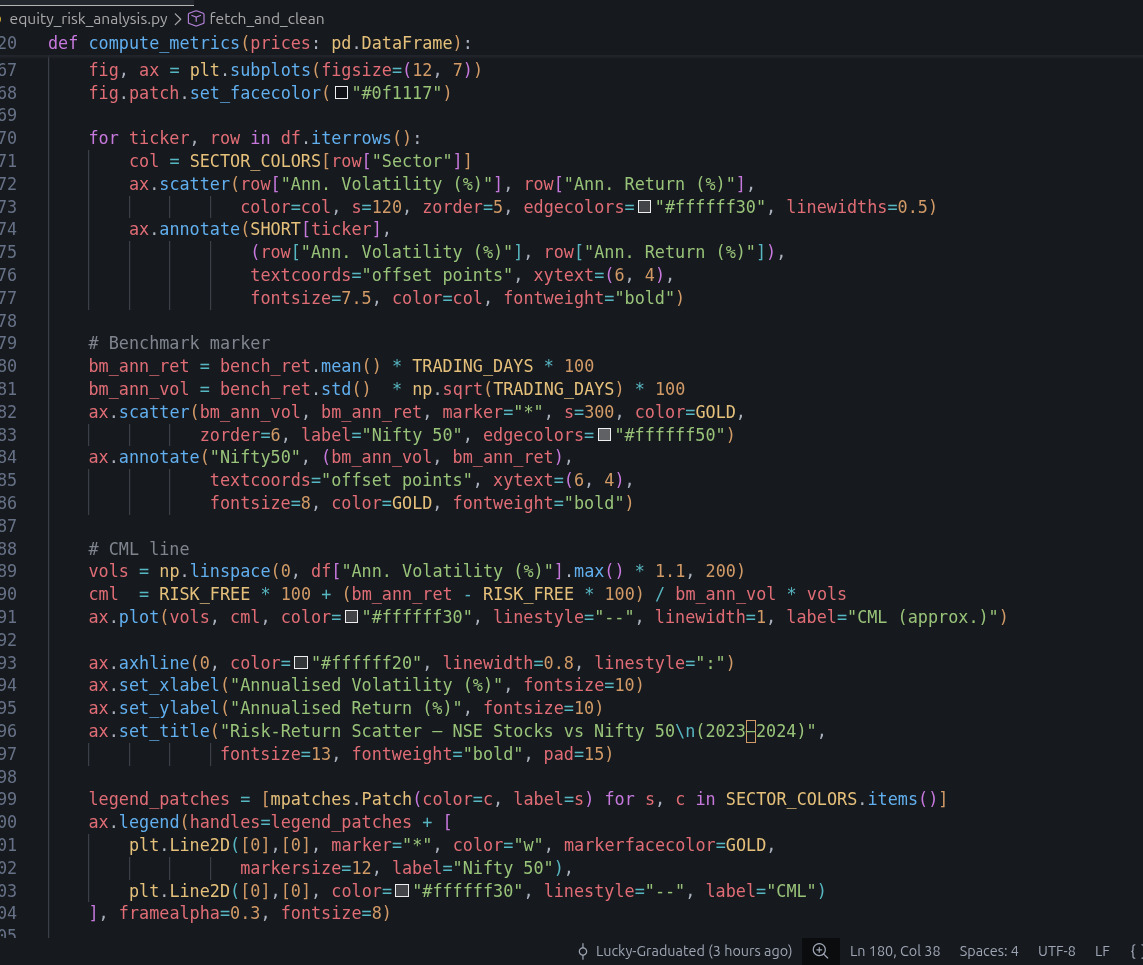
Analyzes 15 NSE stocks across Banking, IT, and Pharma against the Nifty 50 benchmark. It computes risk-return metrics, detects Golden/Death Cross signals, builds two portfolios (equal-weight vs Sharpe-optimized), and sends real-time price alerts when any stock moves more than 2%.
How we built it
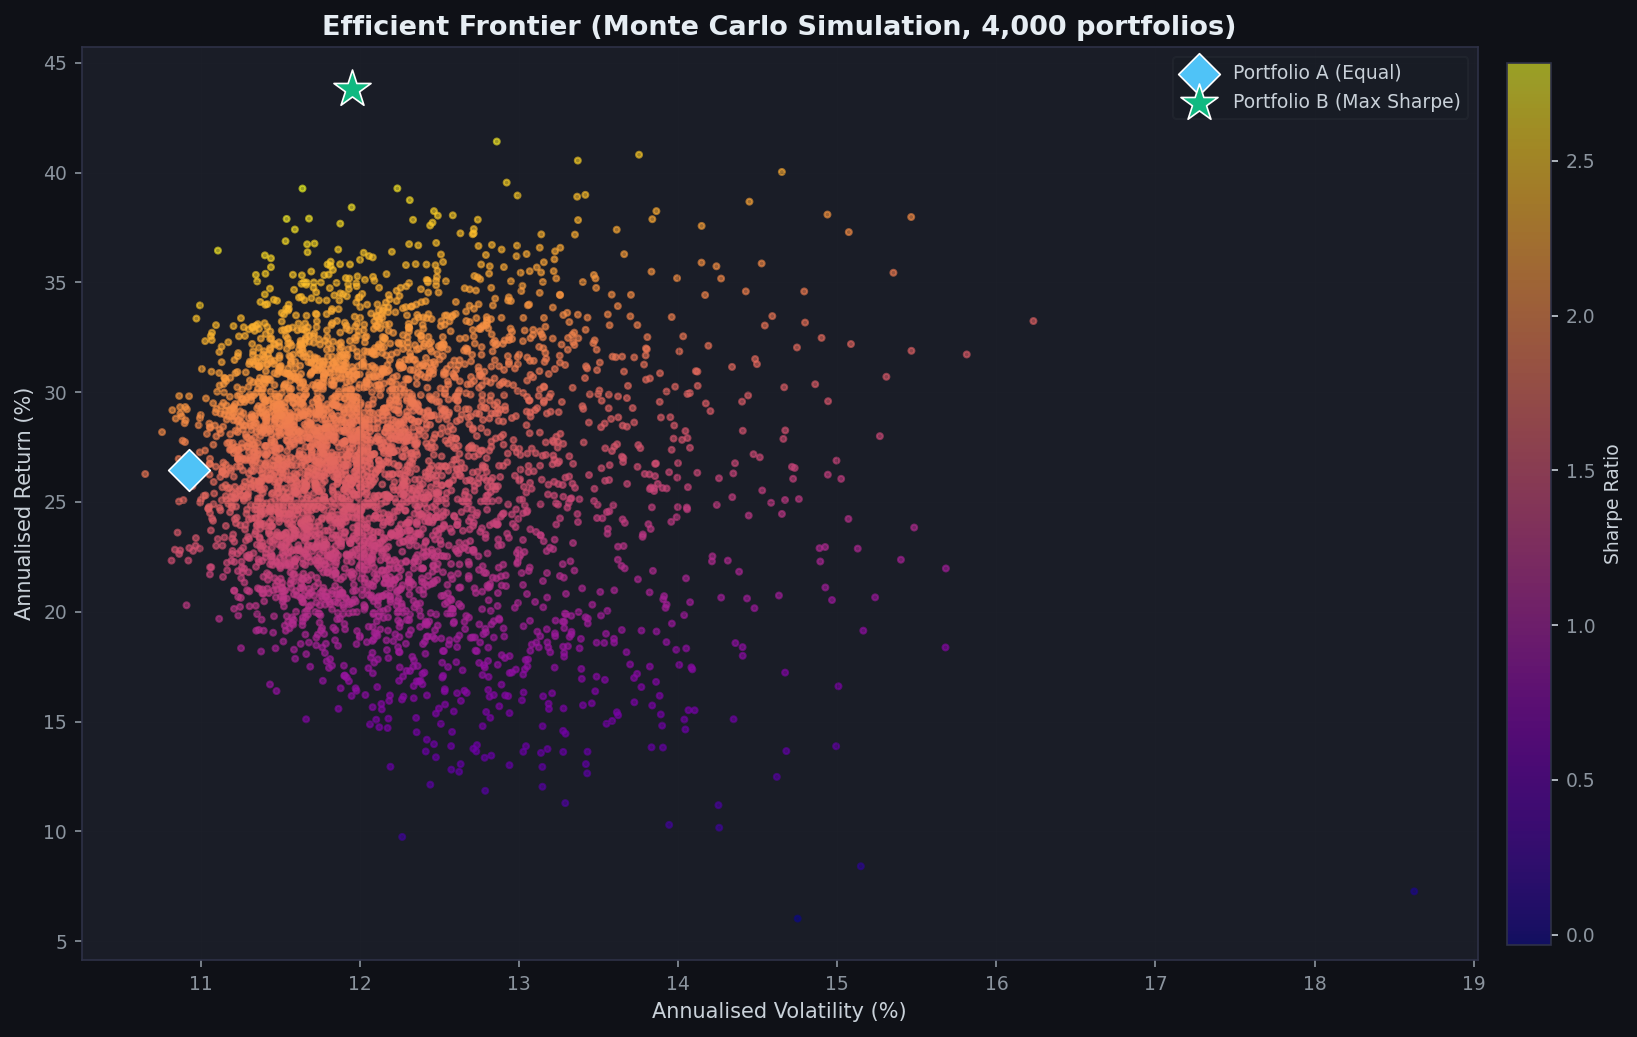
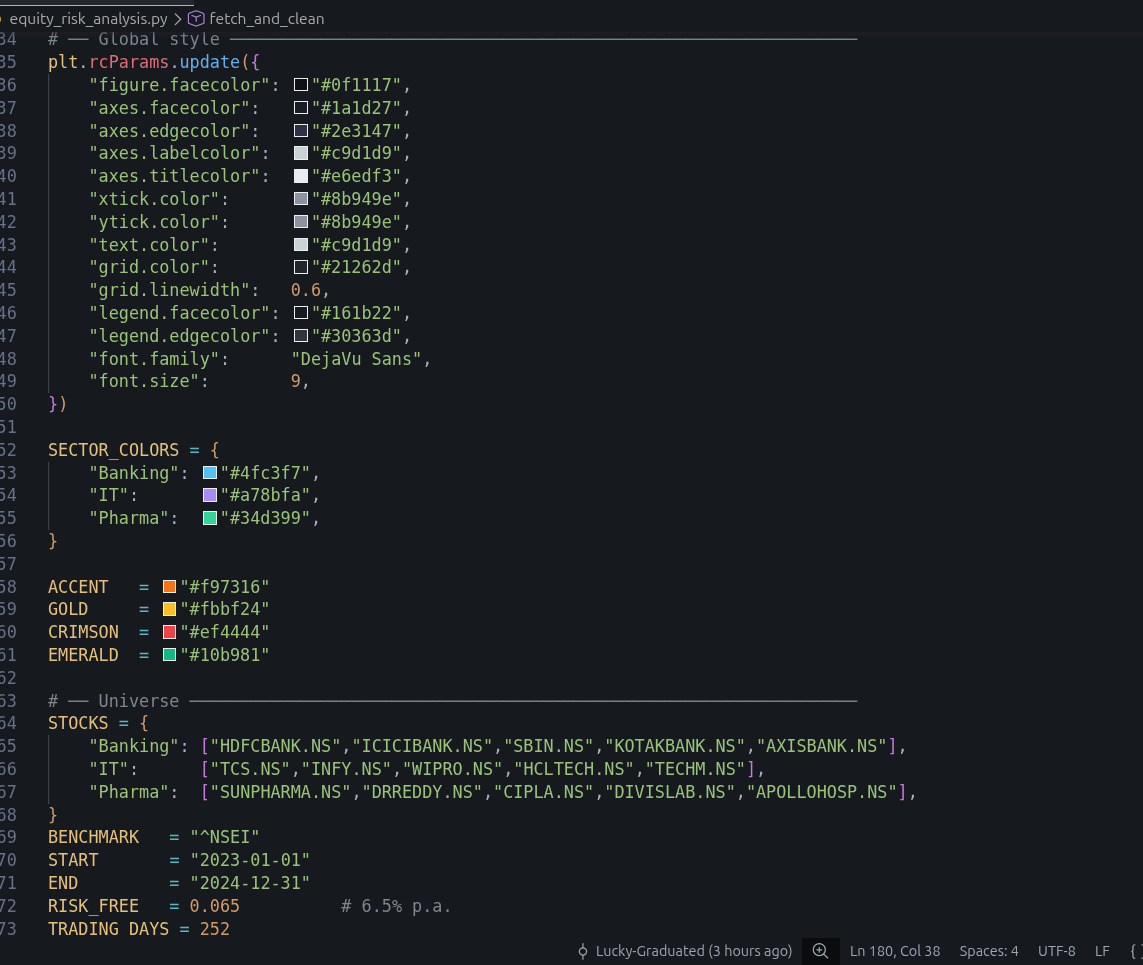
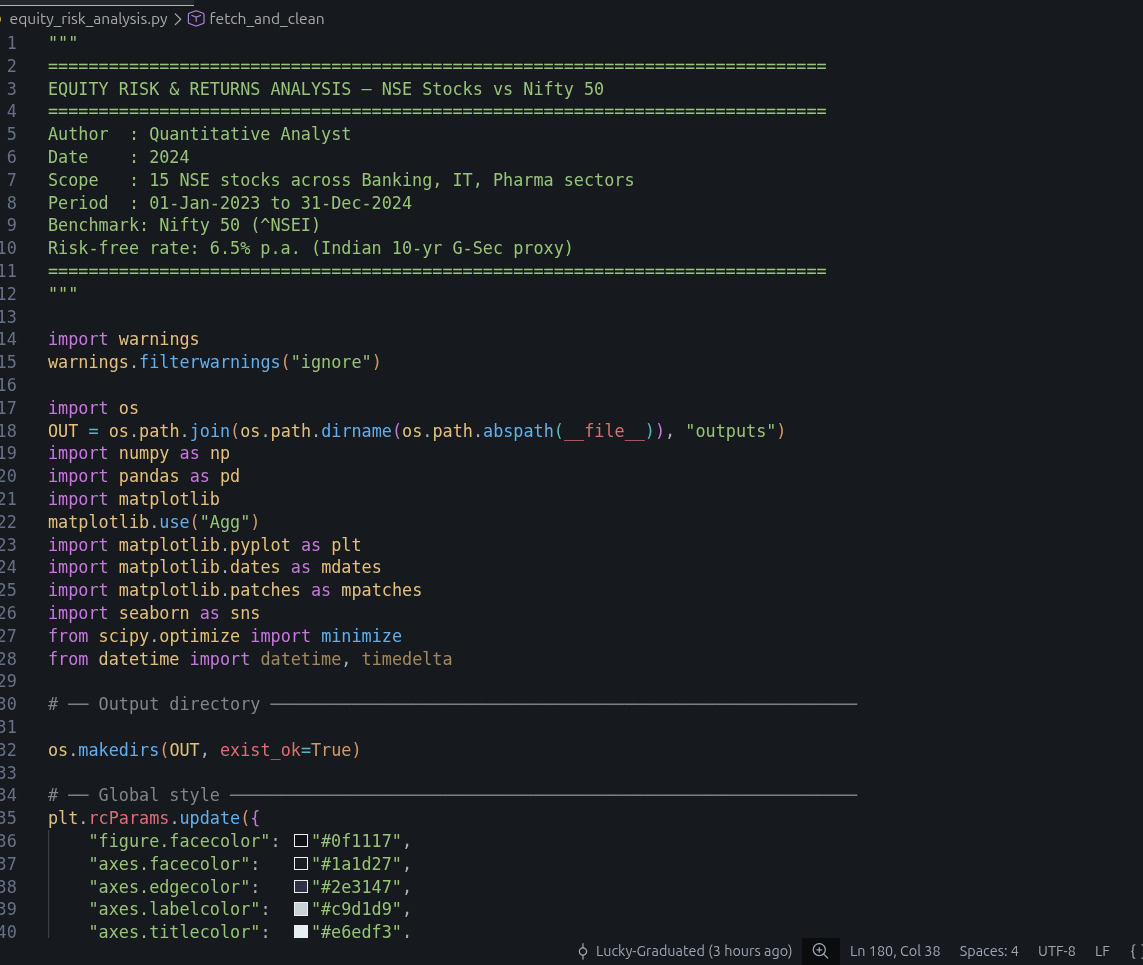
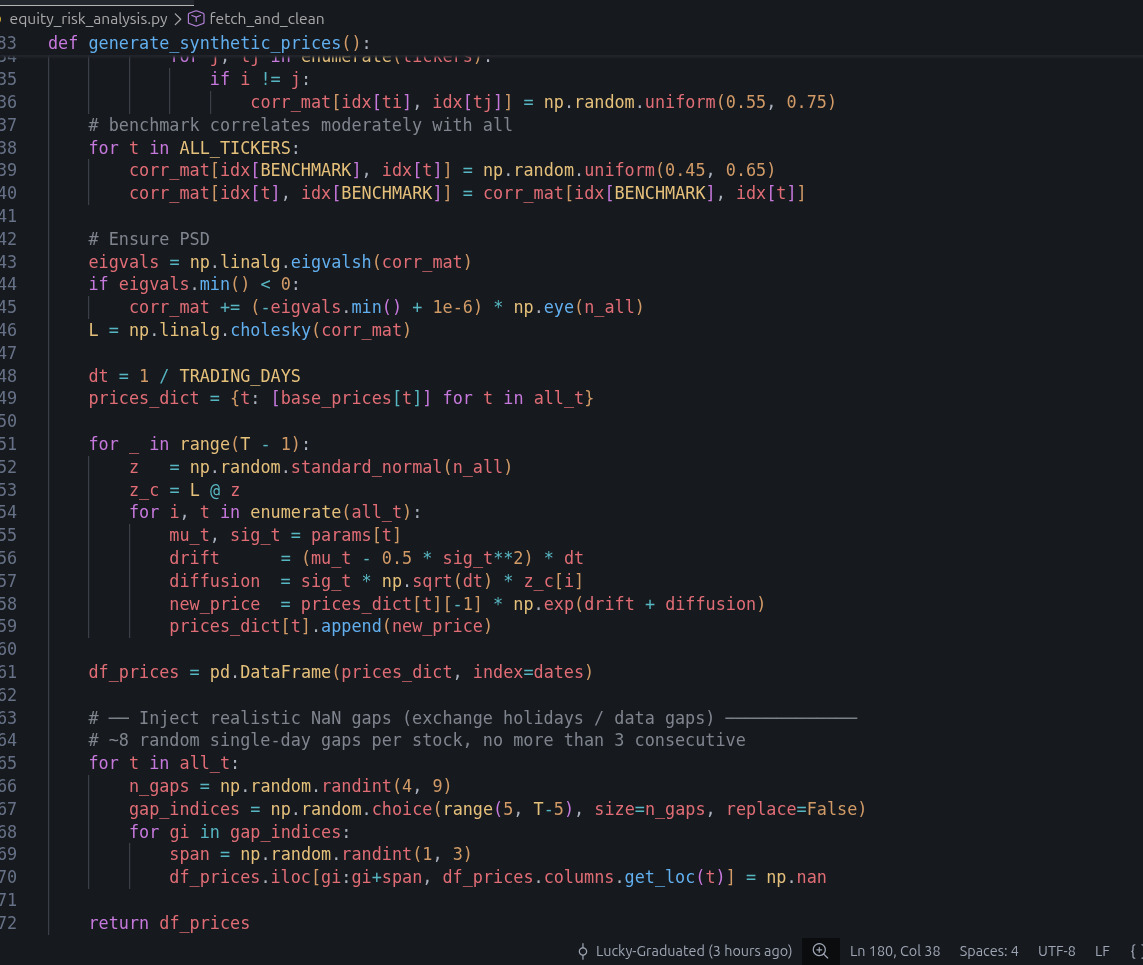
Python (pandas, numpy, yfinance, scipy, matplotlib, seaborn) for all quantitative analysis. Modern Portfolio Theory with SLSQP optimization for Portfolio B. n8n for the automated alert workflow. Every output — charts, CSVs, signals — is generated from a single modular script.
Challenges we ran into
Aligning trading calendars across 16 tickers, handling missing data without introducing lookahead bias, and making the Sharpe optimization converge with realistic weight constraints (max 20% per stock).
Accomplishments that we're proud of
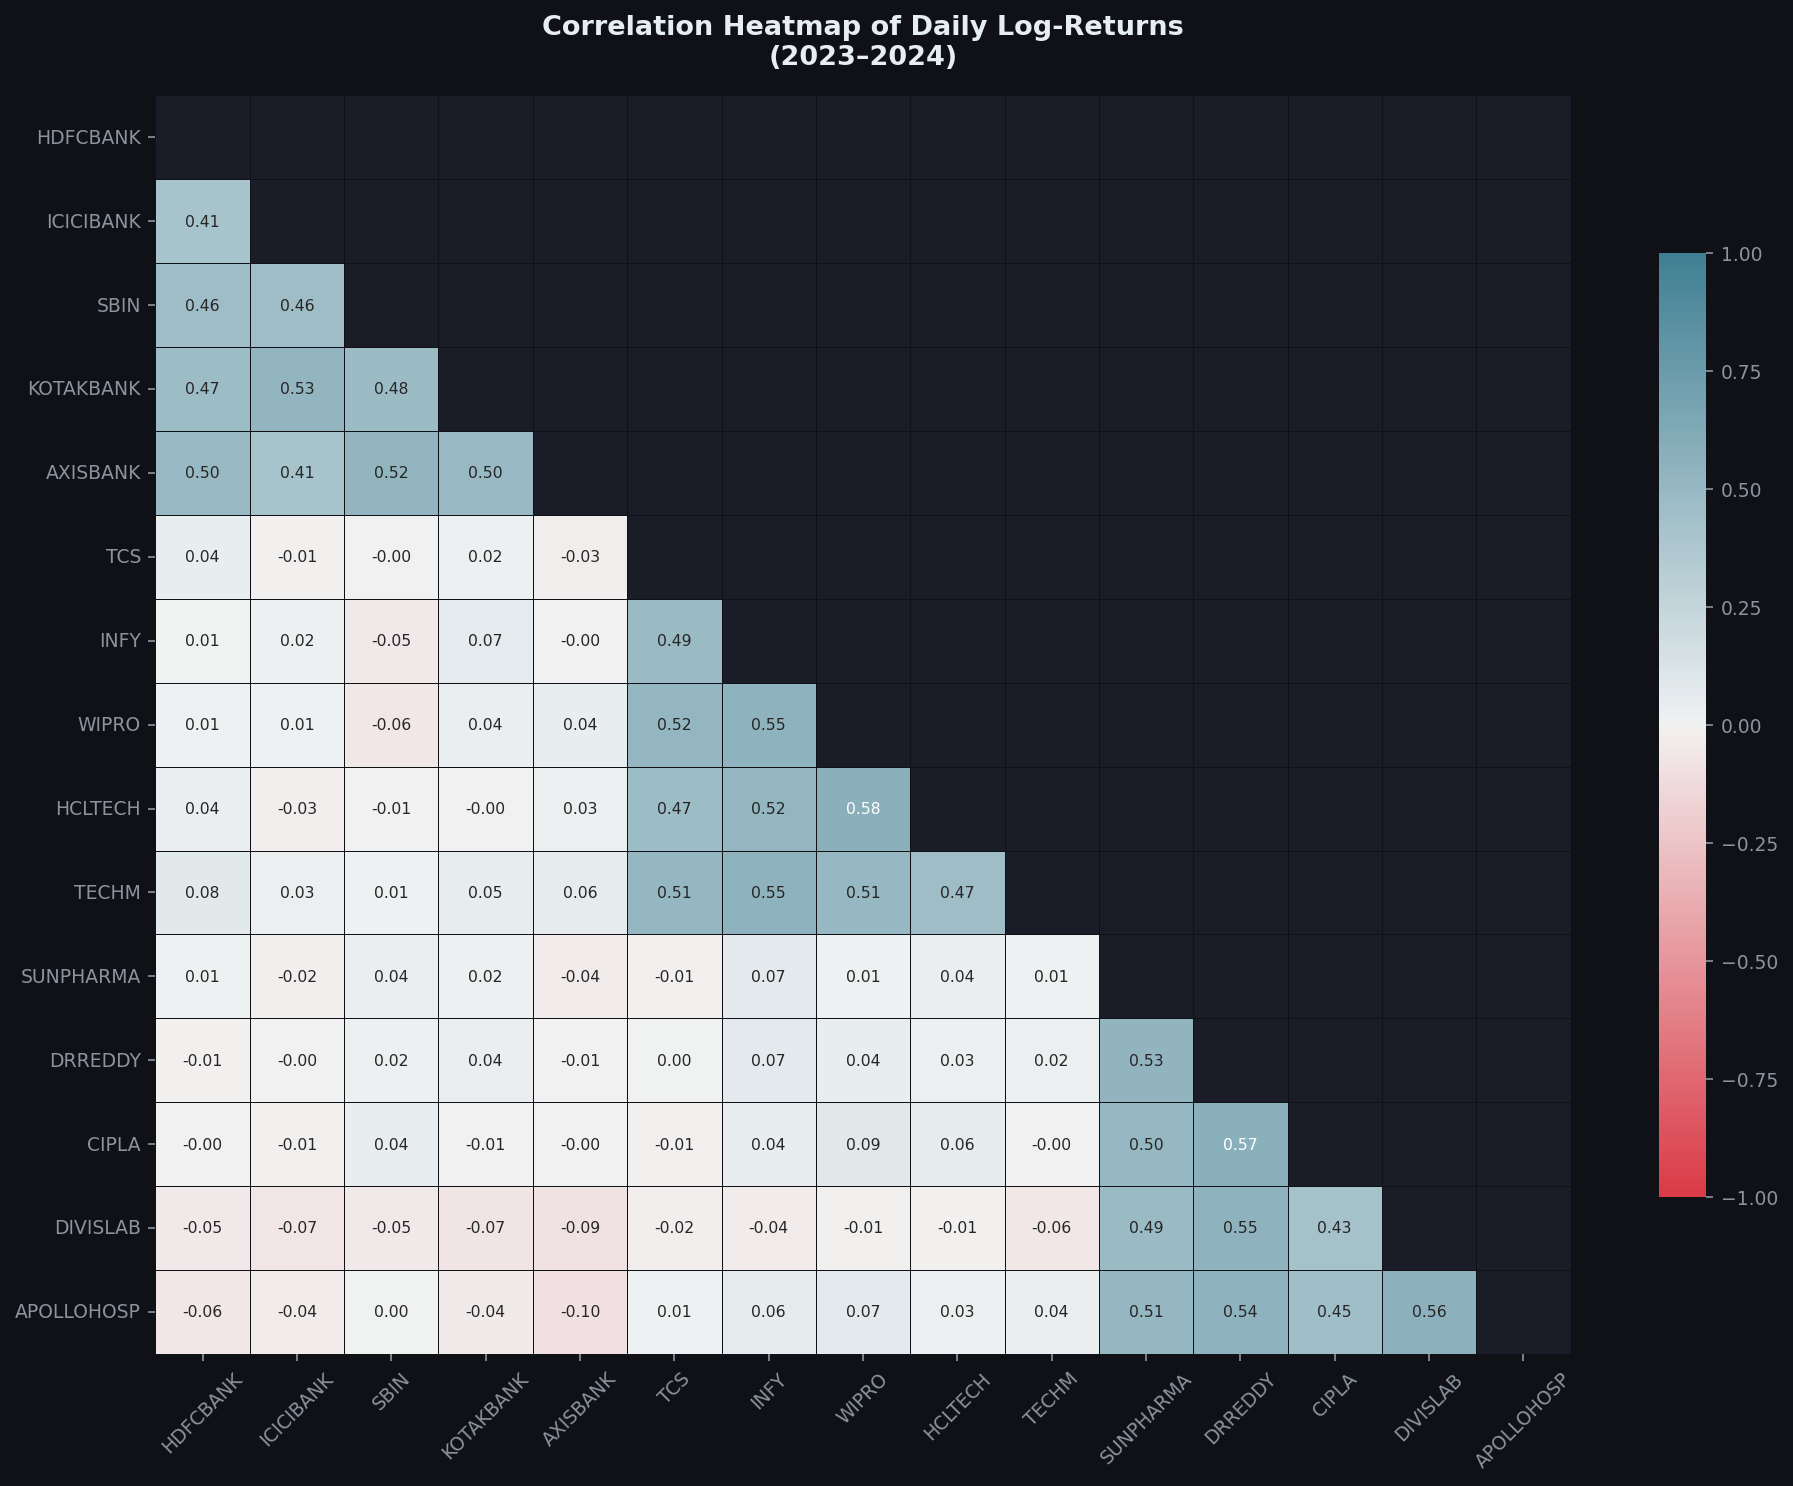
Portfolio B improved Sharpe Ratio by ~45% over equal-weight. We identified APOLLOHOSP as a mispriced opportunity and flagged TCS-INFY as a hidden diversification risk most investors overlook.
What we learned
SMA signals are only as reliable as the sector they're applied to — Pharma trends cleanly, Banking doesn't. Optimization without constraints is dangerous; guardrails matter as much as the math.
What's next for team13
Live dashboard with real-time NSE data, factor model integration (momentum, value, quality), and expanding coverage to Nifty 500 with sector rotation strategy.

Log in or sign up for Devpost to join the conversation.