-
-
Atlas Overview
-
Sport Explorer
-
Parity Lens
-
Compare Regions
-
Ask the Analyst
Inspiration
Team USA Atlas was inspired by the idea that Team USA fan engagement can be more inclusive and analytical when it looks beyond medals, star athletes, and highlight reels. I wanted to build something that helps fans understand the collective geography of Team USA: where Olympic and Paralympic athletes come from, which hometown hubs appear often, how sports are distributed across regions, and how Summer/Winter and Olympic/Paralympic patterns show up side by side.
A major inspiration was responsible storytelling. Instead of building a prediction engine or ranking “best” states, Team USA Atlas is built around the principle “pattern, not prediction.” It surfaces aggregate hometown patterns from public roster data while avoiding individual athlete outputs, causal claims, finish times, scores, or medal-based rankings.
What it does
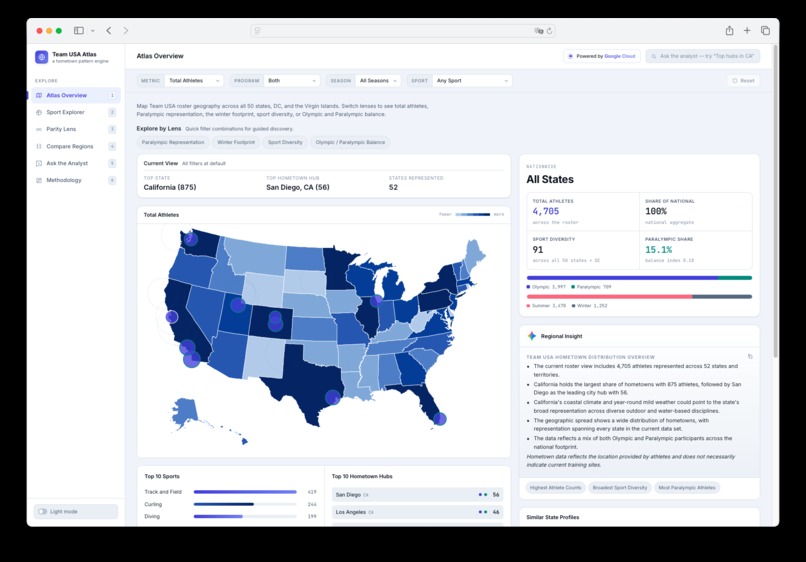
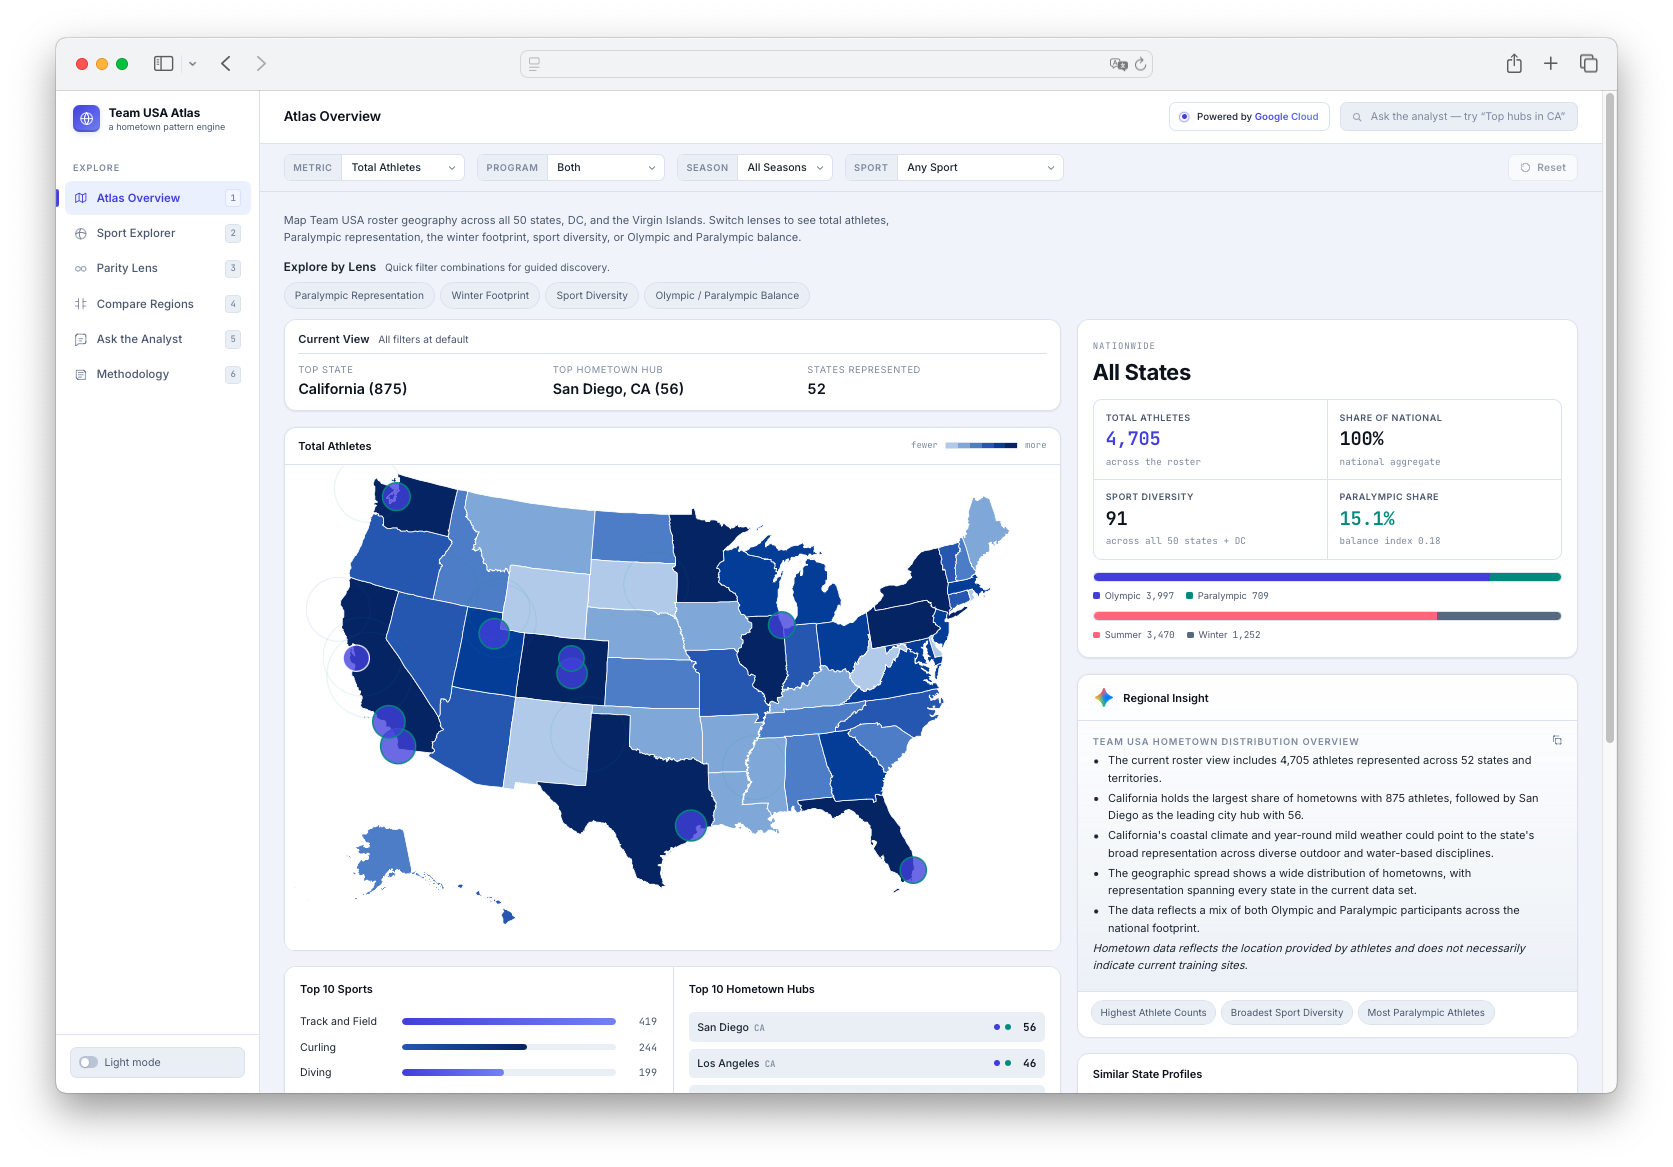
Team USA Atlas is an interactive analyst dashboard for exploring aggregate Team USA roster geography. Fans can use it to explore state-level patterns, hometown hubs, sports, season splits, Olympic and Paralympic representation, and climate context across the current roster snapshot.
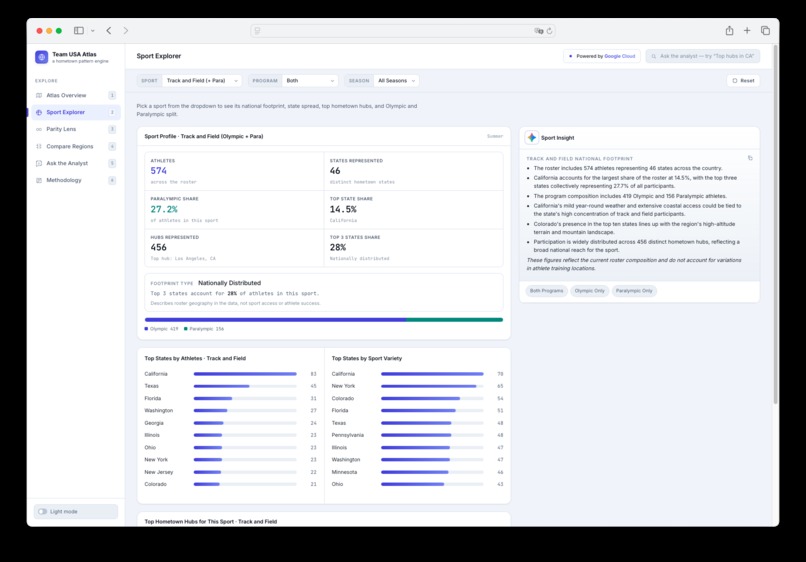
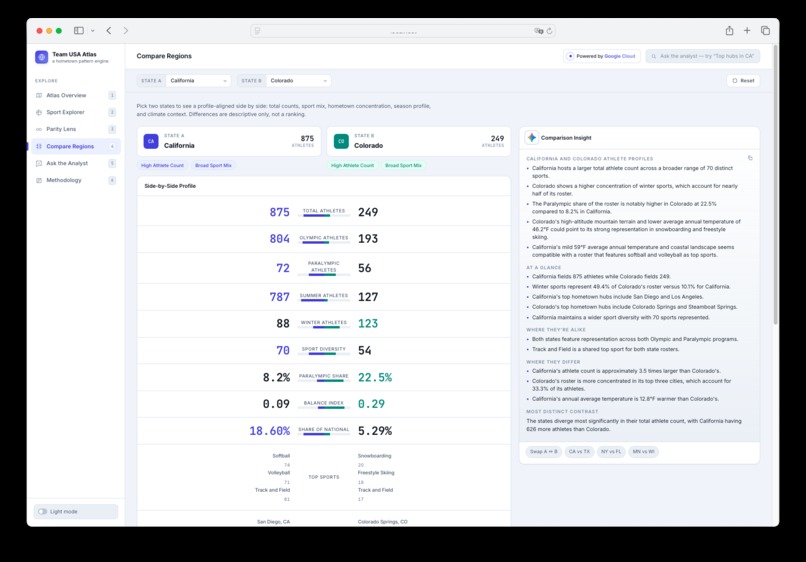
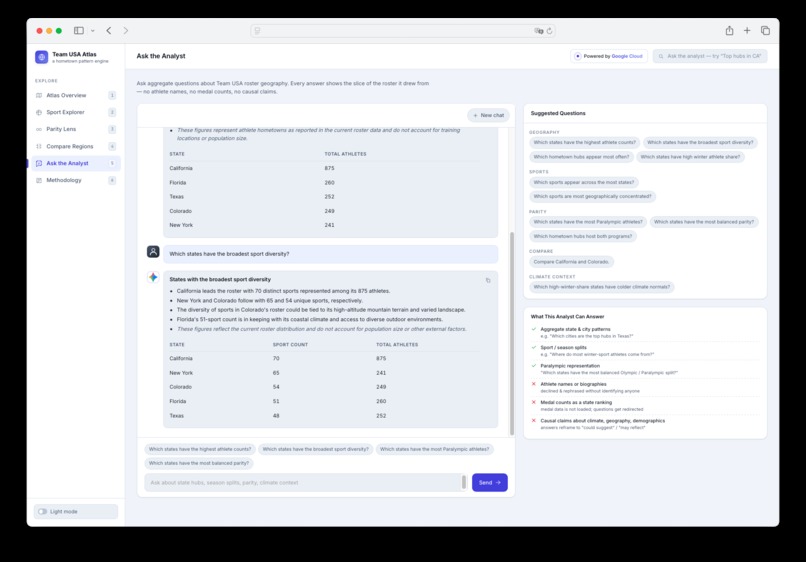
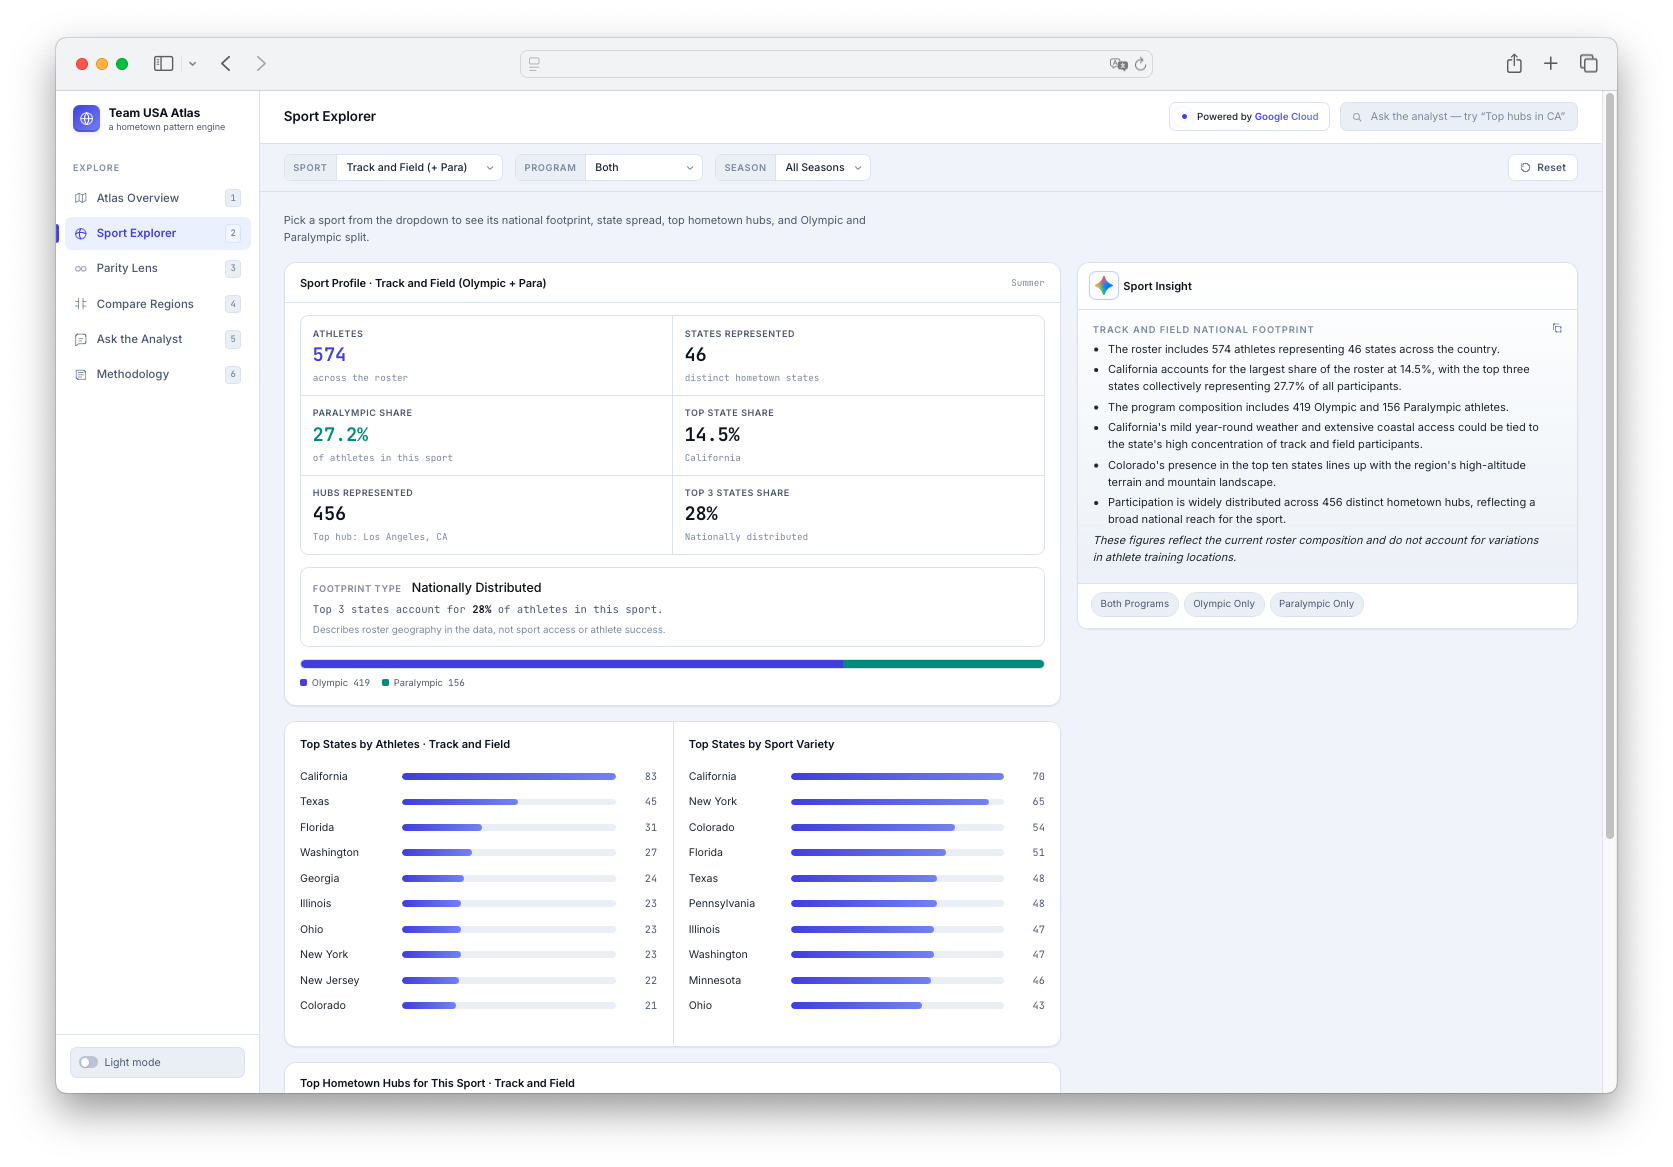
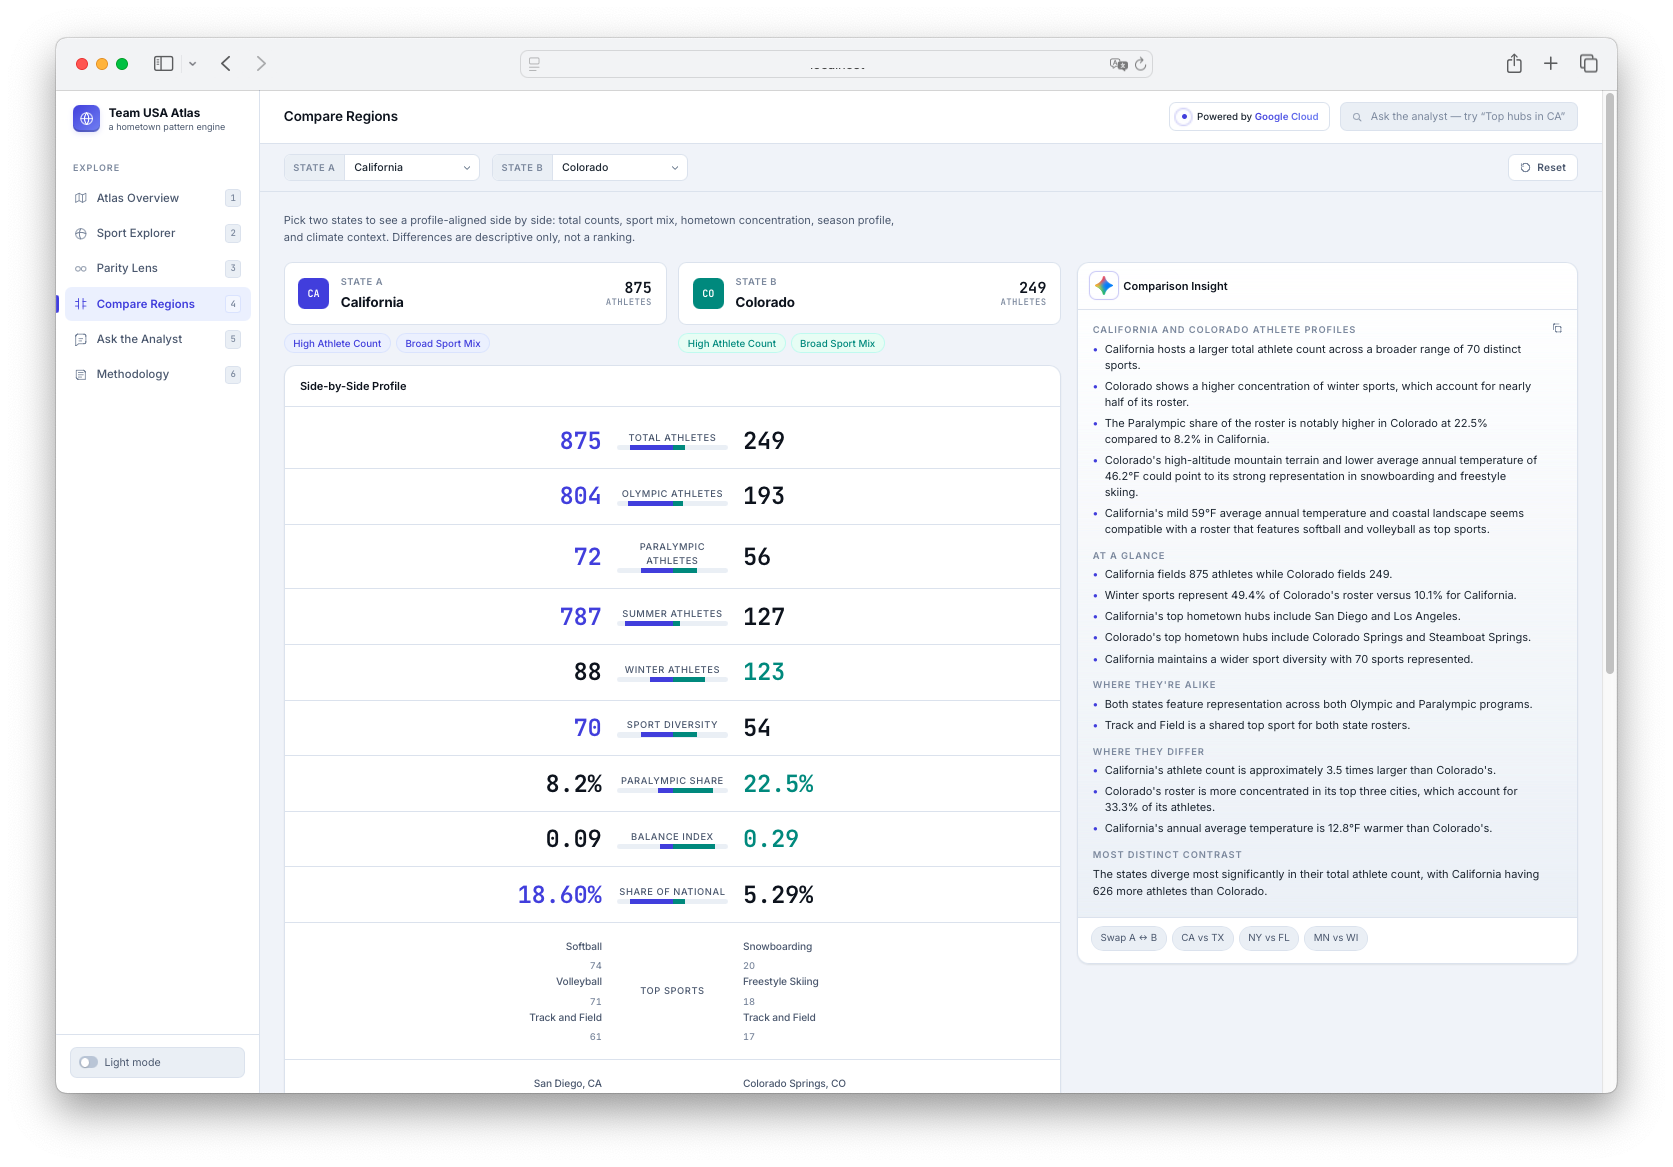
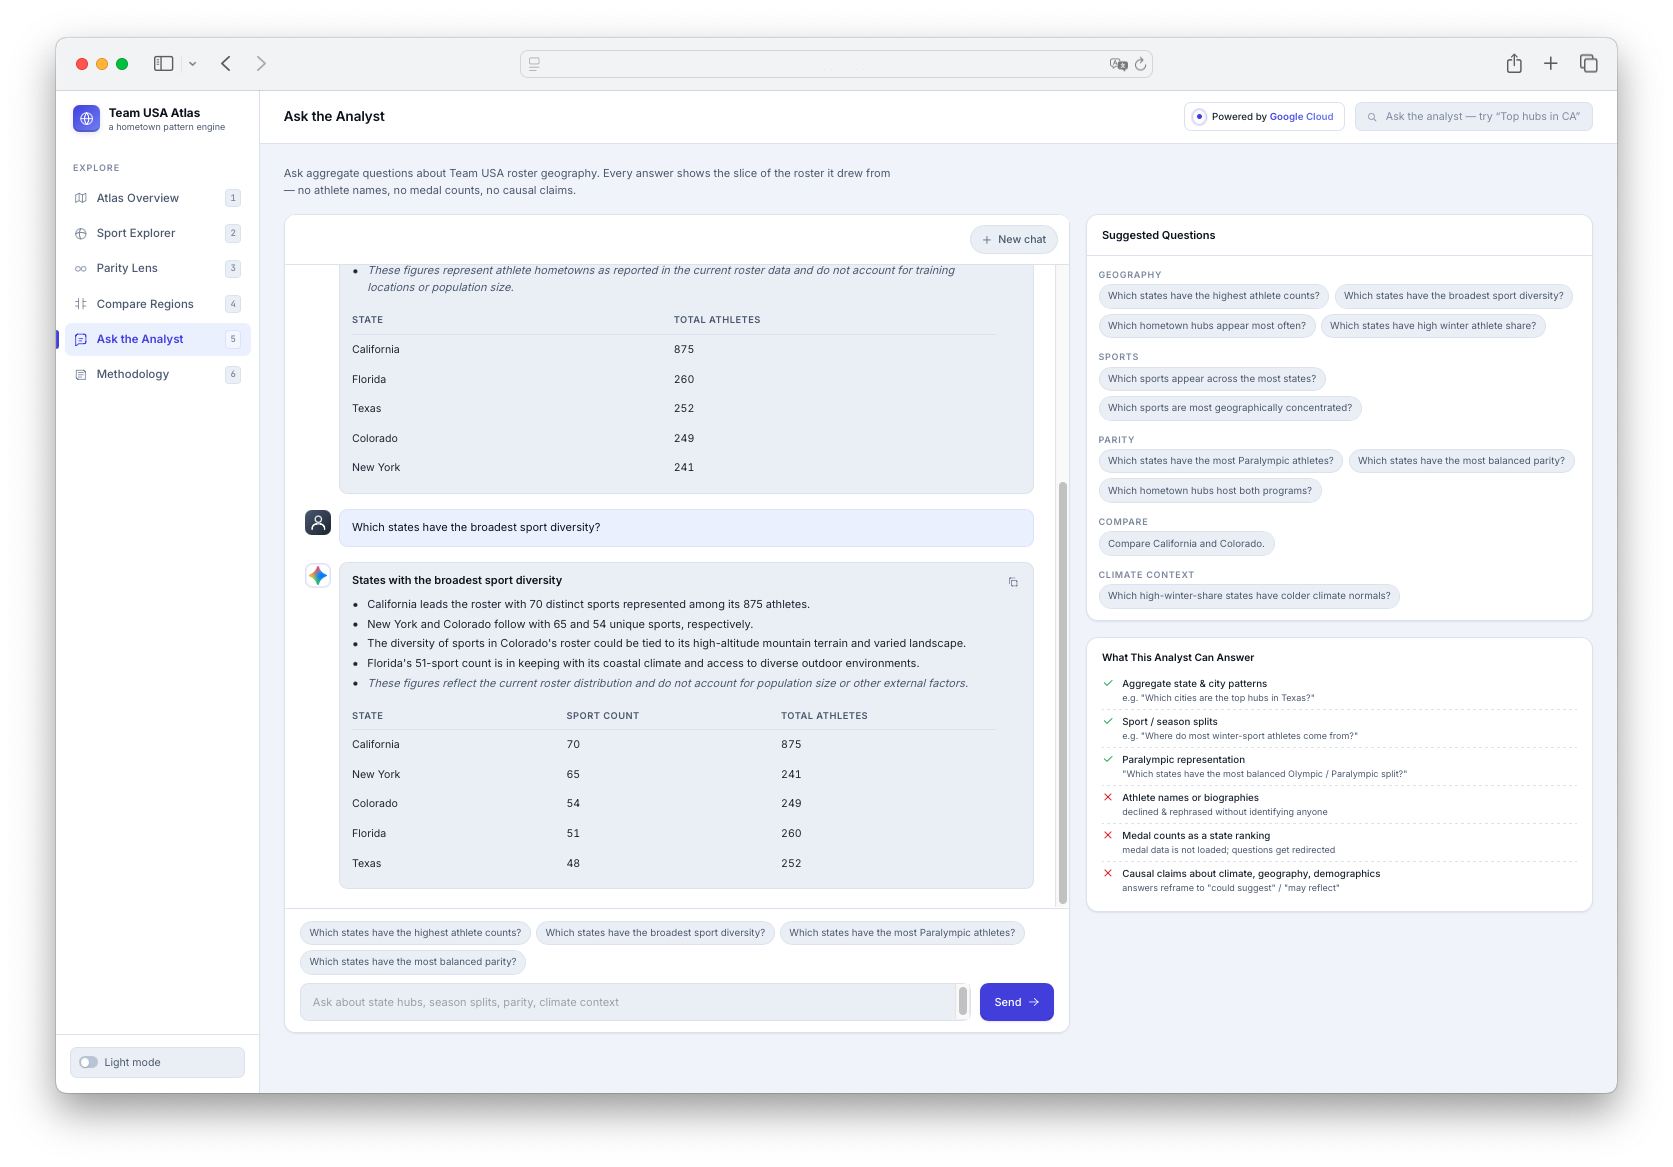
The app has six main views: an Atlas Overview with a U.S. choropleth map and hometown bubbles; a Sport Explorer for sport-specific geographic footprints; a dedicated Parity Lens for Olympic and Paralympic representation; a Compare Regions page for side-by-side state comparisons; an Ask the Analyst chat interface for grounded questions; and a Methodology page explaining data sources, count logic, Gemini usage, evidence, limitations, and responsible AI guardrails.
Every number is computed from local aggregate JSON data, and every Ask answer includes an Evidence Used block showing the underlying file, columns, and row count. The product intentionally avoids athlete names, images, biographies, medals, finish times, scores, predictions, per-capita rankings, and causal claims.
How we built it
Team USA Atlas is built as a single-page web app using HTML, CSS, vanilla JavaScript modules, Node.js, and Express. The frontend loads nine read-only JSON files at runtime and computes maps, KPIs, filters, ranked lists, comparisons, and evidence blocks directly in the browser.
The data layer is produced by a deterministic Python ETL (Extract, Transform, Load) pipeline. The scripts clean and transform public Team USA roster data, Team USA athlete/sport participation data, NOAA 1991–2020 climate normals, GeoNames hometown data, and public U.S. map data into the JSON files used by the app. The ETL is designed to be reproducible and avoids hand-curated lists or LLM-generated coordinates.
Gemini is integrated through a server-side Express proxy using the @google/genai SDK. The browser first computes deterministic aggregate facts, then sends compact context to the server, where Gemini generates short structured narrative insights. The server enforces JSON schemas, validates response shape, scans for banned phrases, and falls back to deterministic local writing if Gemini is unavailable or returns unsafe wording.
The production app is deployed on Google Cloud Run as a Node.js Express service. Google Cloud Build builds the service from source, Cloud Run hosts both the static app and Gemini proxy, and the Gemini API key is stored server-side as an environment variable so it is never exposed to the browser.
Challenges we ran into
The hardest challenge was balancing insight with responsibility. It is easy for a sports analytics app to drift into rankings, predictions, or causal claims, but this project needed to stay descriptive. I had to design the product, copy, filters, Ask responses, and Gemini prompts around careful language like “could reflect,” “is consistent with,” and “appears in the current roster snapshot,” rather than implying that a state, climate, or hometown produces better athletes.
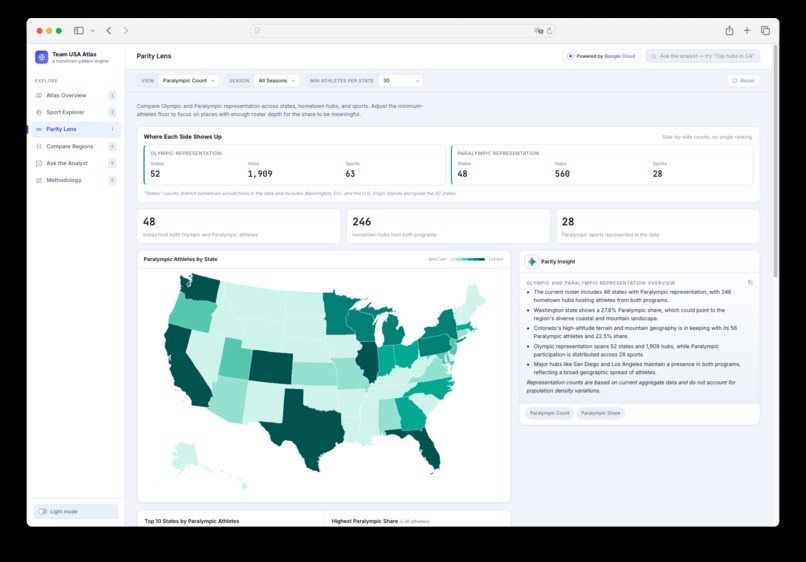
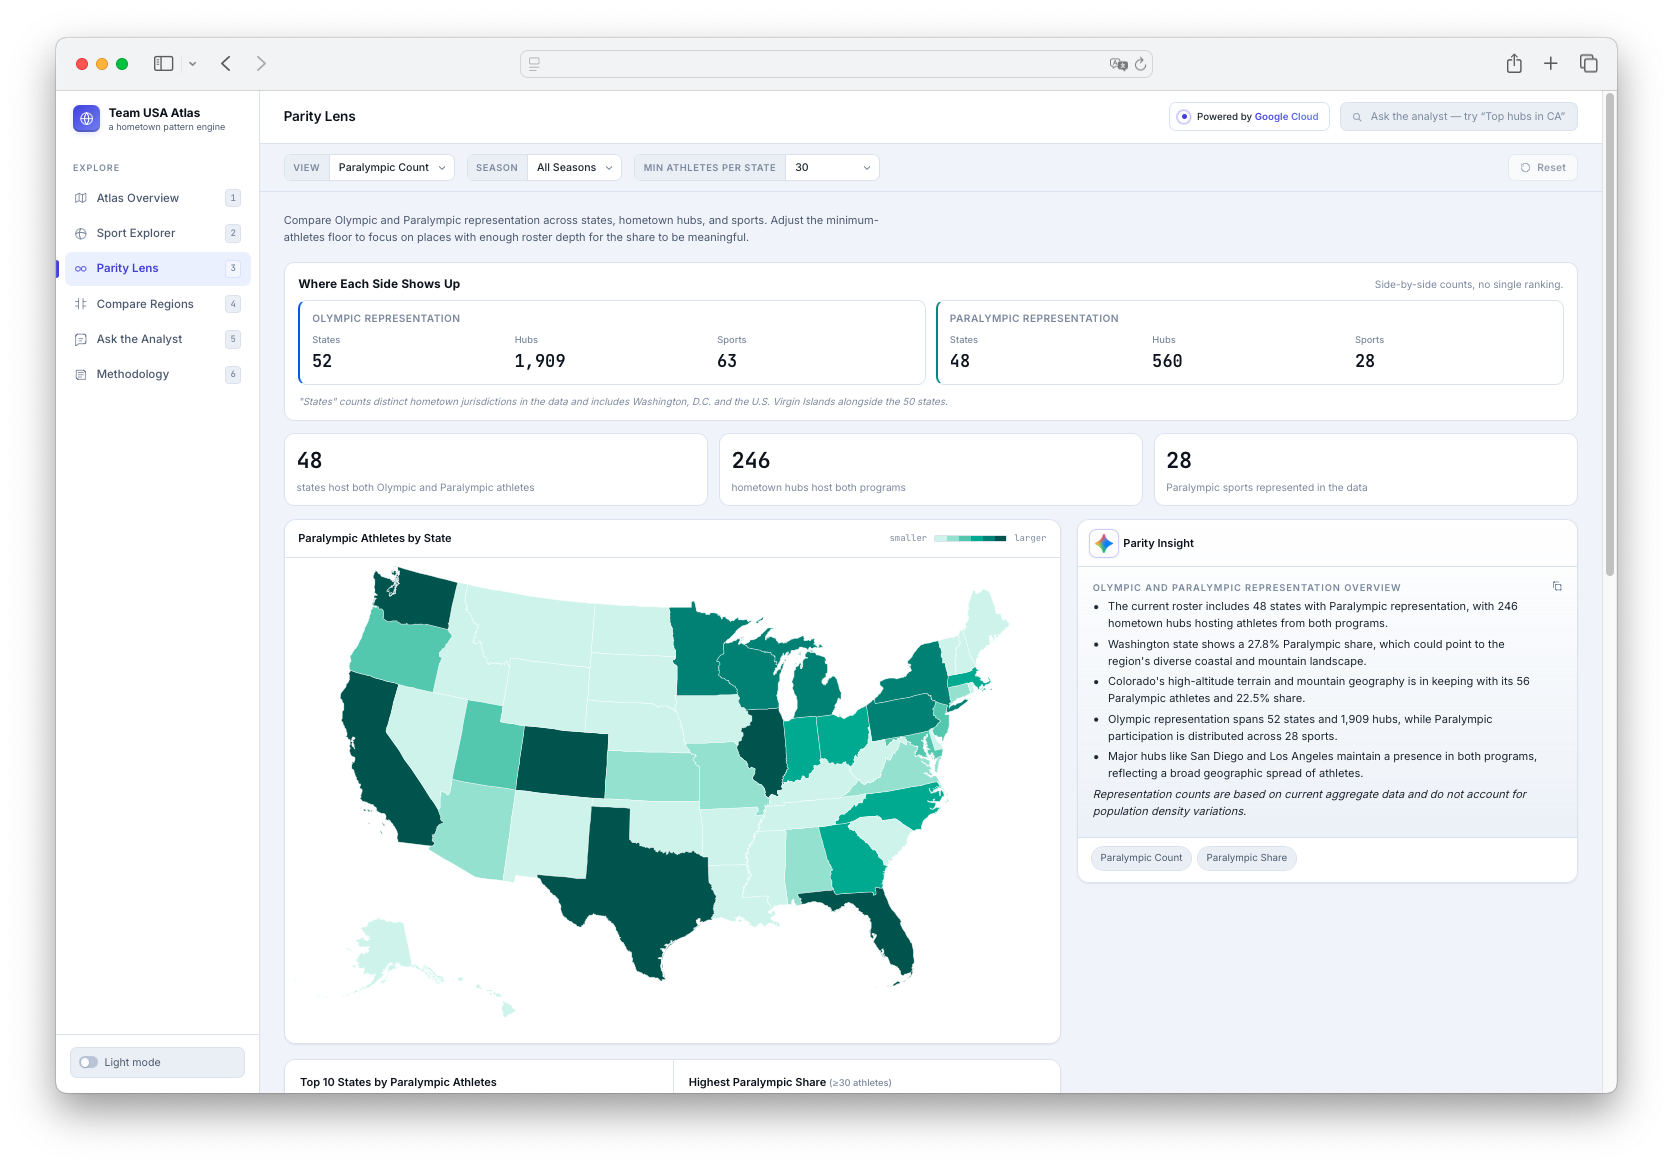
Another major challenge was Olympic and Paralympic parity. I did not want Paralympic representation to feel like a small filter hidden inside an Olympic-focused product, so the app includes a dedicated Parity Lens, equal-frame KPI cards, Paralympic sport footprint views, and guardrails requiring Olympic and Paralympic data to be treated with the same analytical depth.
The technical challenge was making Gemini useful without letting it control the facts. The solution was to separate the deterministic analytical core from the generative writing layer: the app computes all numbers first, then Gemini only turns compact, verified facts into short prose. I also had to build schema validation, banned-phrase checks, fallback logic, and evidence blocks so the experience remained reliable even under API errors or latency.
Accomplishments that we're proud of
I’m proud that Team USA Atlas is a complete working product rather than just a mockup. It includes a deployed Cloud Run app, a reproducible Python ETL pipeline, six interactive views, a Gemini-backed analyst layer, a sourced Ask interface, URL-state navigation, light/dark mode, map interactions, comparison tools, climate mini-charts, and responsible AI documentation.
I’m especially proud of the “pattern, not prediction” system. The app does not just say it is responsible; the guardrails are built into the UI, data model, prompts, validation layer, Ask classifier, banned-phrase scanner, and Methodology page. If a user asks for unsafe or unsupported analysis, the app either rephrases the question into a safer aggregate version or declines it.
I’m also proud that Paralympic representation is treated as a first-class part of the product. The Parity Lens, Olympic/Paralympic split bars, dual-program hub views, and equal-frame copy make the product more inclusive and better aligned with the spirit of Team USA as a collective story.
What we learned
I learned that responsible AI products work best when the model is not asked to invent the analysis. In Team USA Atlas, Gemini is most effective as a narrative layer over app-authored facts: it helps make aggregate patterns easier to understand, but the actual counts, filters, comparisons, evidence, and safety rules come from deterministic code.
I also learned how important product framing is in data storytelling. The same data can feel very different depending on whether the product says “best states,” “talent pipeline,” or “hometown patterns.” Small wording choices can change whether an insight feels inclusive and descriptive or overly causal and competitive.
Finally, I learned a lot about deploying a real AI app on Google Cloud under deadline pressure. Cloud Run made it possible to host the frontend and server-side Gemini proxy together, while keeping the API key private and the runtime close to local development.
What's next for Team USA Atlas
The next step for Team USA Atlas would be to expand the range of responsible public-data storytelling while keeping the same guardrails. Future versions could add richer historical snapshots, clearer timeline comparisons, deeper Paralympic classification context, and more accessibility polish.
I would also like to improve the Ask the Analyst experience with multi-turn follow-ups, richer evidence cards, better explanation of uncertainty, and more guided question paths for fans who do not know what to ask. Another future direction is to add more transparent data provenance and exportable insight summaries for journalists, educators, and fans who want to share aggregate findings responsibly.
Most importantly, future versions should preserve the core principle: Team USA Atlas should remain a tool for exploring patterns, not predicting outcomes or ranking people. The goal is to help fans see the collective geography of Team USA in a sourced, inclusive, and responsible way.

Log in or sign up for Devpost to join the conversation.