-
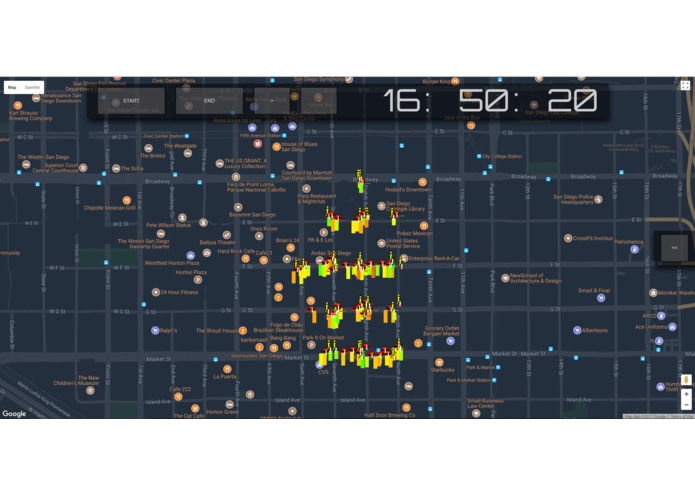
Screenshot of Simulation

Colored Bars and Toy Cars
Authors
SDHACKS 2017 Project by Matt Chan and Edward Chen
About
We used AT&T's smart city API to create a data visualization platform where pedestrians and drivers can be better informed of their surrounding city. We also wanted to create an automated response system using Twilio's API to provide live updates of traffic and pedestrian conditions. To best demonstrate this, we created a couple simulations on Google Maps with custom markers and animated graphs.
Some key features we have:
- Recent live data of past and current traffic conditions
- Recent live data of pedestrian crossings
- Animated simulation over designated period of time
- Custom markers on Google Maps for efficient data visualization
- Automated text message notifications and two way responses
Inspirations
My personal inspiration came from watching an AT&T advertisement against Texting and Driving. From this we decided to check out AT&T API at SDHACKS2017 and thought the Smart City functionality could serve as a detector for helping drive safer and more efficiently. We also thought of using Twilio API to create an automated voice to text system to keep live updates on potential accident sites with either heavy traffic or pedestrians.
We also noticed that AT&T's Smart Cities is not widely used and we hope this visual demonstration can display many of its potential uses across all cities.
How It Works
Press play
Built With
- AT&T Smart City API
- Twilio API
- Google Maps API
- Node.js
- Javascript
- JQuery
- Underscore
- Jade
- HTML
- CSS
- Postman
- Git
- 6 1/2 hours of sleep
- 6 1/2 hours of reading API's


Log in or sign up for Devpost to join the conversation.