-
-
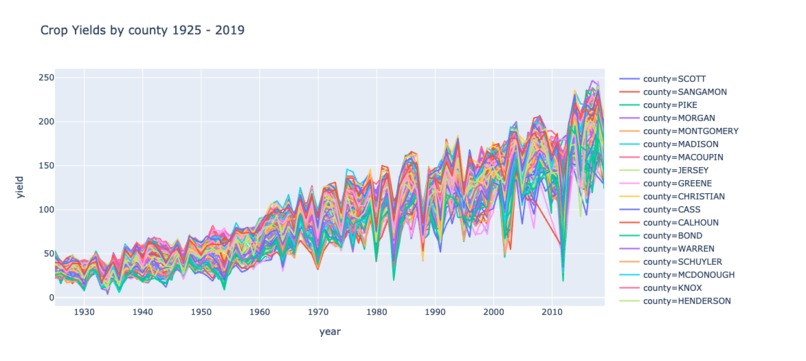
Visualising Crop Yields, by county and time
-
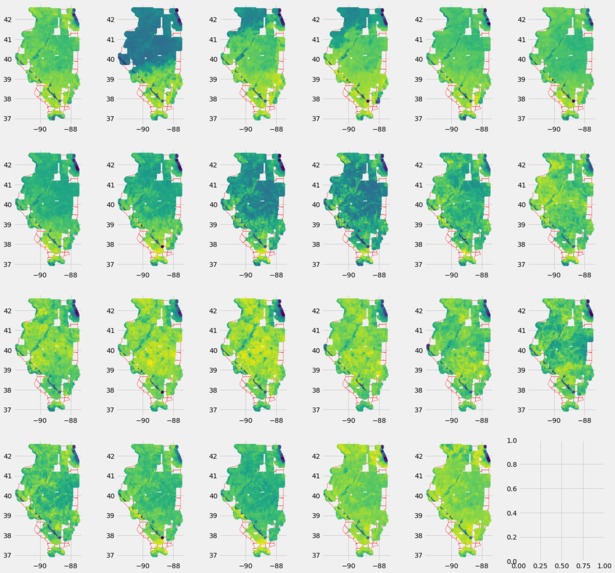
Visualising EVI readings
-
 GIF
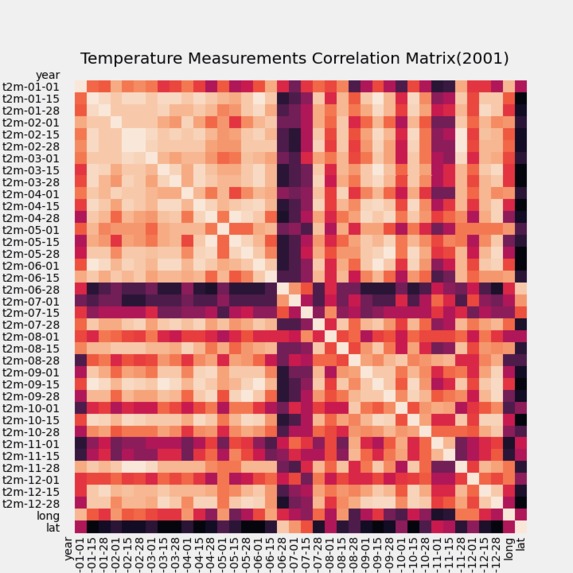
Visualising the time-varying correlation beween the temperature measurements (across all counties)
-
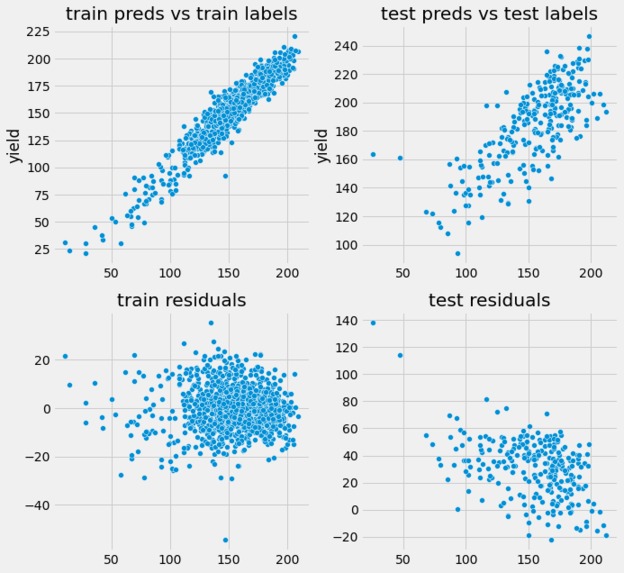
Regression diagnostics - OLS residuals
-
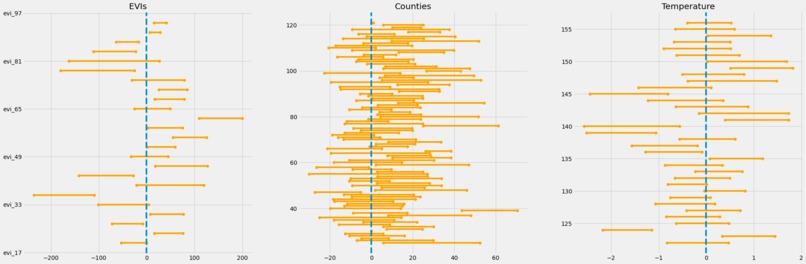
Regression diagnostics - Confidence intervals
-
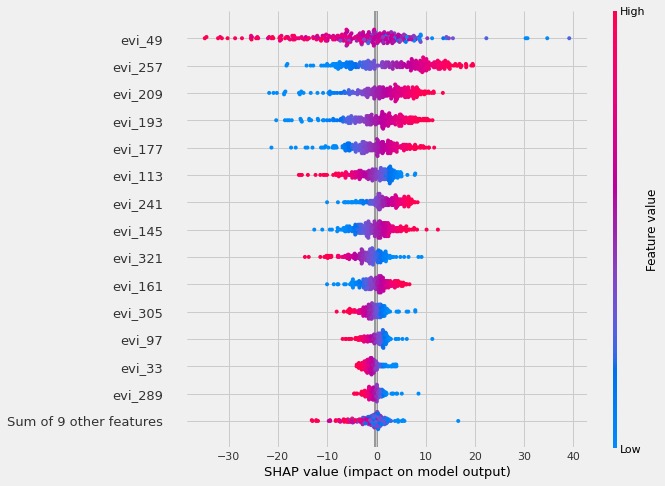
Shapley Values - Gaussian Process Regression
-


If our video link is still Rick Astley at 14:00 GMT, we ran out of time to make the video submission (sorry). Our Colab Notebook report, modelling, and visualisations are really good though!
Project Structure
Data Visualisation
Beautiful data visualisations using matplotlib / seaborn / plotly and setting the "fivethirtyeight" style
Modelling
- Looked at using linear regession (selecting different feature subsets, regularisation : Lasso / Ridge), to directly predict crop yields
- Tried non-linear models: Kernel SVMs, Trees (LGBM, XGBoost), and finally Gaussian Processes. Gaussian Process Regression best performer both in and out-of-sample, but out-of-sample performance is much lower.
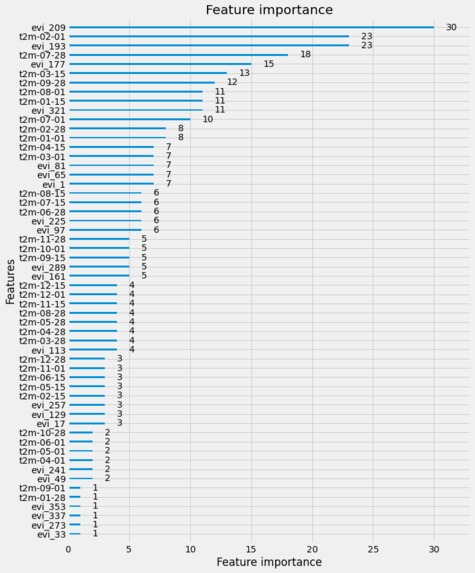
- We focus on model interpretability as well; for linear models this is clear (coefficients, confidence intervals), for non-linear models, we turn to feature importances and
shap - Looked at the problem again - instead of predicting crop yields, try and predict change in crop yields $\Delta y_{i, t}$
- Repeated step 1 and 2. Gaussian Process still best performer in this version of the problem.
Evaluation
- GPRs are arguably the most robust method we explored; are known from the literature to be able to capture spatiotemporal features. However out-of-sample prediction still fairly poor.
- Model validation could be more robust, e.g. use walk-forward evaluation - train on 2001 - 2014 evaluate on 2015, train on 2000 - 2015, evaluate on 2016 etc.
- Could benefit from looking at other models that might better incorporate spatio-temporal structure - RNNs/CNNS, Spatial Regression techniques
*the uploaded .html report is just the Colab Notebook exported to html via nbconvert

Log in or sign up for Devpost to join the conversation.