-
-
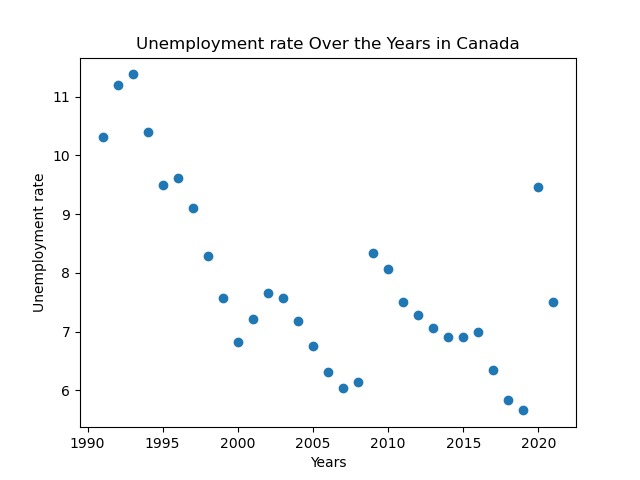
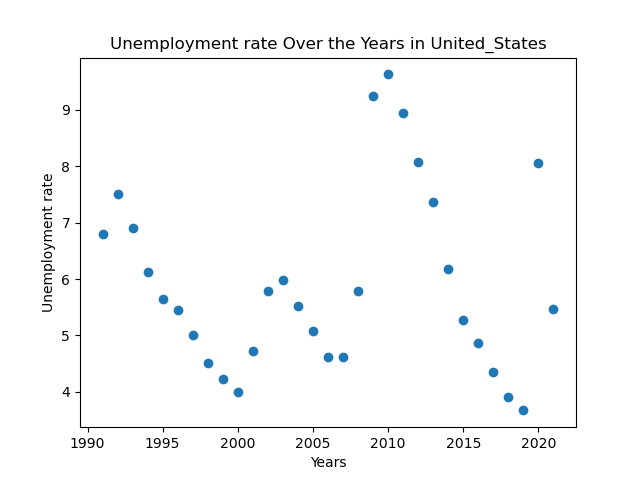
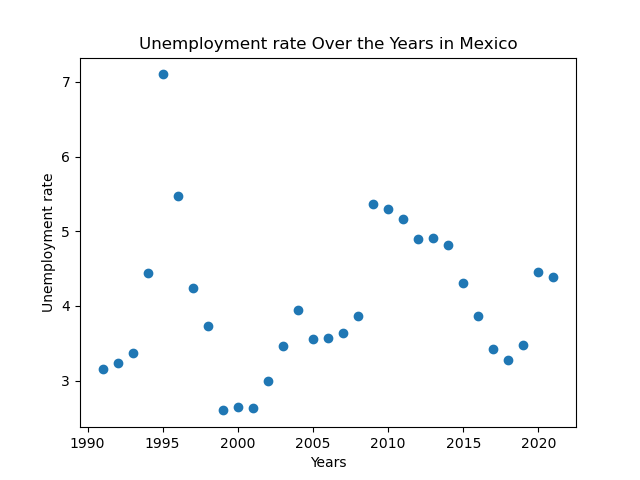
terminal-based (analysis on one country)
-
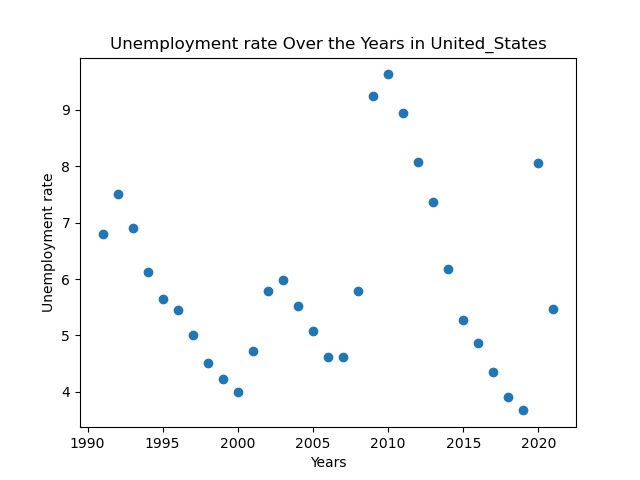
terminal-based (analysis on one country)
-

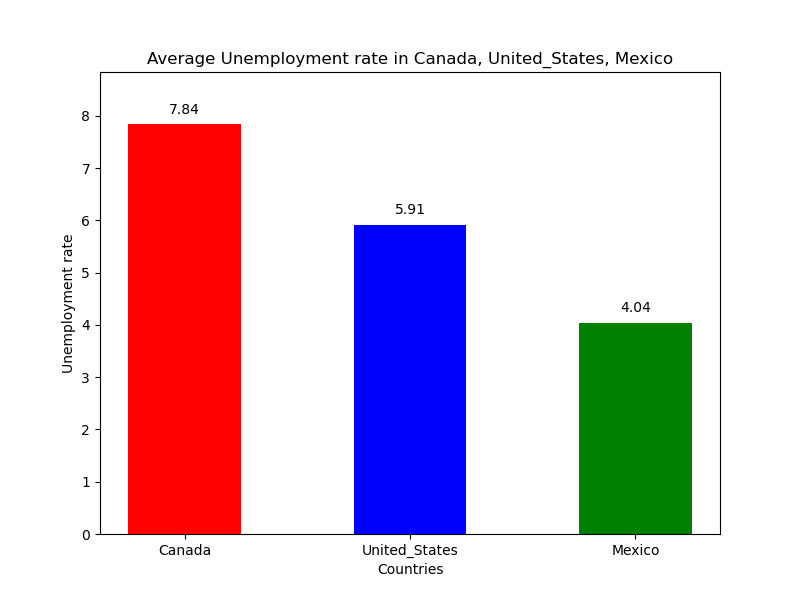
terminal-based (comparison between countries)
-
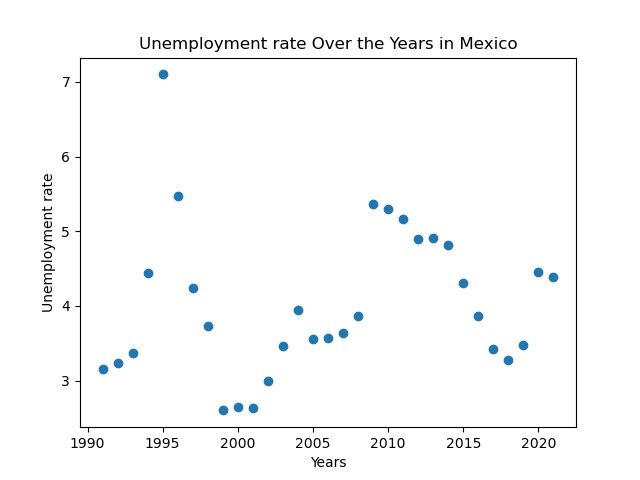
terminal-based (analysis on one country)
-
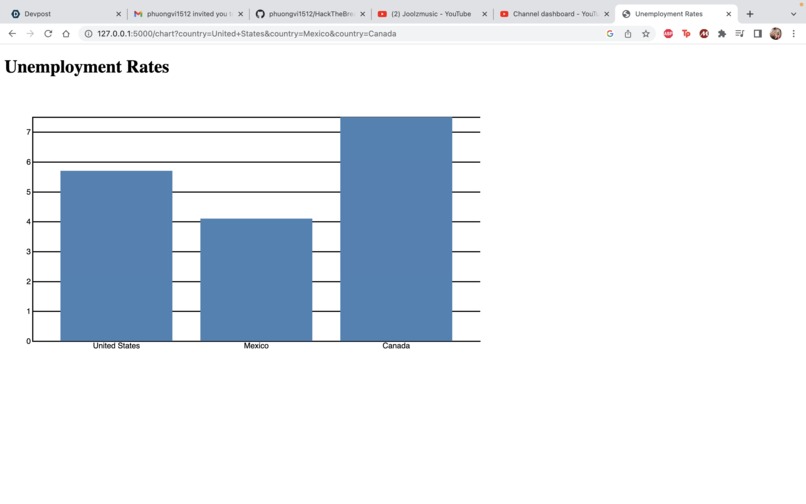
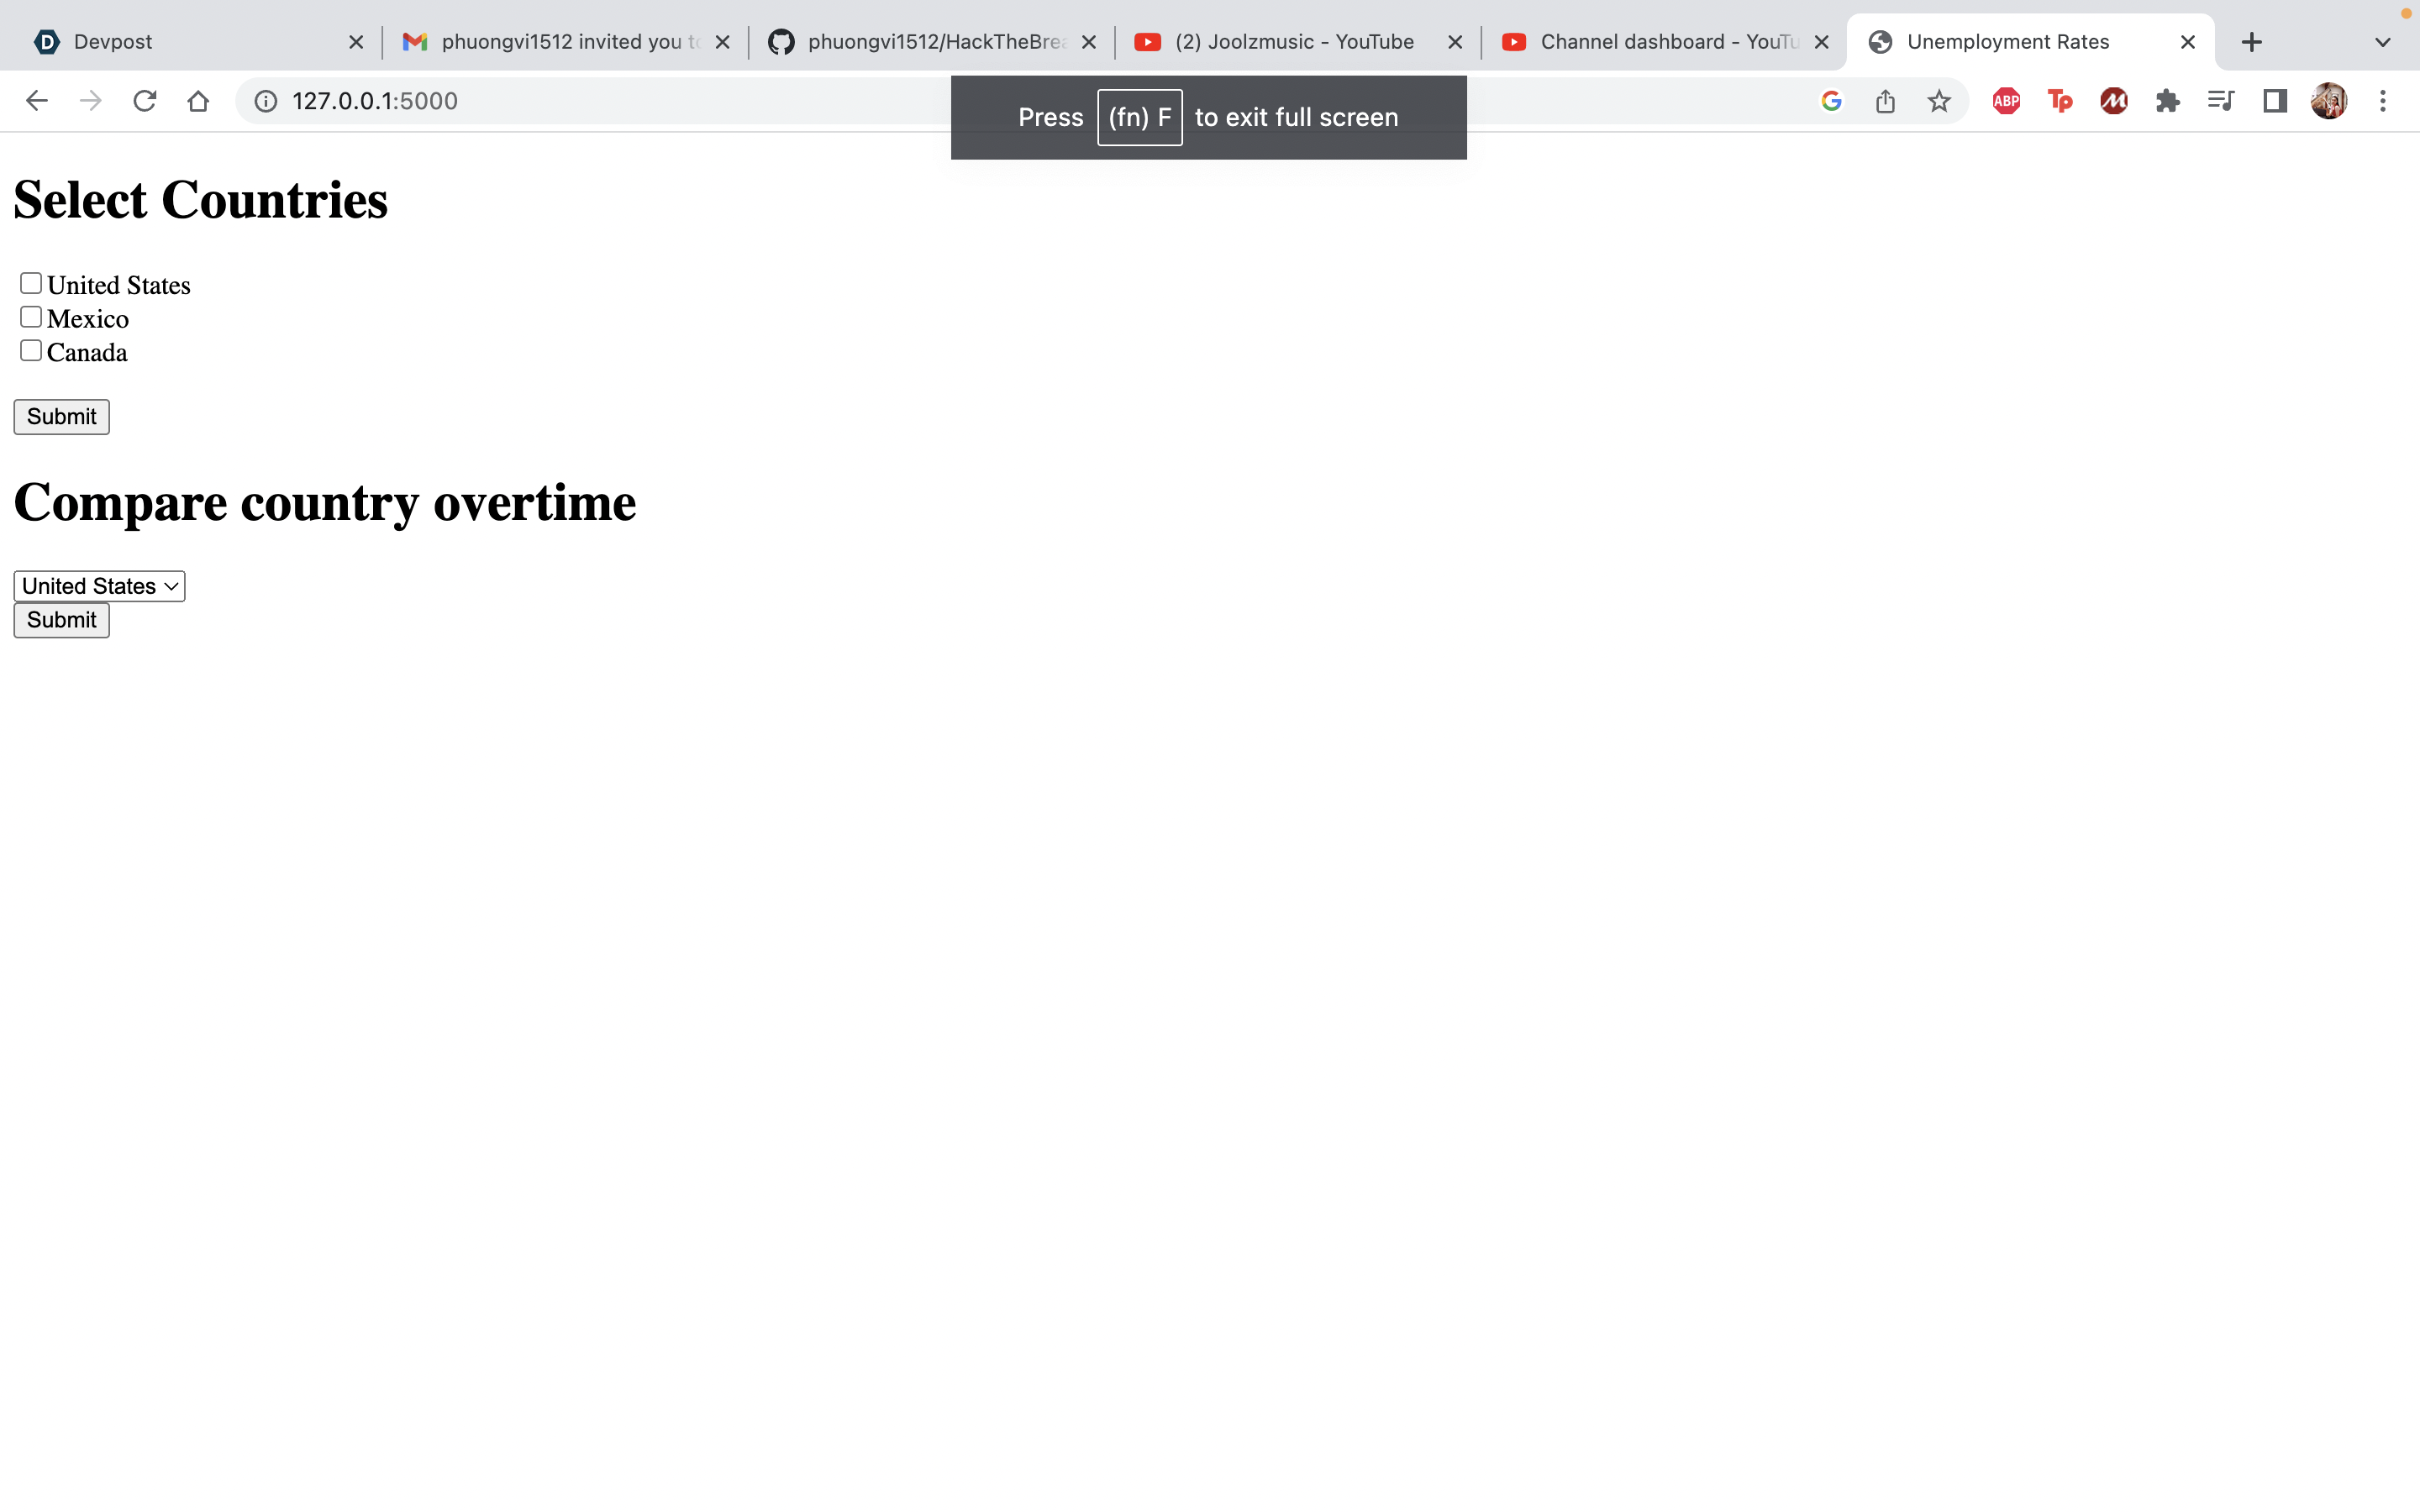
Web-based (comparison between countries)
-

Web-based
-
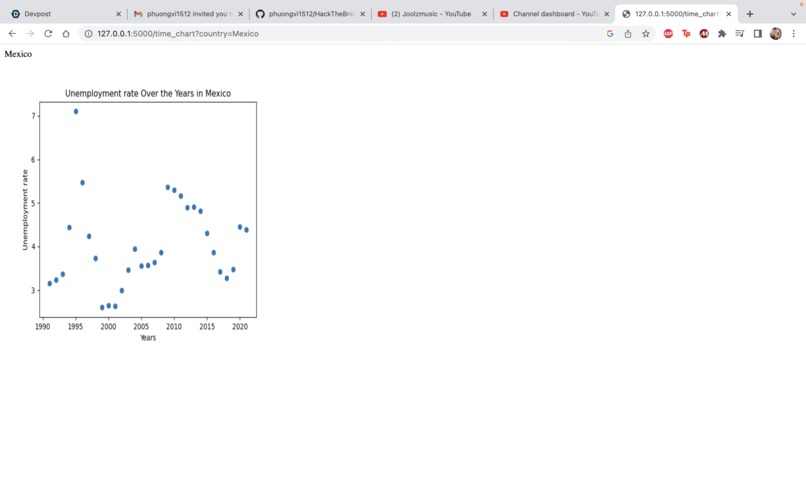
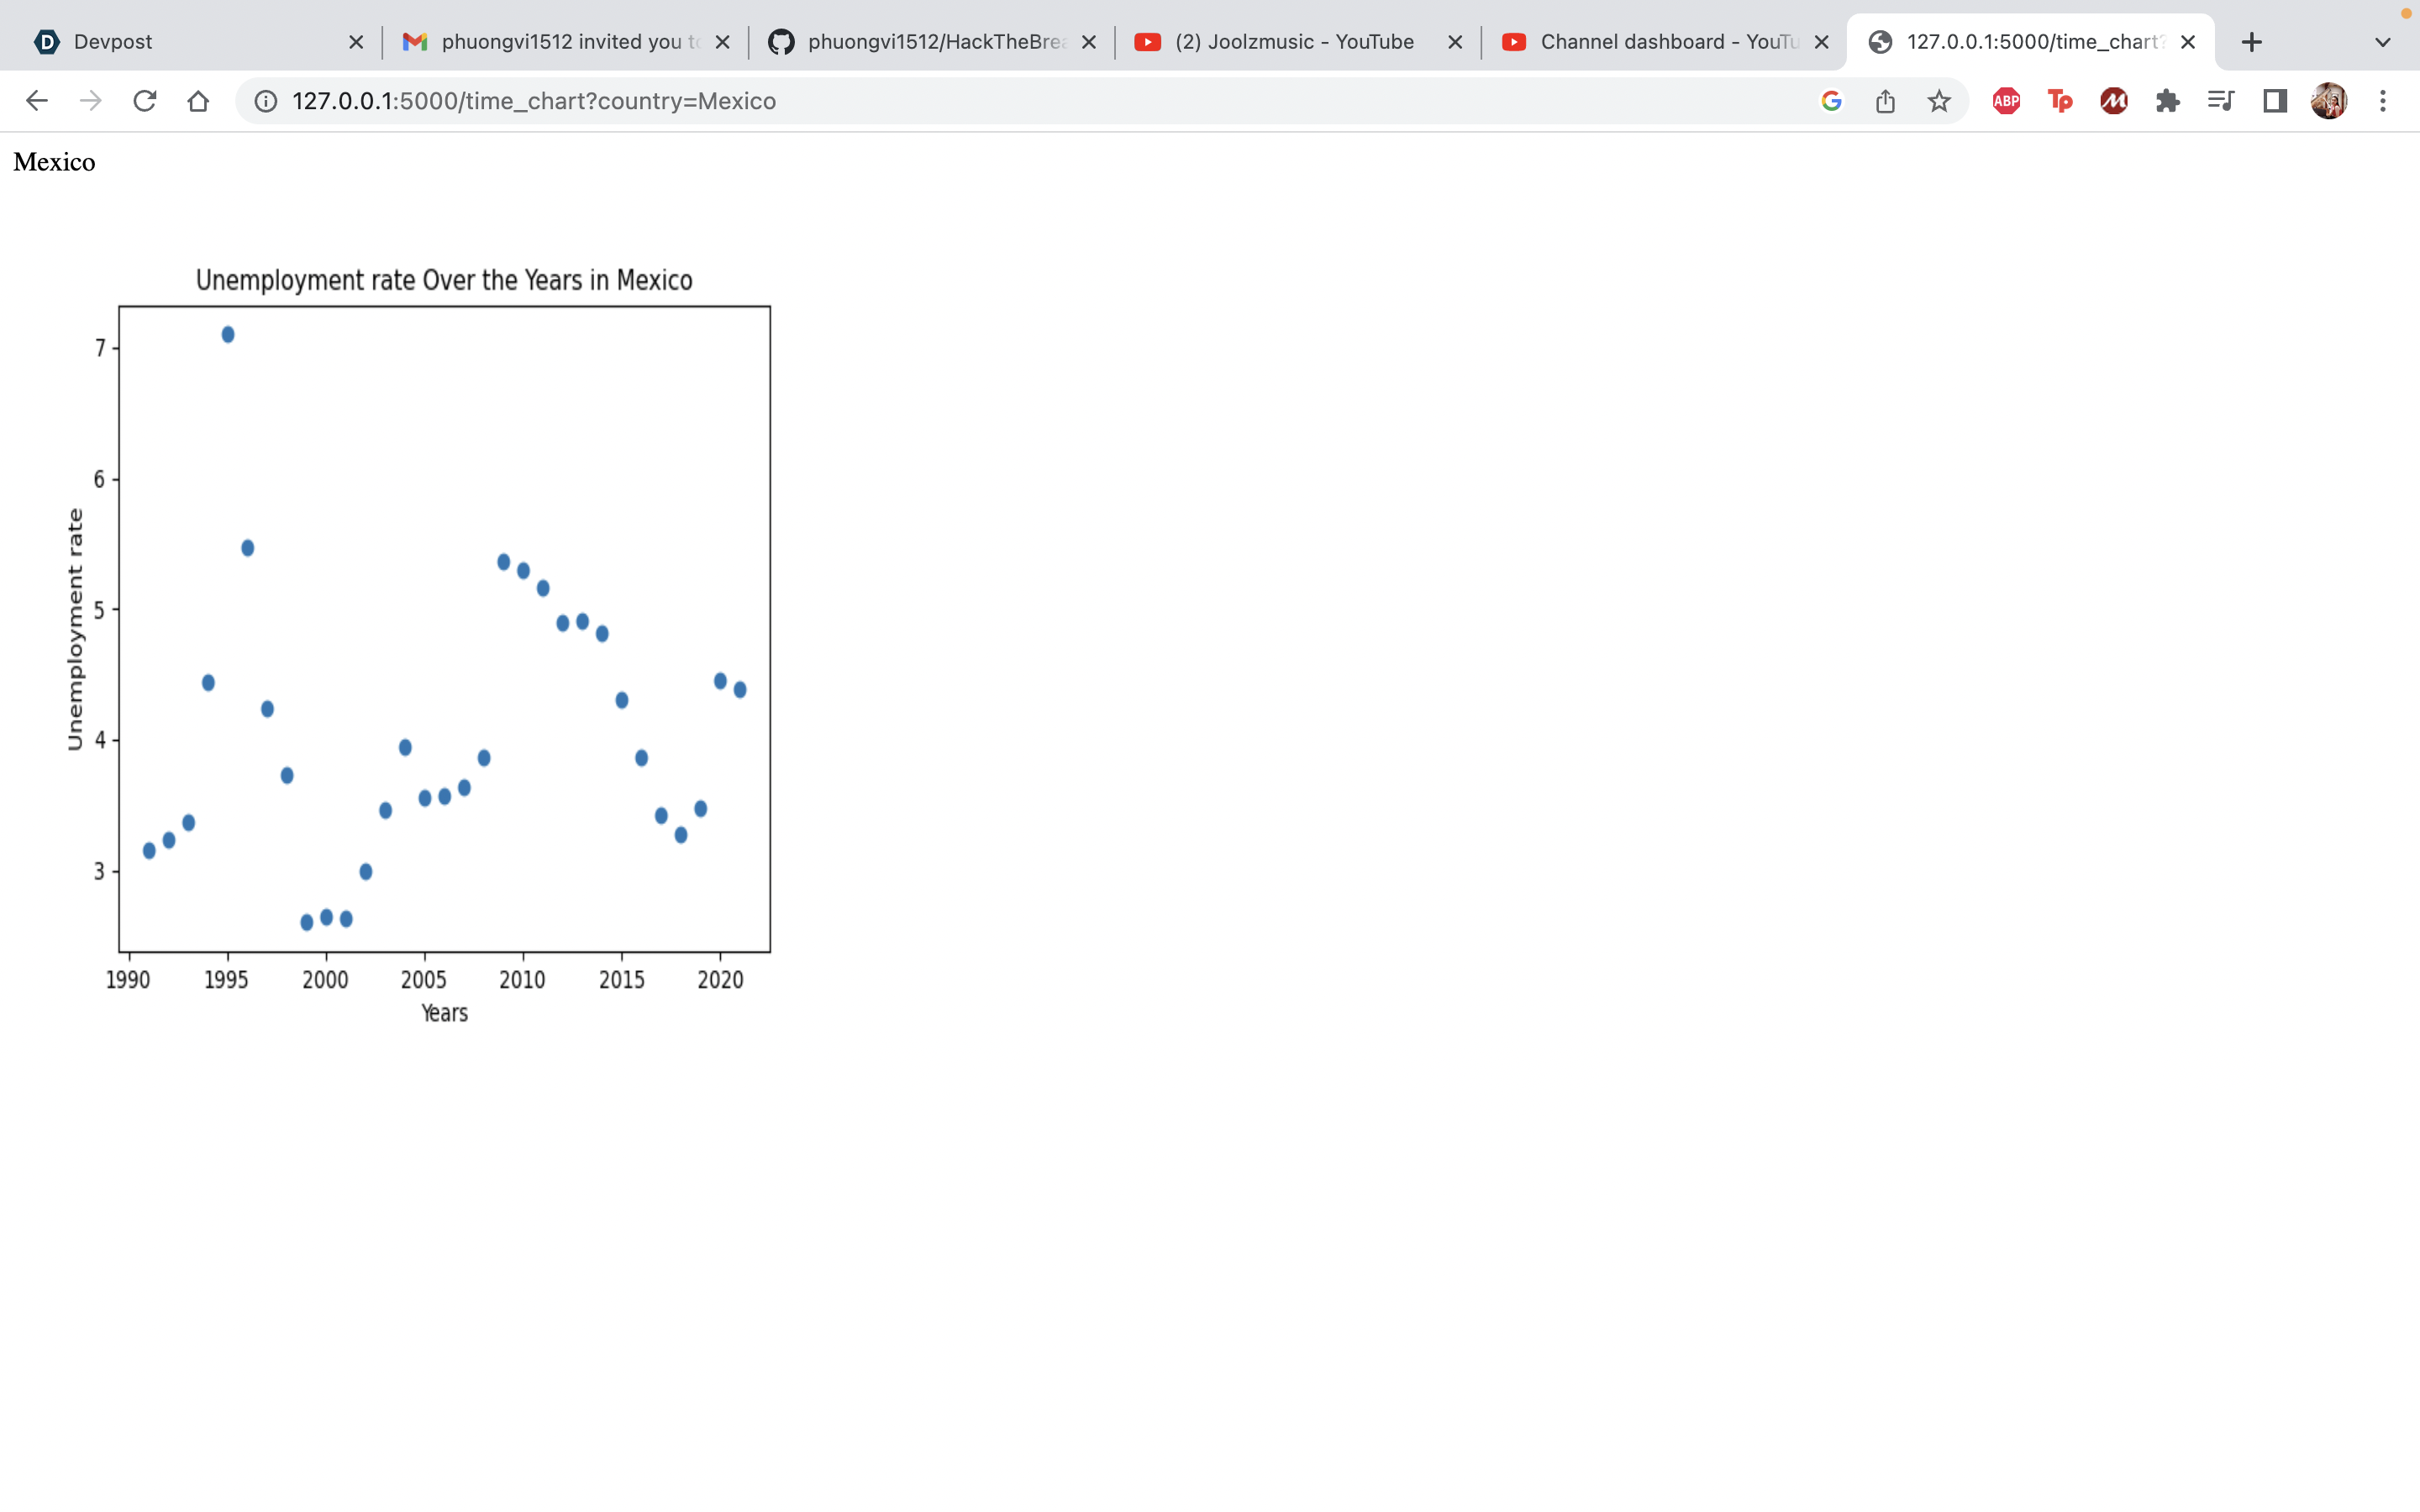
Web-based (for a specific country)


Inspiration: compare unemployment rate between countries or over the time
Authors: Julie Wu, Phuong Vi Dang
Description: we want to show the countries' unemployment rate over the time or compare different countries' unemployment rate. If user wants to move to new country, they have better idea of the job market of different countries
Acknowledgment: the data we collected is from Kaggle. We did a lot of googling/online resources to learn the programming languages/tools to create our project
Technology we used: Python libraries: Panda, matplotlib, flask JS: D3Query
What we have developed:
- terminal: more interactive. Most appealing it could be. To check, you can run test.py
- web GUI: We want to implement what we have done in the terminal into the Web GUI. The UI is simple so far. you can run webapp.py.
Process:
We started with the terminal (giving users options to select an analysis of the unemployment rate over the years for a specific country or to compare different countries). The terminal is very user-interactive and can display scatter diagrams and a side-to-side bar chart.
We were really happy with the terminal, but we wanted to expand it so that it looks more appealing (like a website). We used our remaining hours to learn about UI/UX + javascript and managed to create a website that acts very similarly to the terminal we created.
Even though the website it not the most appealing (quite simple), we now have learned where we could improve on. We wouldn't have gone this far had we not completed the terminal project.
Built With
- d3query
- flask
- html
- javascript
- matplotlib
- panda
- python


Log in or sign up for Devpost to join the conversation.