-
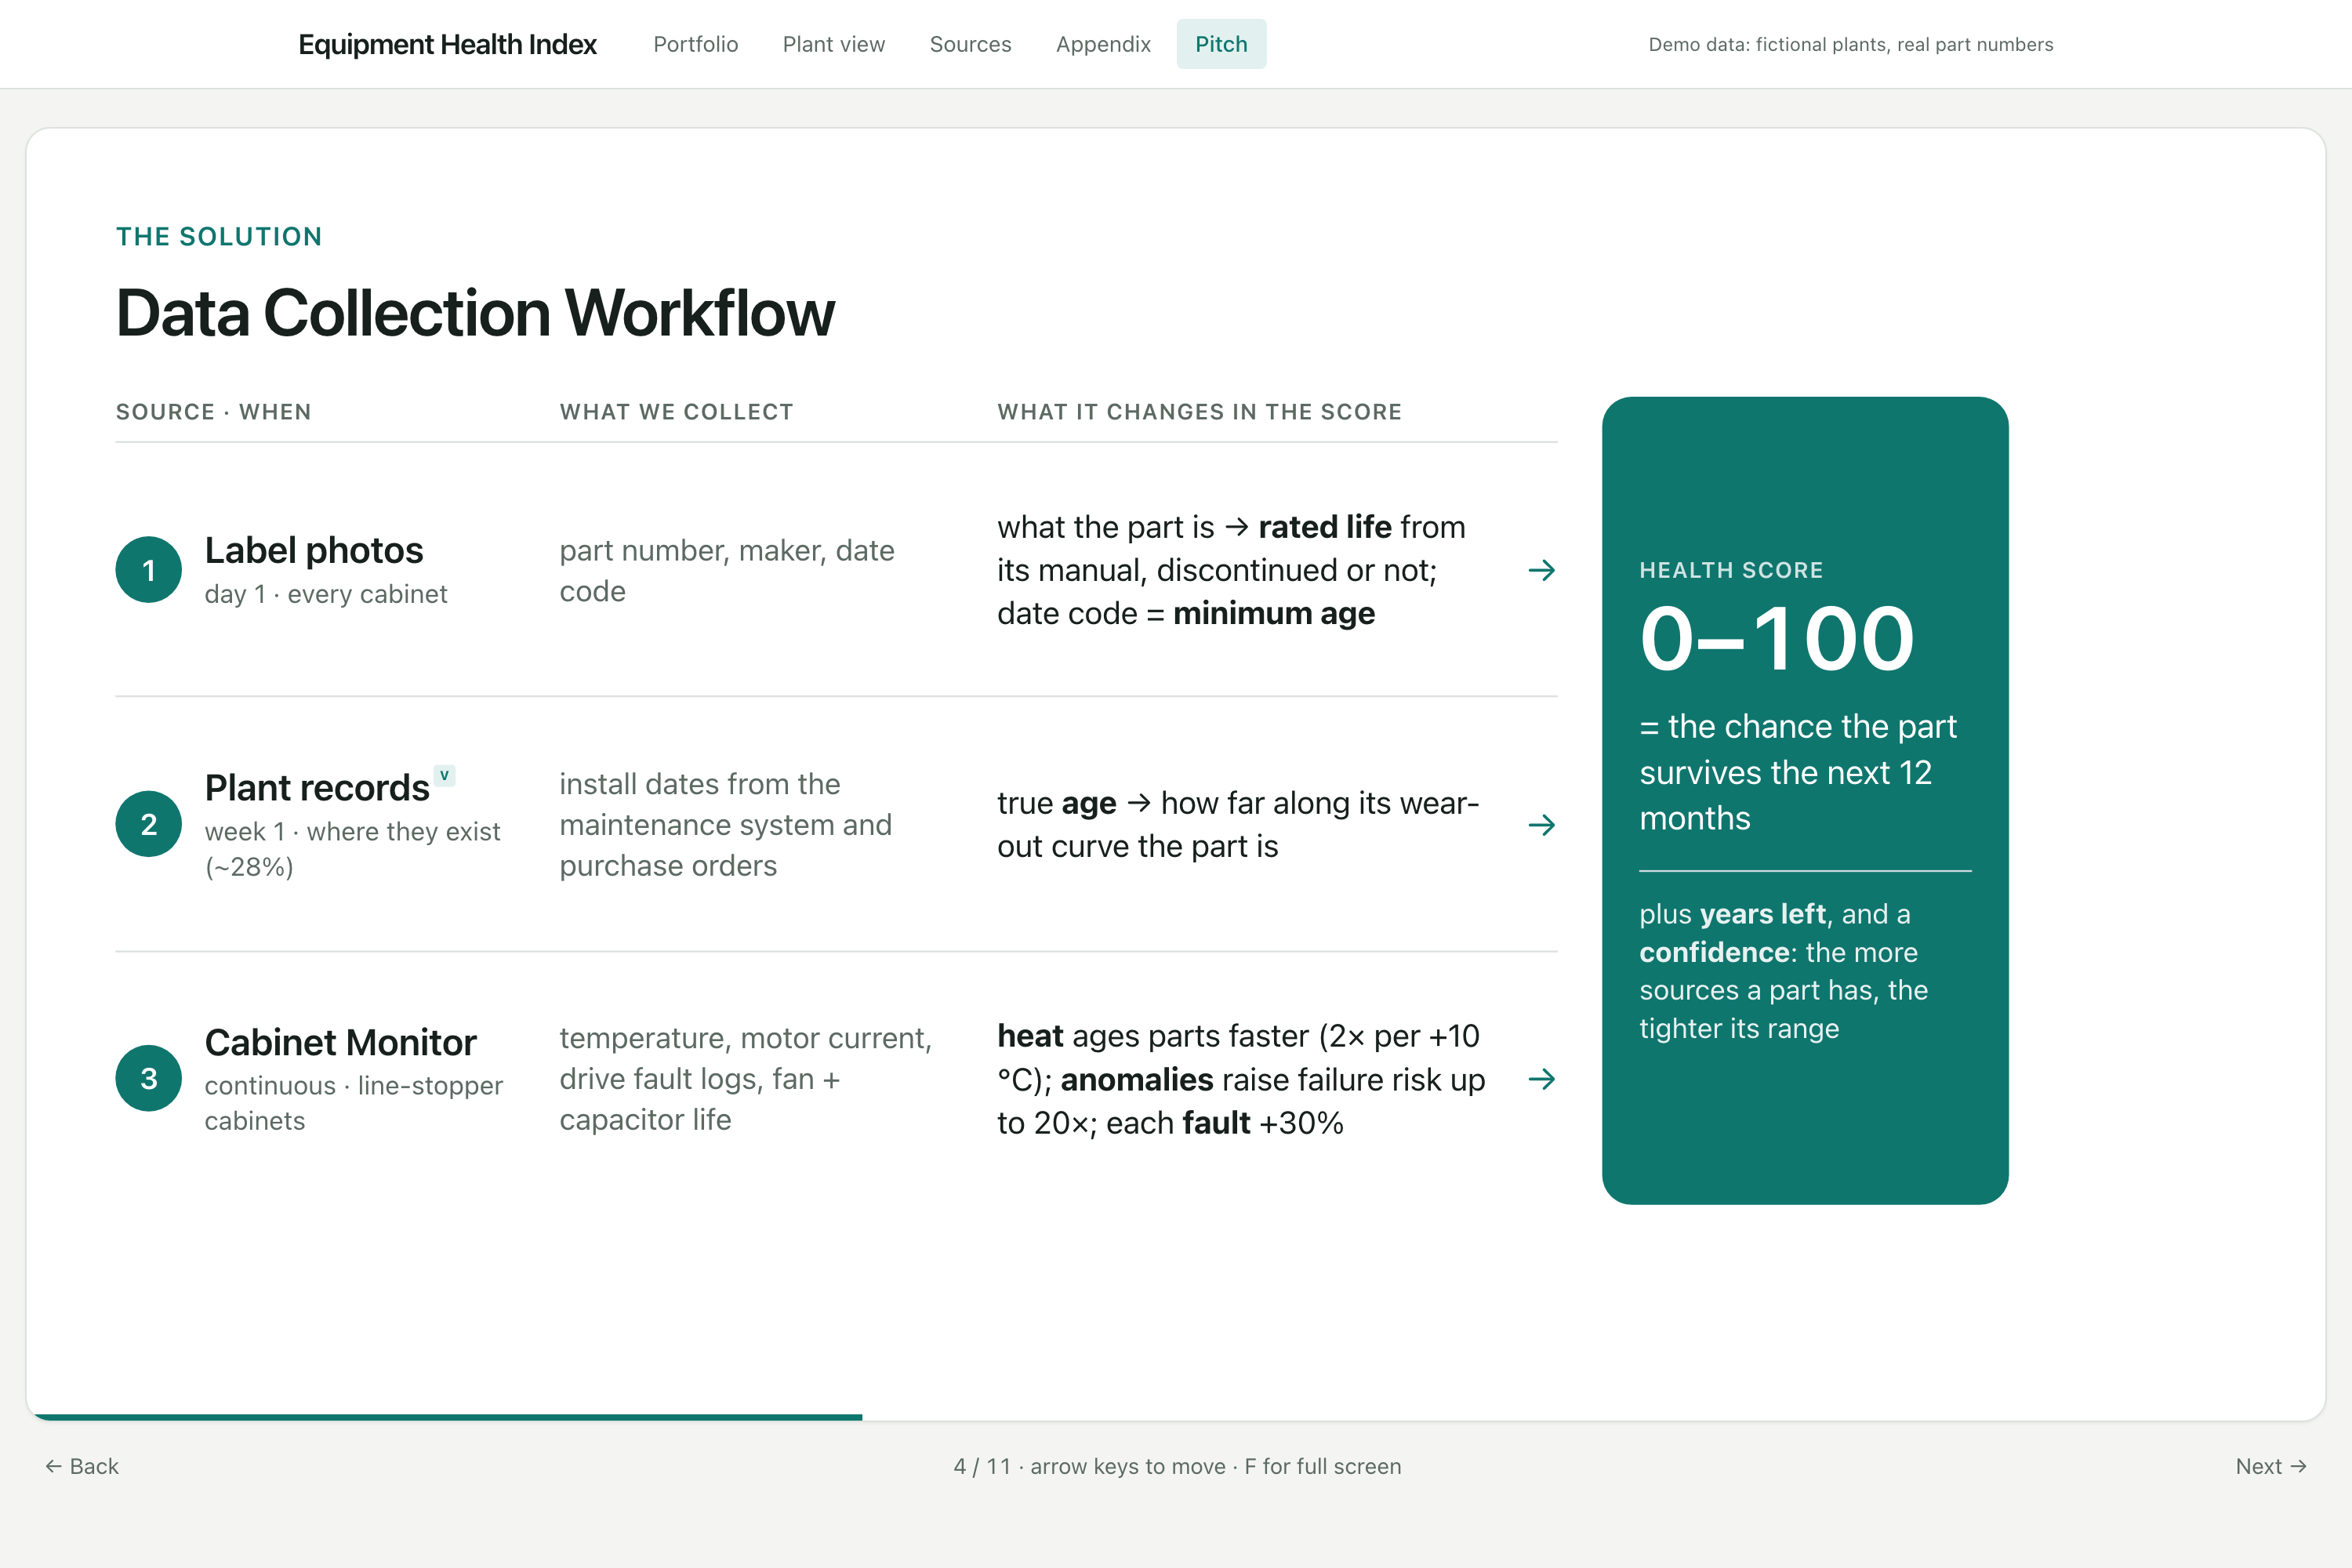
Data Workflow
-
The Problem
-
Hardware Diagram
-
Toledo Plant
-
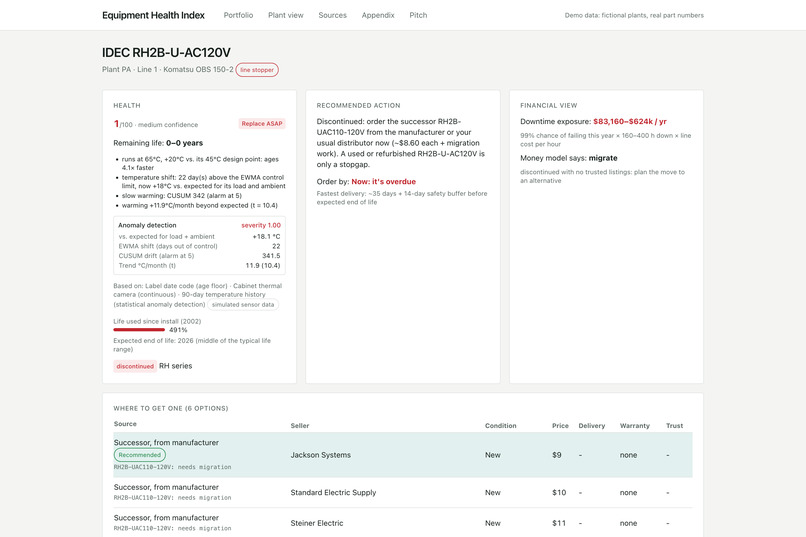
Relay
-
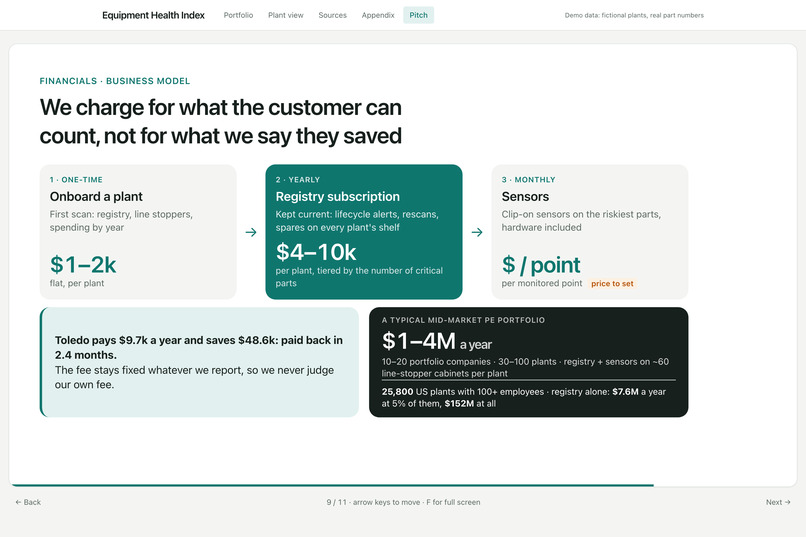
Business Model
-
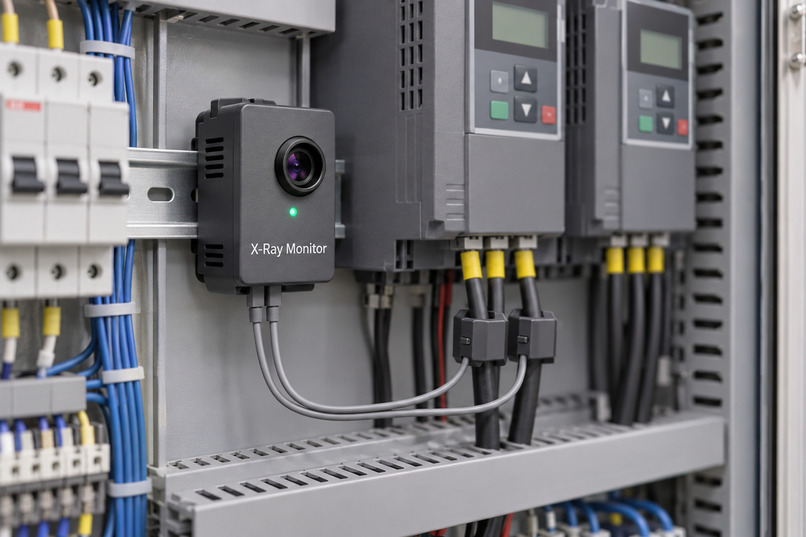
Cabinet Monitor
Inspiration
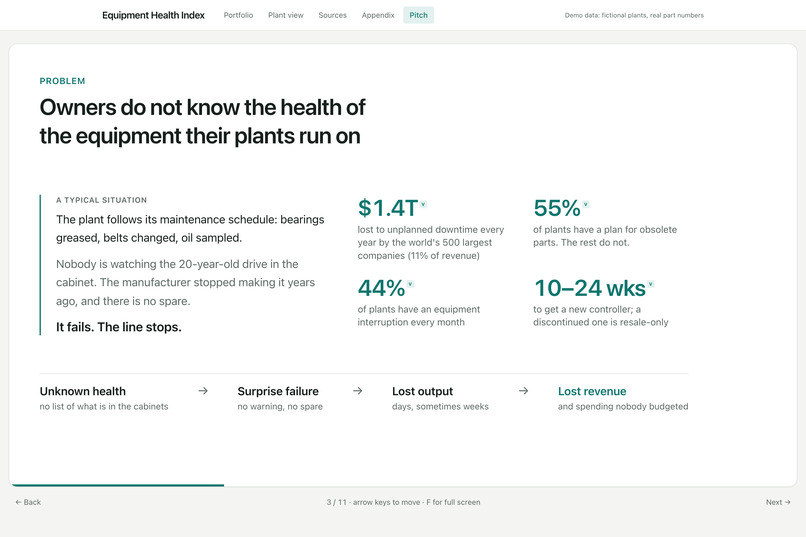
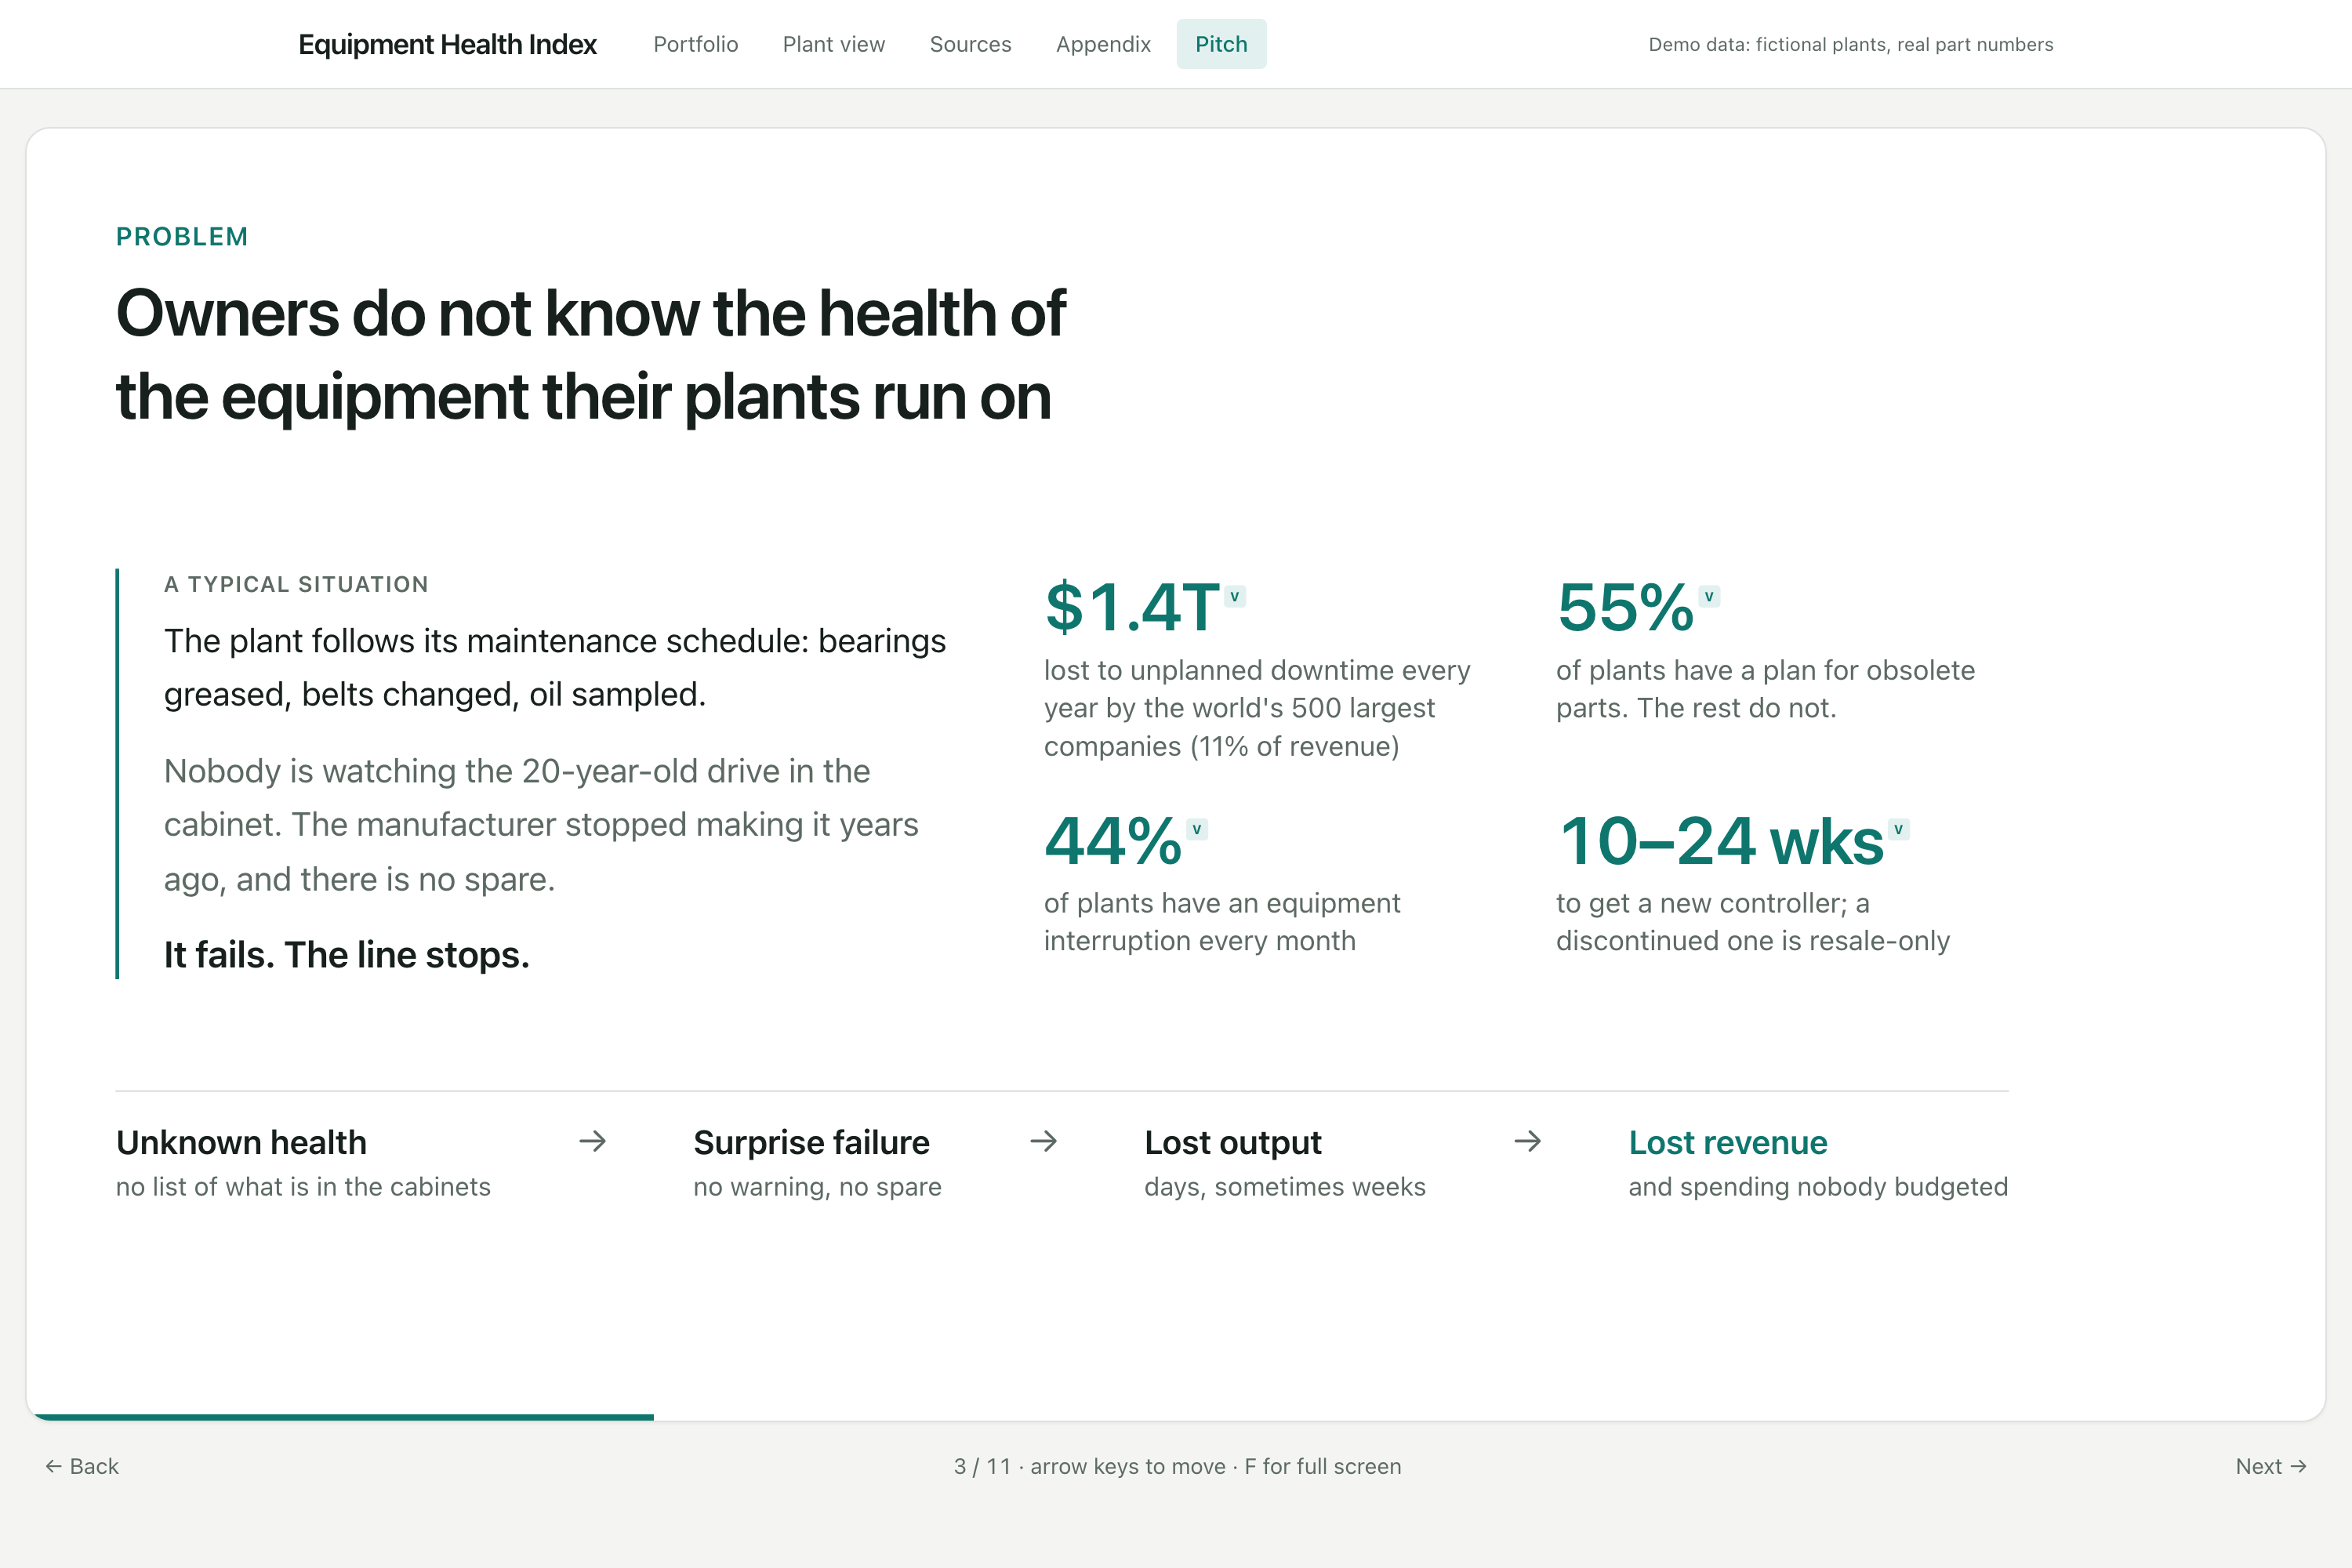
Unplanned downtime costs the world's 500 largest companies about $1.4 trillion a year, and the parts that stop a production line can be mitigated. Manufacturing plants follow their maintenance schedules, but almost nobody tracks the underlying health of the electronics inside their heavy machinery. After conducting much research on the Velocity AI platform, we found that most plants run a maintenance system, but only about 15% of those keep part-level records, and among that 15%, their data is on average only 28% complete.
We the problem as a consulting solution for a fake client, Stone Rose Capital, a Midwest private equity firm with two portfolio companies, five plants and one acquisition on the table, wants to know which equipment could stop production, and how to manage that risk.
What it does
Equipment Health Index is a live registry of every critical part across a PE portfolio of industrial plants. It scores each part's health, flags what will stop a line, and turns that into dollars saved.
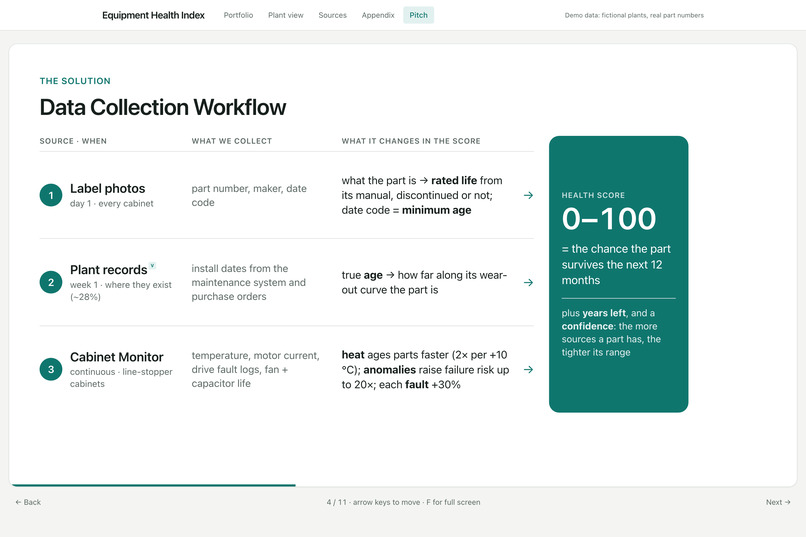
- It identifies photos of nameplates and cabinet labels that are read by AI image recognition software into part number, maker, serial and date code.
- It registers each part and matches it to a lifecycle knowledge base (active / discontinued, rated life, successor) and placed in a fund - company - plant - line - machine - part hierarchy.
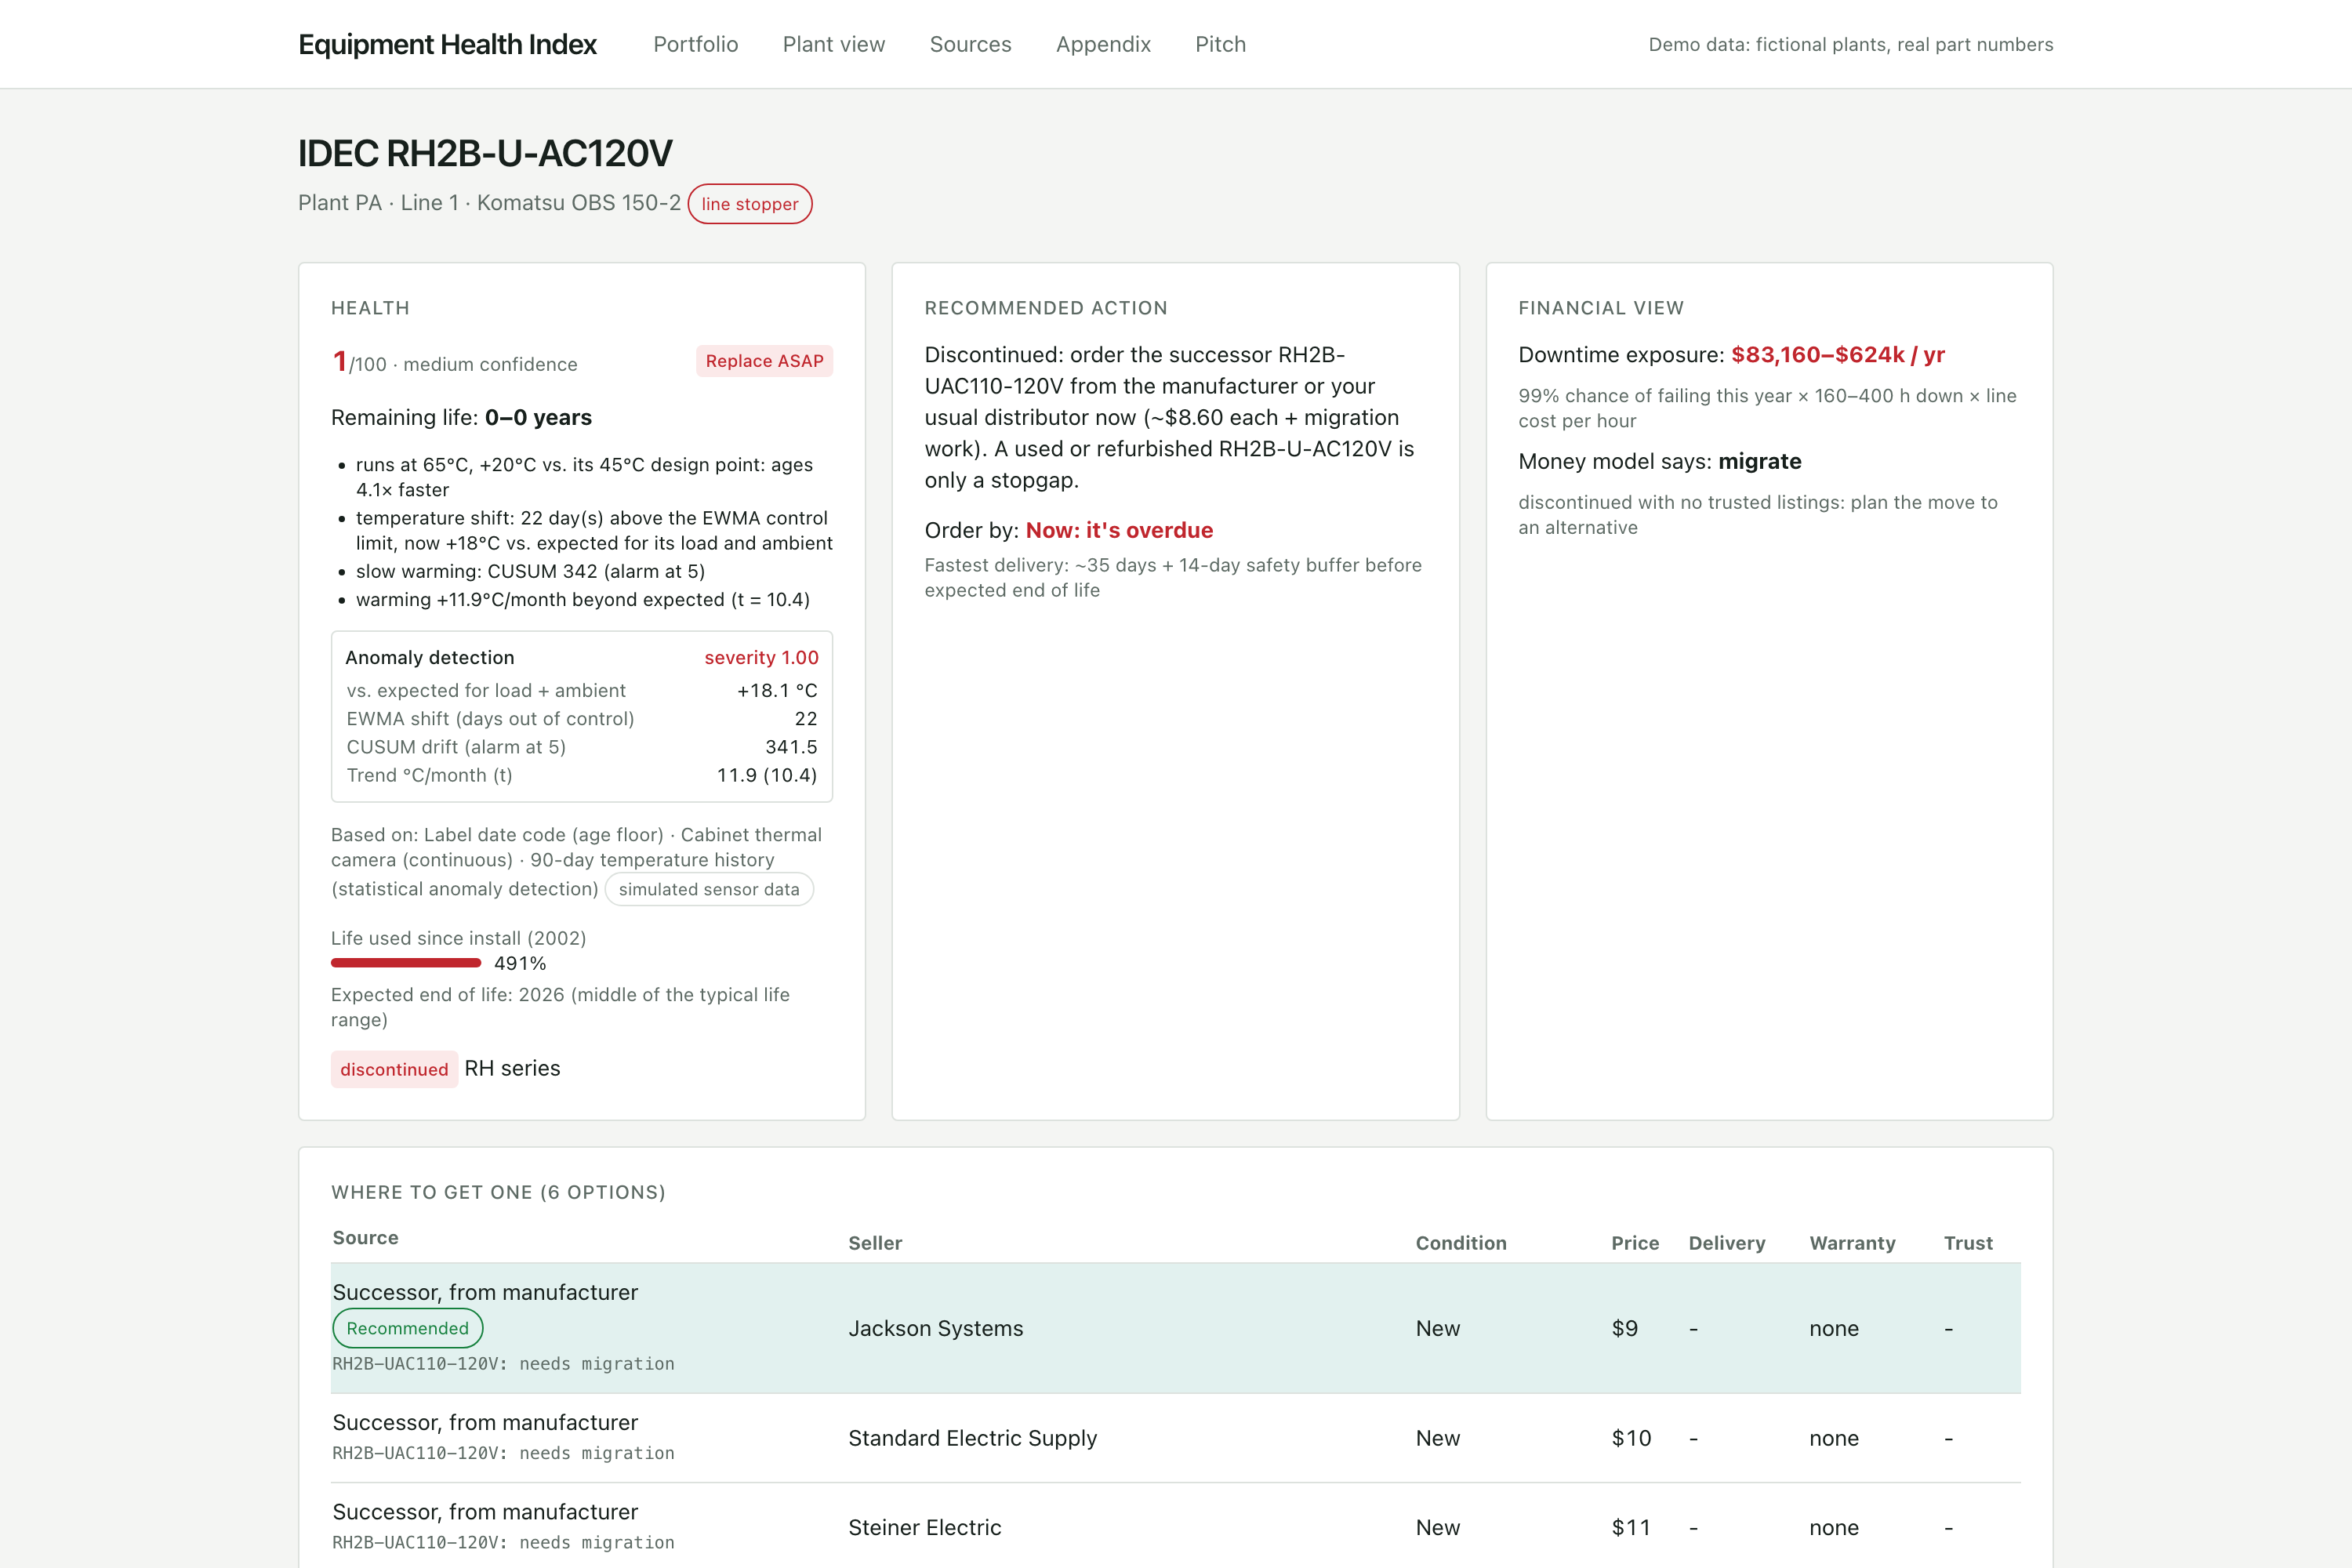
- It assigns each part a health score based on age, heat, sensor anomalies and drive fault logs into one number, the chance the part survives the next 12 months.
- Every at-risk part gets an order-by date and the best way to get one: a spare already sitting at a sister plant first, then the manufacturer or its successor, then marketplaces flagged for counterfeit risk.
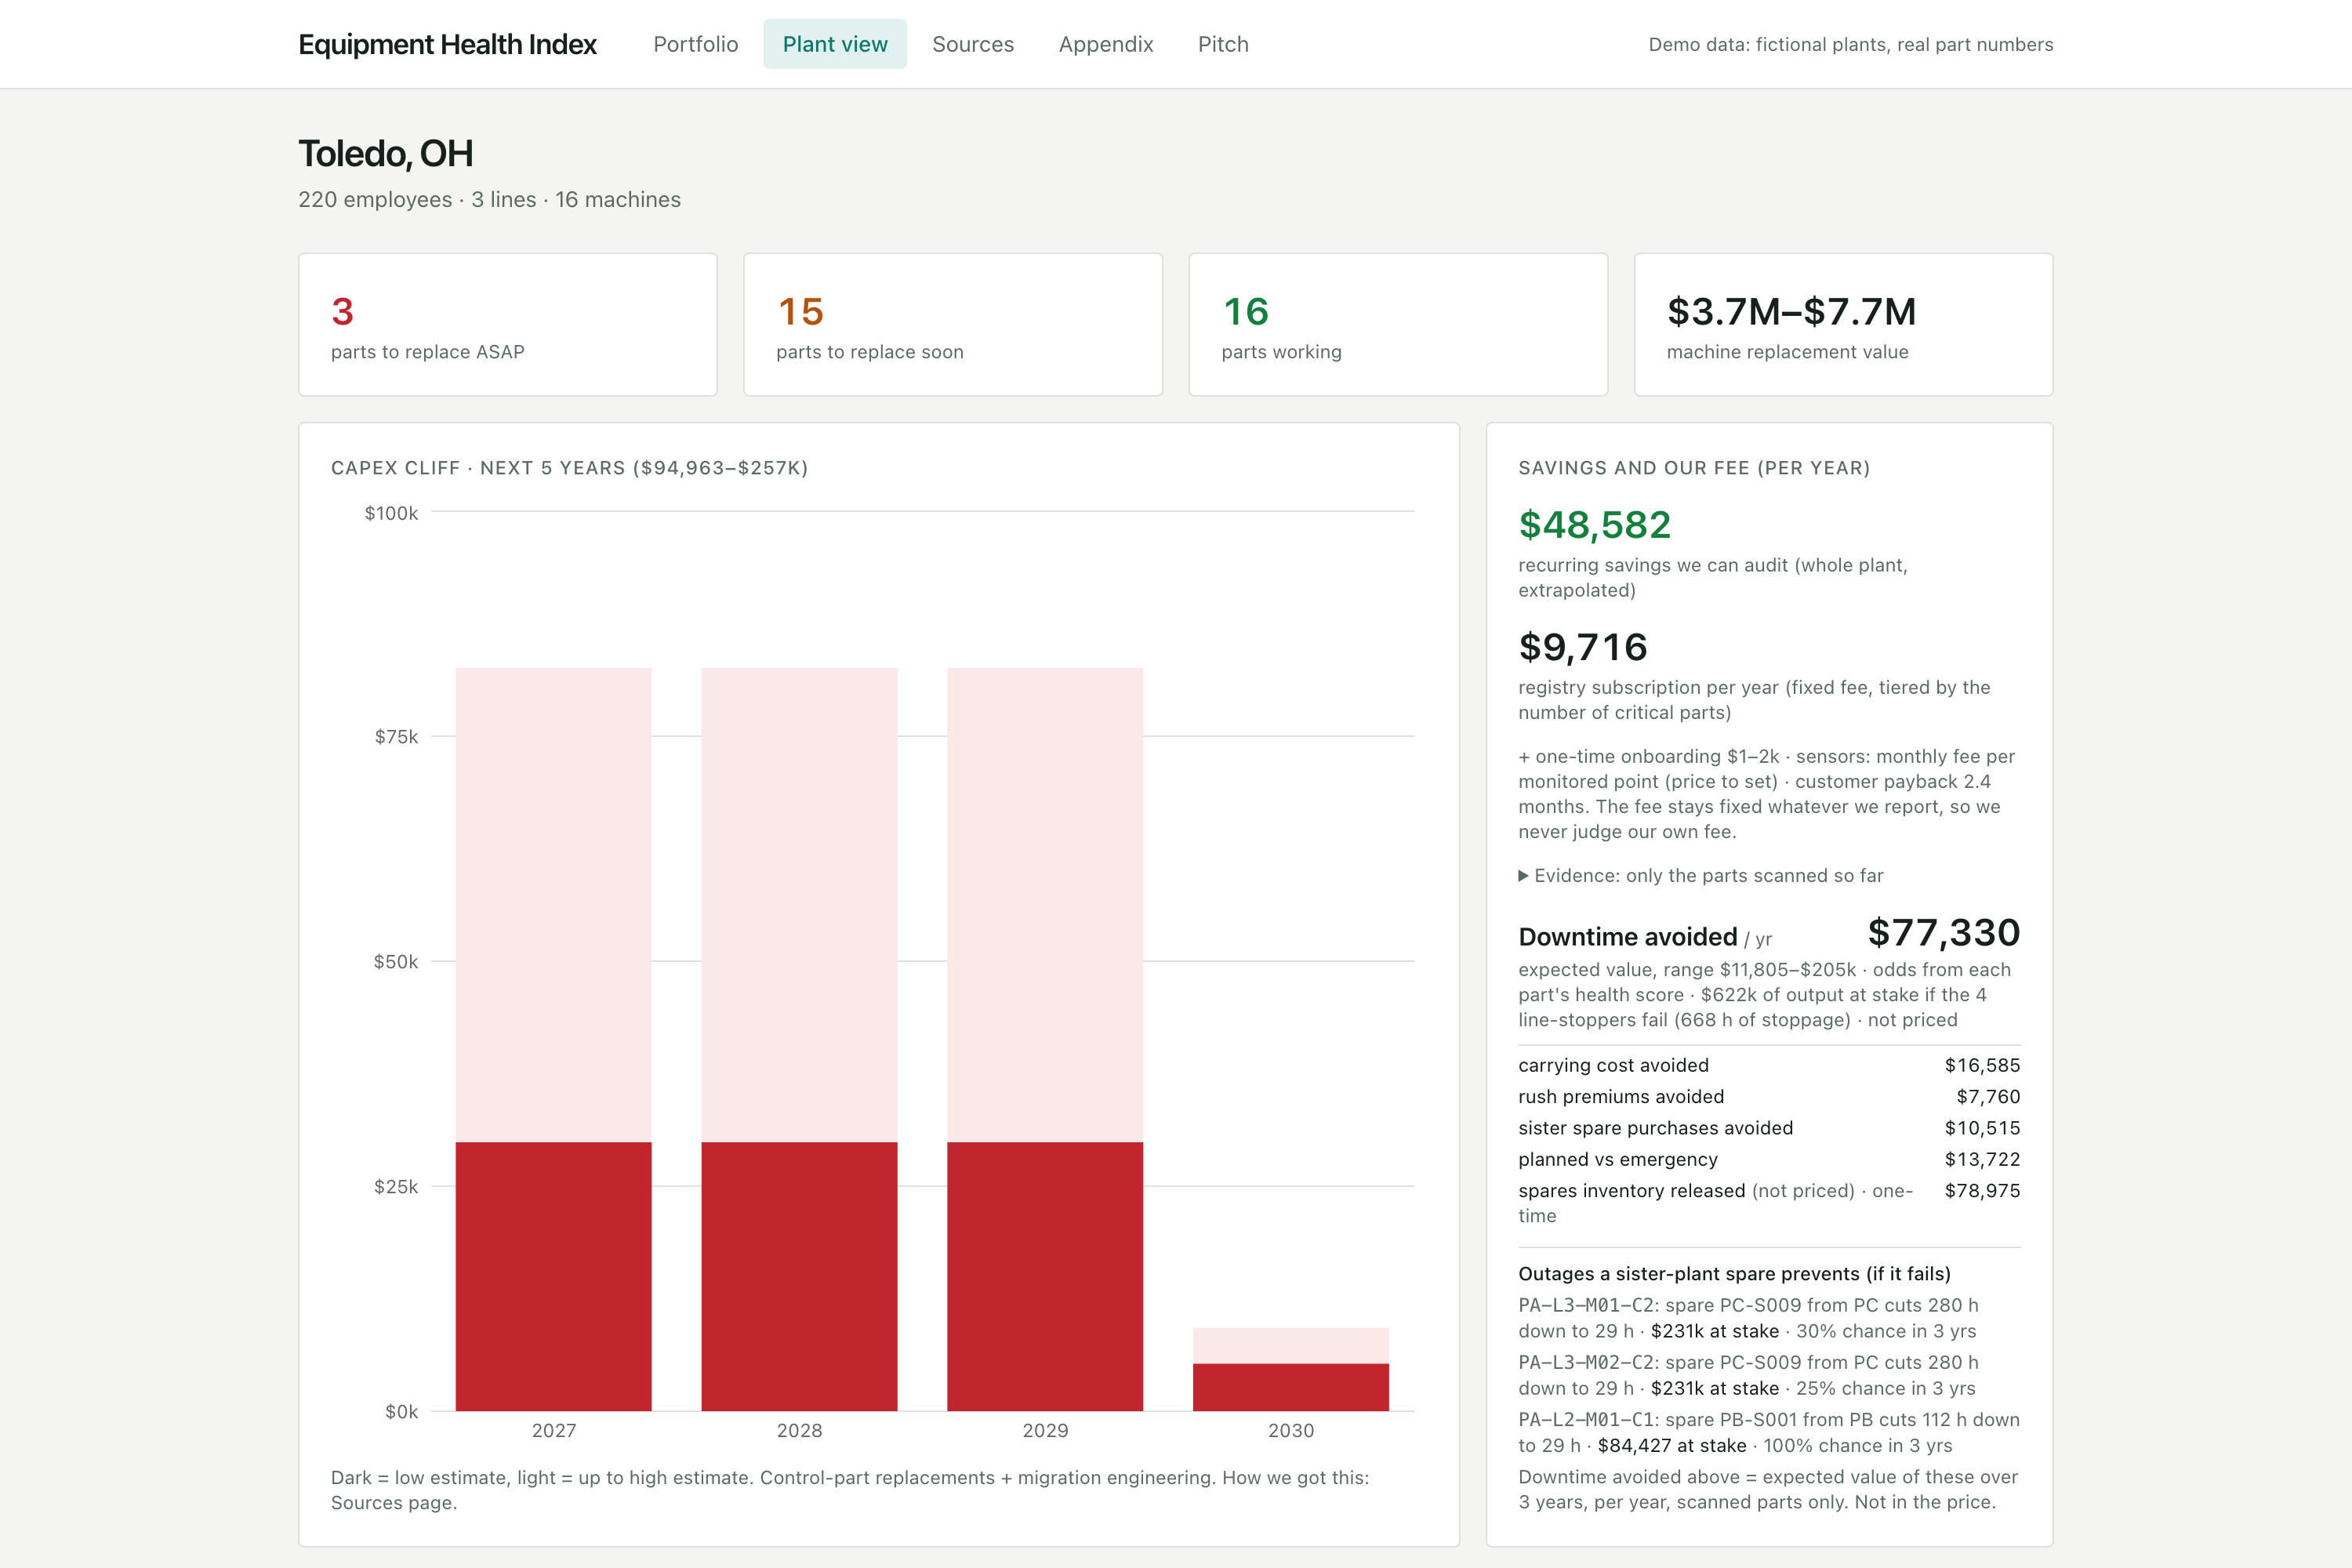
- We then calculate auditable savings (spares carrying cost, planned vs emergency buys, rush premiums, sister-plant spares), plus downtime avoided, shown separately and never priced.
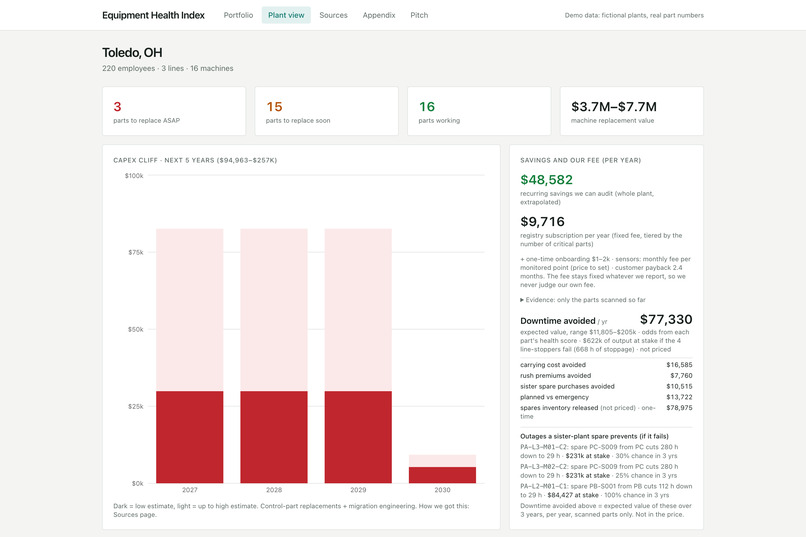
At the demo's largest plant (Toledo), the registry finds about $48.6k a year of auditable savings and about $77k a year of expected downtime avoided, with $622k of output at stake across four line-stopping parts.
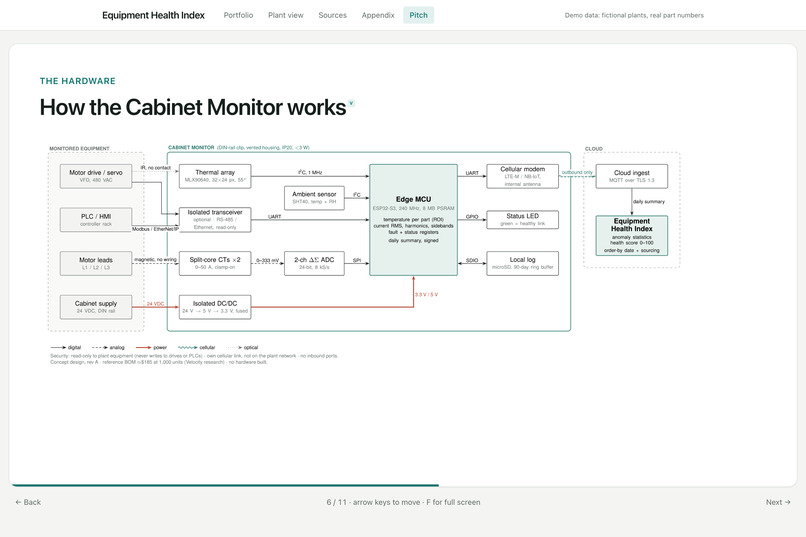
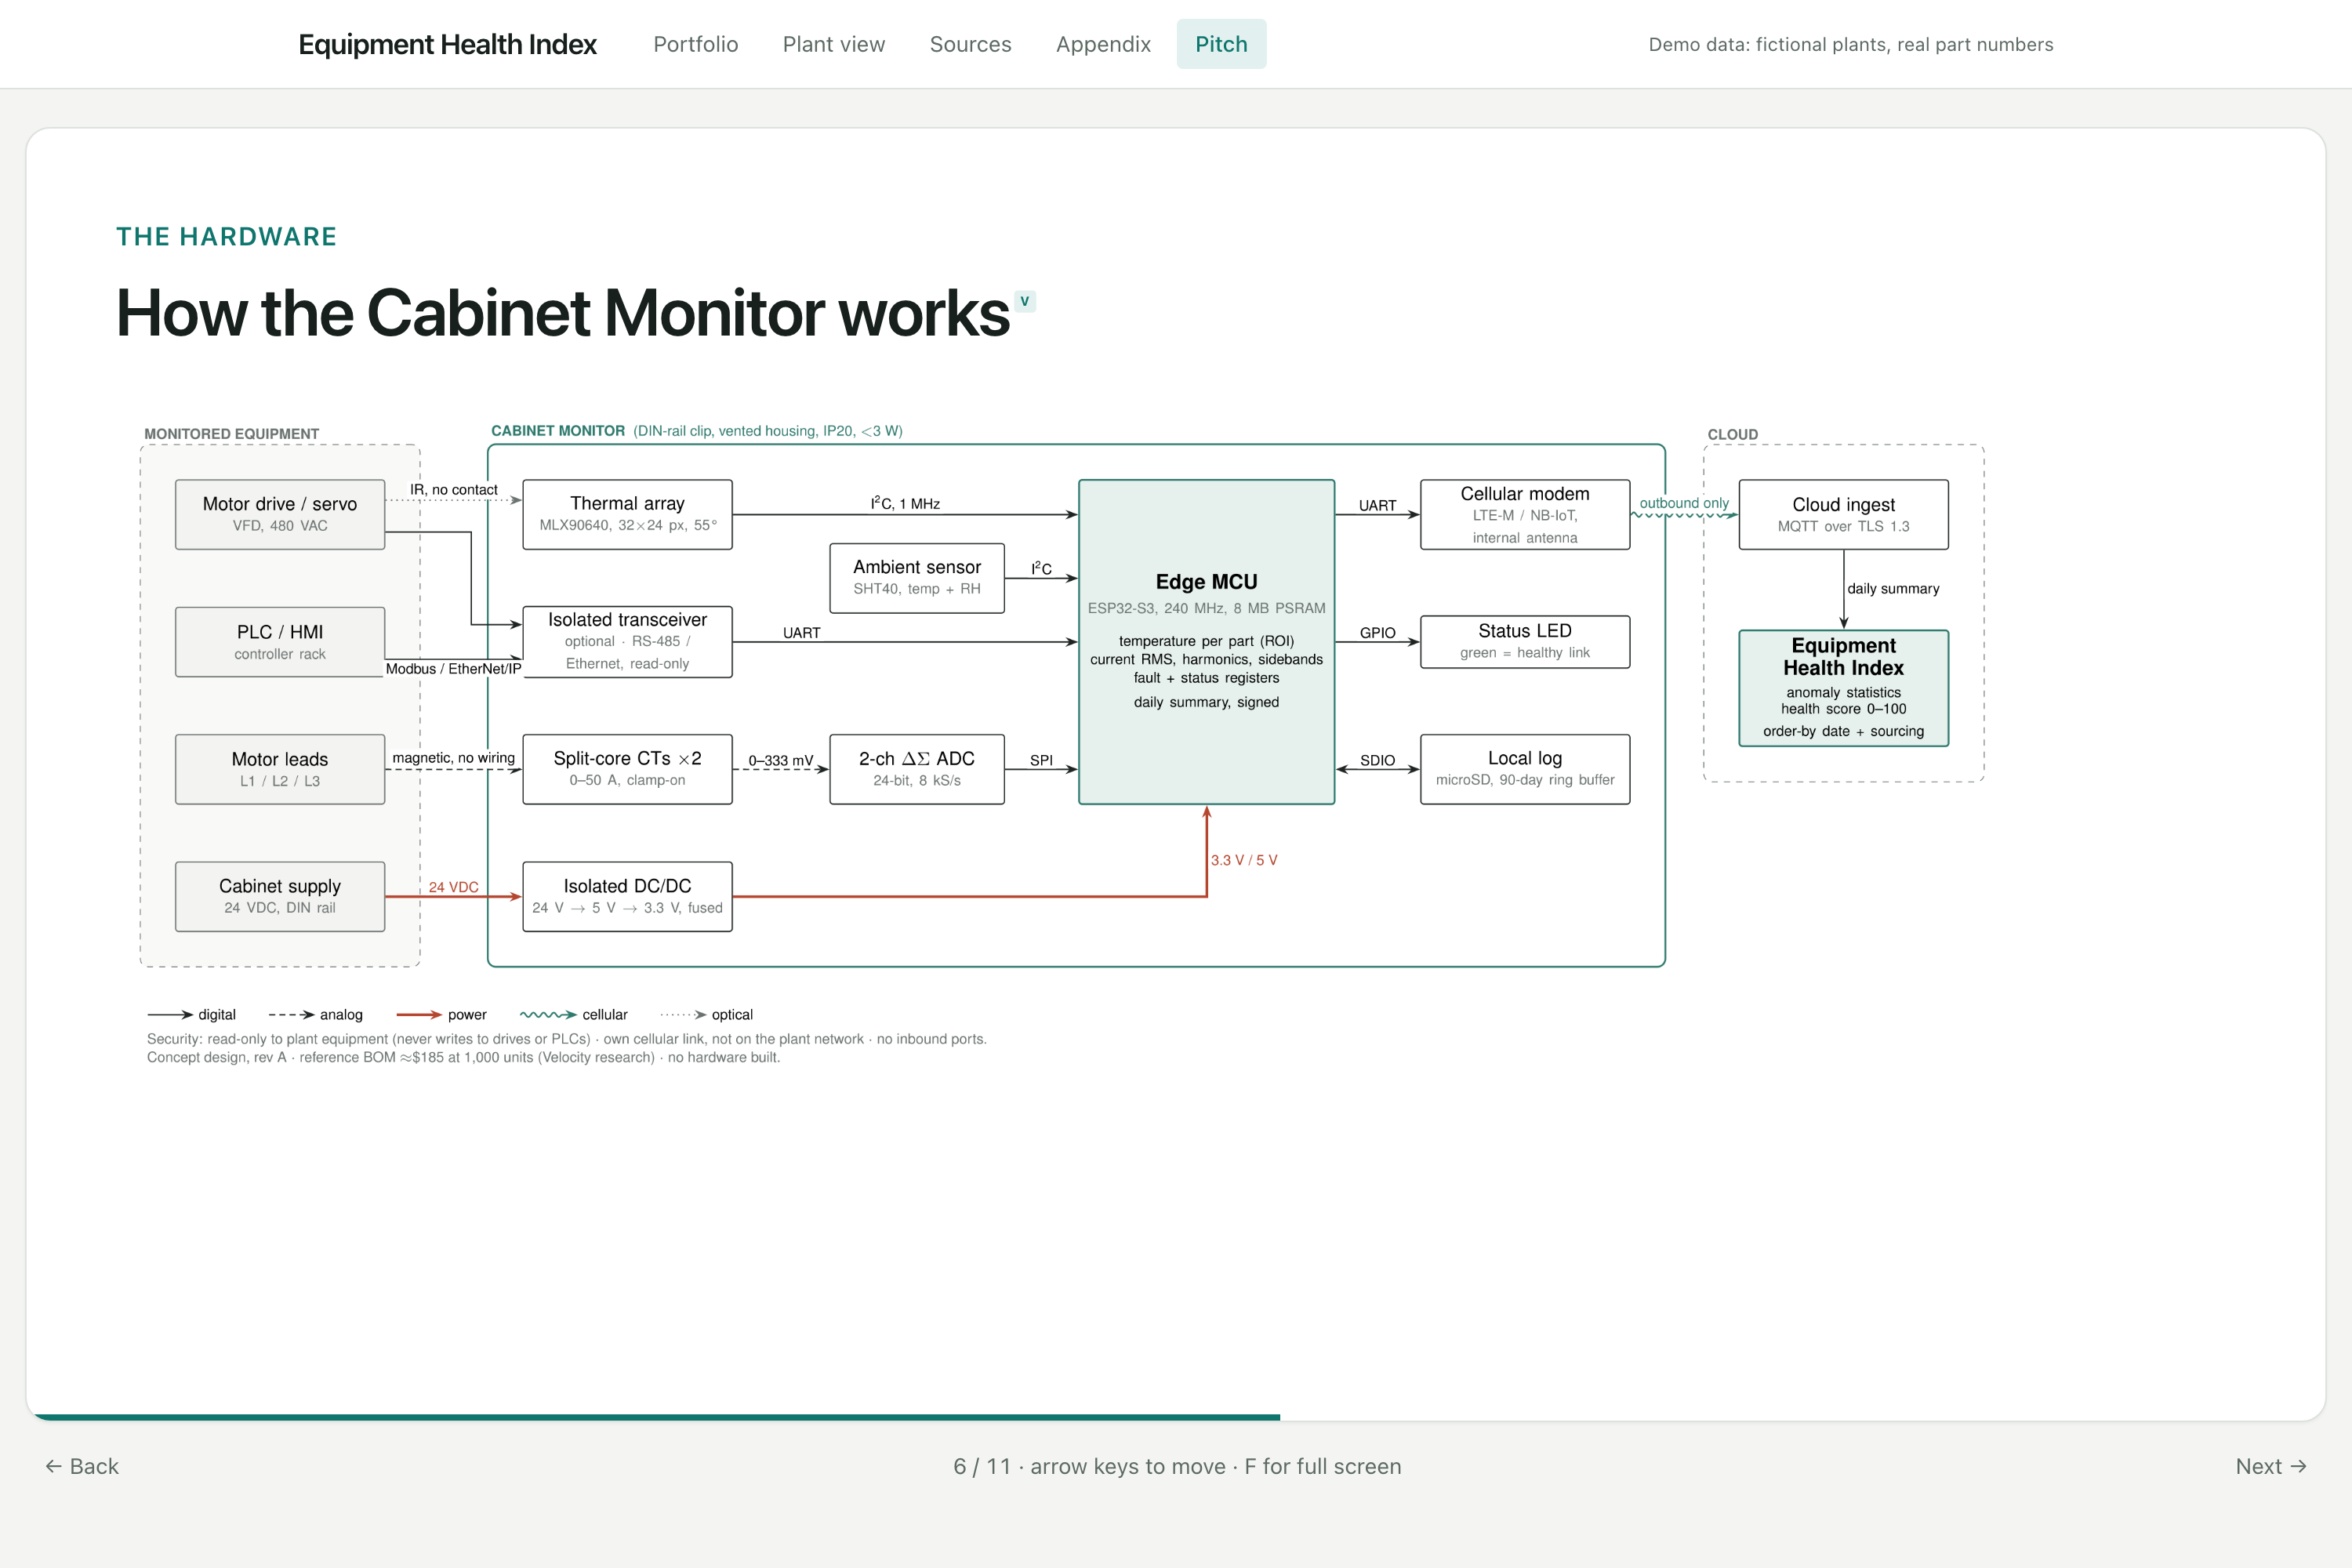
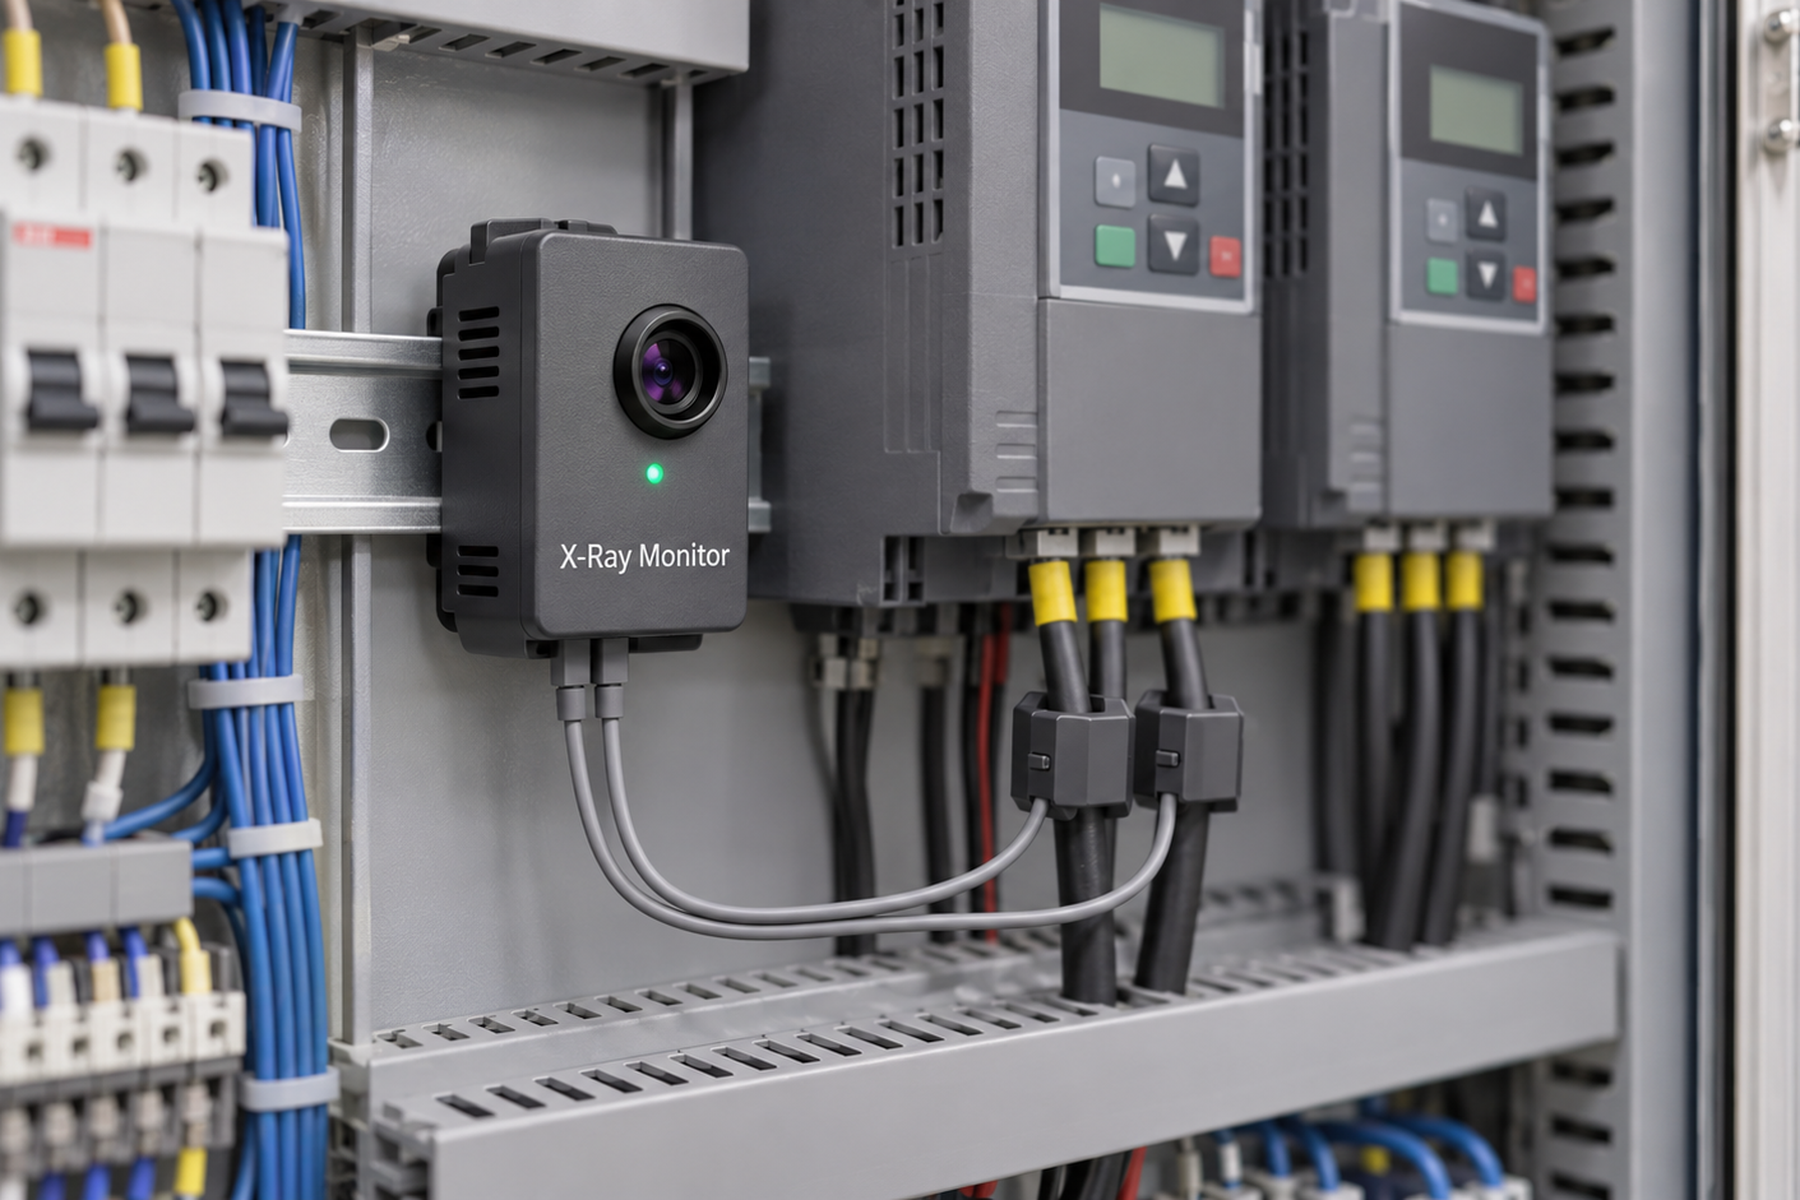
We also designed the Cabinet Monitor, a small DIN-rail box with a thermal array, clamp-on current sensors and a cellular modem. It reads temperature and motor current continuously, never writes to plant equipment, and isn't on the plant network. Velocity research put its cost at about $185 per unit at 1,000 units and about $470 per cabinet all-in for the first year.
How we built it
- Backend: Python (pandas, numpy) and FastAPI over a SQLite registry, with a synthetic "test factory" of six plants that has planted answers, so accuracy is measured, not assumed.
- Vision: Claude (
claude-sonnet-5-5) reads label photos. Readings are cached so the demo runs offline. - Frontend: Next.js 15, Tailwind and Recharts, with the pitch deck built into the app and the live demo embedded in it.
- Research: 20+ Velocity research prompts covering plant maintenance data, device economics, failure rates, downtime benchmarks, lifecycle dates and market size. Every number in the app carries its source, and the Appendix tab tags everything that came from Velocity.
- Hardware diagram: written in TikZ (LaTeX).
The health model is a Weibull proportional-hazards survival model:
$$\text{health} = 100 \cdot \exp\left(-m \cdot \frac{(a+1)^{\beta} - a^{\beta}}{\eta^{\beta}}\right), \qquad m = e^{\ln(20)\, s} \, (1 + 0.3f)$$
Here \( a \) is effective age (heat-adjusted: life halves per \( +10\,^{\circ}\mathrm{C} \)), \( \beta = 3 \), \( \eta = 1.1 \times \) rated life, \( s \) is the anomaly severity (0–1) and \( f \) is the number of drive faults in the last 12 months.
Anomaly detection uses standard statistical process control on each part's temperature residual against its own 30-day baseline: EWMA for sudden shifts, CUSUM for slow drift, a trend t-test, a robust z-score against identical parts, and Mahalanobis distance on motor-current features.
Downtime avoided counts only spare rescues the scan actually found:
$$\text{downtime avoided} = \sum P(\text{fail}) \times \text{hours the spare saves} \times \text{lost margin per hour} \times \text{share of output never made up}$$
Each part's failure odds come from its own health score: \( P(\text{fail this year}) = 1 - \frac{\text{health}}{100} \).
Install records: we didn't assume every plant knows when parts were installed. Using Velocity's estimates:
$$P(\text{record}) = 0.60 \times (0.15 \times 0.7 + 0.85 \times 0.6 \times 0.7) \approx 28\%$$
Challenges we ran into
- Plants have bad data. Most part history lives at the machine level, if it exists at all. We built the model to use whatever evidence a part has and to widen its uncertainty range when evidence is thin.
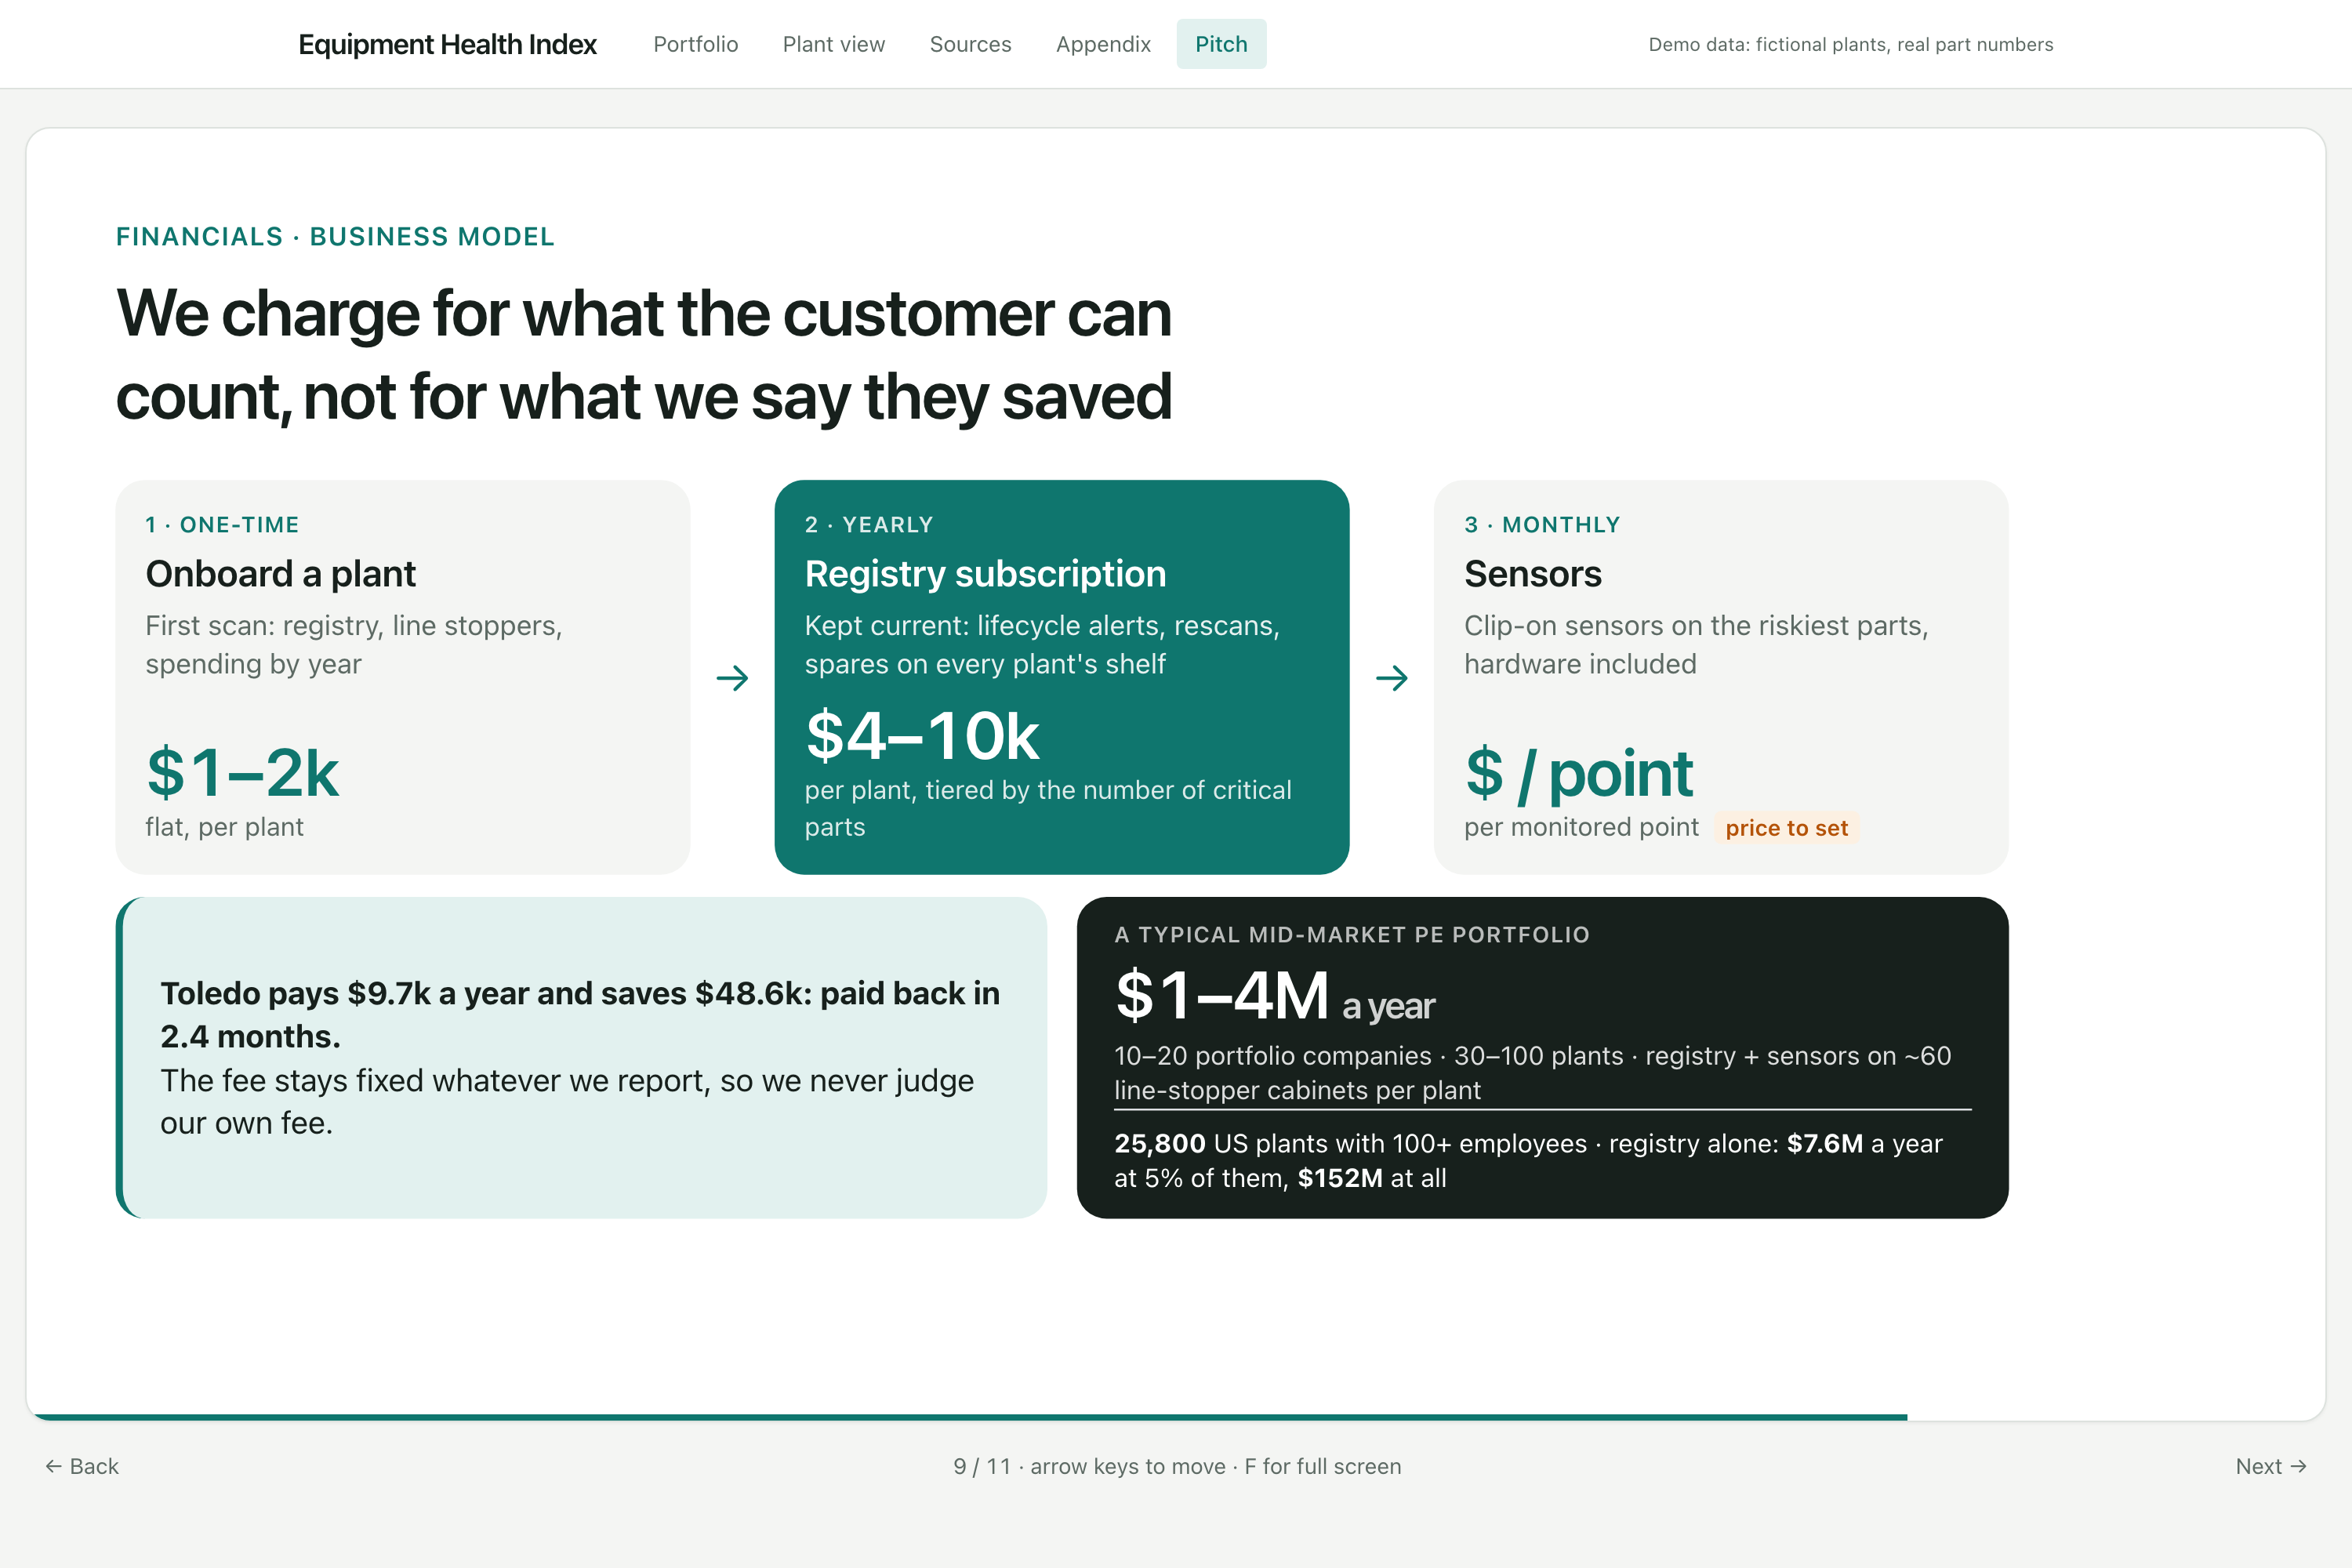
- Pricing without a conflict of interest. A mentor pointed out that taking a share of "savings" means grading our own fee. We switched to fixed fees: one-time onboarding, a yearly registry subscription tiered by critical parts, and a monthly fee per sensor point.
- False alarms. Early anomaly detectors fired on normal weather swings. Modeling temperature rise over ambient and judging only the most recent week brought false alarms down to about 1 in 40 monitored parts.
Accomplishments that we're proud of
- A working proof of concept in one weekend: label photos become a live registry of every critical part, each with a health score, an order-by date and the best place to source it, from the PE fund down to a single relay. It runs live on a public link.
- Built hand in hand with industry experts: we went back to the event's industry mentors repeatedly and reshaped the idea each time. They pushed us to lead with the hardware and downtime, to frame the pitch around a real client (a PE firm and its plants).
- Every number is backed Velocity AI research, logged with what we pushed back on, and a searchable appendix of every formula and assumption.-On our test factory, 127 of 129 label photos were read exactly, parts matched to the lifecycle catalog with 100% precision, and the health model caught all planted health discrepancies.
What we learned
- The data to prevent most line stoppages often already exists. It sits unread in drive diagnostics and sister plants' storerooms.
- Velocity was most useful when we pushed back on it. Several of its first answers were corrected or narrowed, and we logged every prompt, answer and correction.
- Separating what a customer can audit from what we estimate made the business case far more credible.
What's next
Run 3 paid plant pilots and 1 portfolio:
- site walks at real plants
- first Cabinet Monitors on the riskiest cabinets
- measure accuracy on real worn nameplates, which findings changed a decision, and whether the owner pays to keep it running
Later: shared spares and buying across a fund's companies.
