-
-
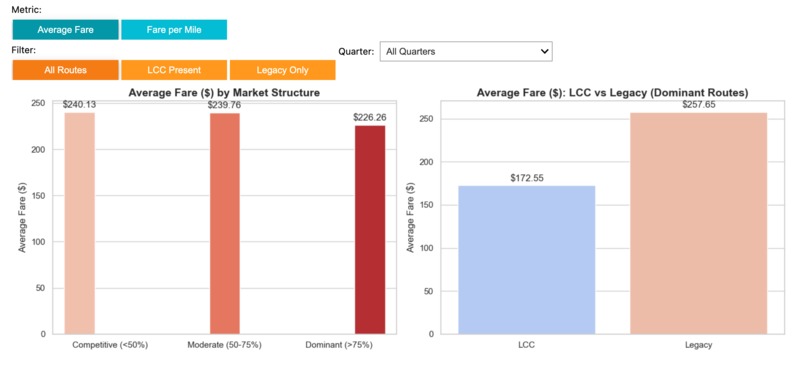
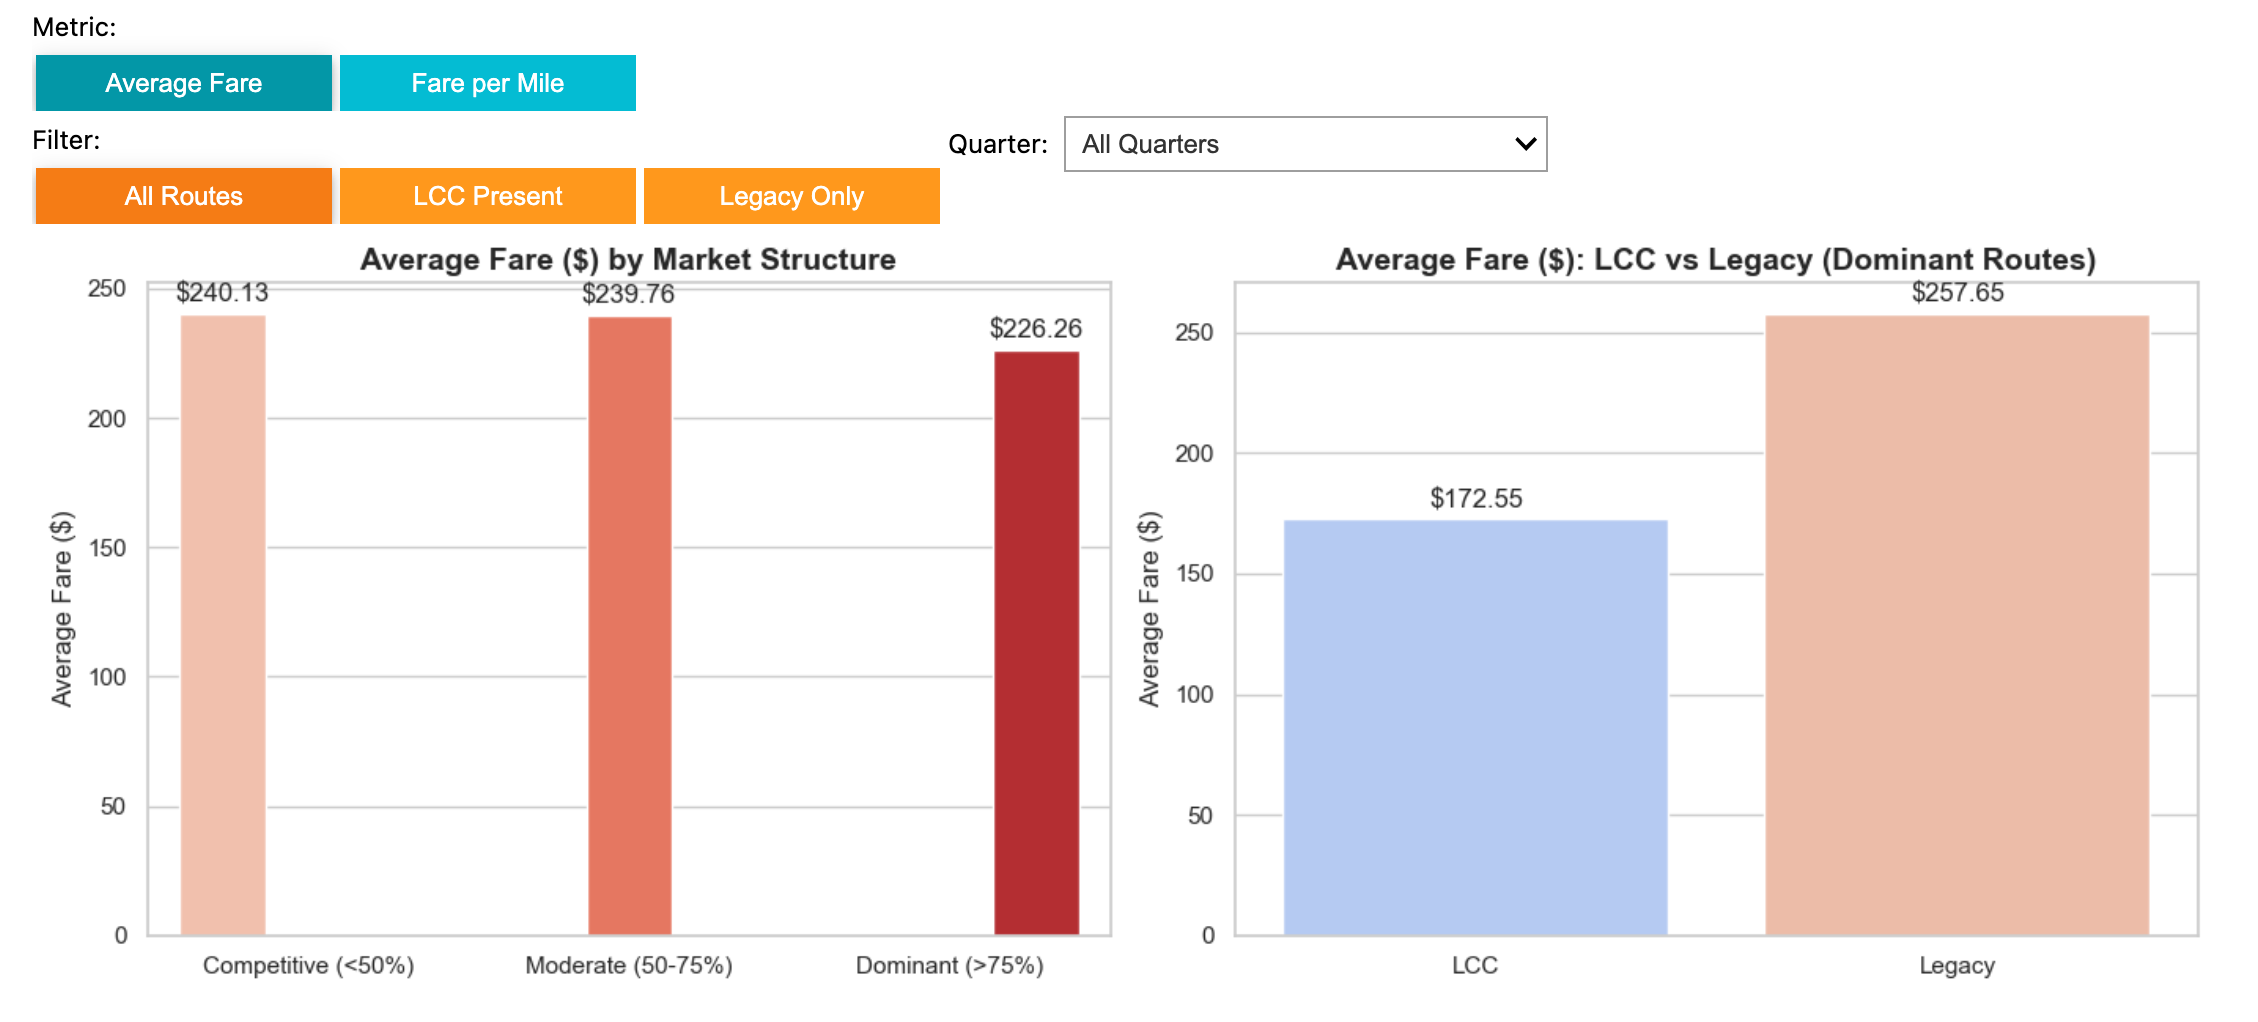
Interactive Dashboard Screenshot
Analysis Summary: Market Structure and Pricing
Research Question: How do fares differ between routes that touch highly dominant hub cities versus more competitive markets? Do routes with greater LCC penetration exhibit systematically lower fares?
Key Findings:
LCC Presence Lowers Fares - Even after controlling for distance
- Routes with an LCC present have ~10% lower average fares ($233 vs $261).
- This gap PERSISTS in fare-per-mile ($0.28 vs $0.31), proving the effect is not just because LCCs serve shorter routes.
- OLS regression confirms: each 1 percentage point increase in LCC market share reduces fare by ~$0.67, holding distance constant.
- Market Dominance Raises Fares - But the story is nuanced
- Counterintuitively, raw fares are LOWEST on dominant (>75% market share) routes. But this is misleading: dominant routes tend to be shorter on average.
- Once we control for distance (fare-per-mile), the relationship flips: Dominant routes are the MOST EXPENSIVE per mile ($0.37), followed by Moderate ($0.30) and Competitive ($0.25).
- OLS regression confirms: going from 0% to 100% dominant carrier share increases fare by ~$63, holding distance and LCC share constant. All coefficients are statistically significant (p < 0.001).
LCC Dominance Matters on Concentrated Routes
- Among dominant (>75%) routes, LCC-dominated routes have significantly lower fares ($173 vs $258) and lower fare-per-mile ($0.29 vs $0.42) than legacy-dominated routes.
- This shows LCCs act as a pricing discipline even in concentrated markets.
- Distance Is the #1 Fare Driver, But Market Structure Matters
- The Random Forest model explains 78.7% of fare variance (vs 52.2% for OLS), confirming non-linear relationships exist.
- Feature importance: distance (60.7%) >> market dominance (14.0%) ≈ demand/passengers (12.1%) ≈ LCC share (11.2%) >> seasonality (2.1%).
- Both large_ms and lf_ms have independent, significant effects on fare — supporting the hypothesis that market structure shapes pricing.
Conclusion: The data strongly supports BOTH hypotheses: (a) Routes touching dominant hubs DO charge higher fares per mile. (b) Greater LCC penetration IS associated with systematically lower fares. These effects are robust to controlling for distance, demand, and seasonality across multiple statistical methods (group comparisons, OLS regression, and Random Forest modeling).
Built With
- jupyter


Log in or sign up for Devpost to join the conversation.