-
-

Latest look of our web application with the pages for air quality and alerts, as well as the updated map and product links.
-

Meet our team!
-

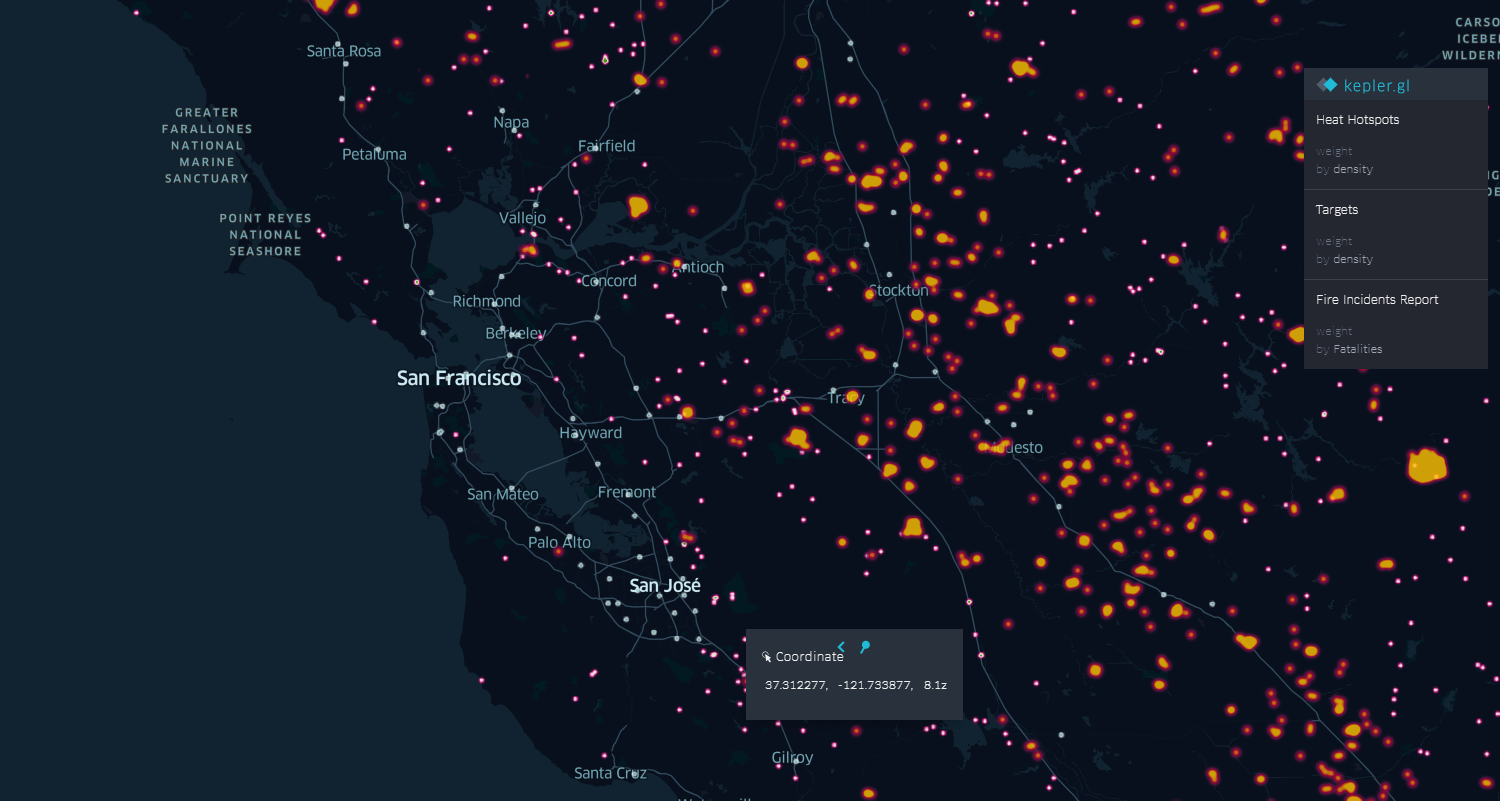
Overlook over San Francisco with the heat hotspots are visualized/
-

Visualization and map view of Target retail locations, along with firefighter incident responses to temperature hotspots.
-

Another caption of visualization and map view of Target retail locations, along with firefighter incident responses to temperature hotspots.


Detailed Executive Summary
Human beings are the number one cause of wildfires in the United States, taking up many lives every single year. The past years, in 2019 and also in 2020, the wildfires in California have been a major threat to the local communities, forcing many to evacuate and lose their homes, even their lives and their health.
Our project, titled Project Gaea after the Latin name “gaea” meaning “earth,” is aiming to create a system of data visualization in the form of heat maps with preventative measure features instilled to help those who are suffering from this natural disaster. This will be conducted in the means of a web application, where users can have real-time access to active wildfire and high-heat as well as air quality information and display any sort of government-issued alerts and emergency orders on the spot. The main point of differentiation comes in the fact that Gaea will point users to resources they might need - such as face masks, air purifiers etc. by displaying the nearest stock availability at major retailers and warehouses, so that they can better protect themselves.
We believe that the more awareness people have about wildfires, the greater the chances that they will take preventative measures in the future. If people are not informed about the approaching danger, there is a low chance that preventing wildfires would be their main concern. Our project aims to make data accessible. Yet, the other main differentiation point is that we will include a resource allocation system through which, depending on their geographical location, residents in the areas under risk can see which stores, warehouses etc. have adequate stock of medical supplies needed. This information also will be accurately updated—all serving to the purpose of protecting.
The Problem
Disastrous wildfires are taking many lives. Human beings are the number one cause of wildfires in the United States. Wildfire prevention, prediction and preparation are not accurate enough.
The Solution
Web application. Data visualization of local heat maps with prediction tools. Display of available stocks for urgent protective medical supplies nearby.
What it does
The Difference Local resource allocation system. Point those in need to masks & medical equipment distributors. Present prediction of potential wildfires & alert users.
Current Identified Standards
We have found that not many apply since our project is more data-driven yet here are the ones we aim for. However, we have identified some potential ones that we have based design considerations and data collection on.
We will be basing our recommended personal protection equipment and general protective guidelines against wildfires on the NFPA (FIRE) 1143 - Standard for Wildland Fire Management, 2018 Edition.
Compliance with the IEEE 3006.9 2013 Recommended Practice for Collecting Data for Use in Reliability, Availability, and Maintainability Assessments of Industrial and Commercial Power Systems which indicates the “collection of data for use in reliability, availability, and maintainability assessments of industrial and commercial power systems” practices.
Heat data complies with the USGS National Geospatial Program Standards and Specifications which “ensure that all maps and data prepared by NGP, in support of The National Map, are consistent in accuracy, structure, format, style, and content.”
How we built it
Challenges we ran into
- We will need to base our minimum viable product on one single retailer’s price-matching, stock algorithm since APIs differ immensely between retailers (Target, Walmart etc.).
- Prediction of a wildfire simply from heat data is tough and not very accurate - we will be focusing on predicting the possible trajectory of it instead.
What we learned
- We had to gravitate more towards software-oriented, open-source projects since hardware would be harder to maintain in a virtual environment.
- Used git version control, online compiling tools like Jupyter to keep on track
- Pivoted a lot around the idea of our project, had to tweak some algorithms that we initially were thinking of implementing
Bulk of work since last semester
We have also managed to create another page that displayed the Nationwide Weather alerts belonging to all states. Users are able to select a state from the menu and they can see any and all government or weather agency issued alerts and/or information on their dashboard at that instant’s accuracy, so they could prepare themselves accordingly.
Additionally, we have applied for an Amazon Affiliates Program- is essentially a referral program that pays a commission to referring websites. The Amazon Associates Program helps content creators, publishers, and bloggers monetize their product. Amazon has millions of products and programs available on Amazon, associates use easy link-building tools to direct their audience to recommendations, and earn from qualifying purchases and programs through three steps: Sign up, recommend, and earn. The beauty of the Amazon Affiliates page is a direct link to any product of our choice. For us, this was a fire blanket, a K95 mask, an emergency fire/survival kit and air filters for smoke clearing & detection. We can switch out the products if need be as well since we are Amazon affiliates but we thought that this array of products would represent the current, most urgent needs. We have included the links to these products in our application with easy access purchase buttons as we pursued our goal of being a one stop shop for all emergency/fire related needs.
Built With
- amazon-web-services
- gl
- javascript
- kepler
- kepler.gl
- mapbox.gl
- python
- vue
- vue.js


Log in or sign up for Devpost to join the conversation.