-

Home Screen
-
Dashboard

Problem Statement
We were tasked with tracking visitor footfall in order to collect quantitative data on visitor behaviors as well as improving visitor safety in the museum. This includes determining which spaces are visited by more people and/or for longer and being sure that visitors have left in case of an evacuation.
Constraints
During our brainstorming process, we had to keep two main constraints in mind:
- There are limited resources for additional technology
- Build our solution around privacy and security measures
Through researching different methods of tracking footfall that already exist such as NFC/DFIR tags and tracking geolocation using an application, we decided that we wanted to minimize user interaction. This would cut down on human error as well as the hassle of keeping track of something physical or downloading an app and taking time away from the consumer's museum experience.
Moving forward into more specific brainstorming, we wanted to keep this constraint of minimizing user interaction alongside the other two that were given to us.
Our First Solution
Our first solution was to use Wi-Fi connection in order to determine geolocation so that all users with a mobile device that connect to Wi-Fi would be automatically tracked. The drawback with this method was that most current solutions like Google Geolocation API and Amazon Location Services utilized an API through a web app, which would require user interaction.
To combat this need of downloading an app, we looked deeper into indicators within packet streams that could be tracked from each access point.
Our Second Solution
Our second idea was tracking DHCP packets that were sent to new devices on a network. When devices join a network, a DHCP server automatically assigns it an IP address to comply with the network's subnet and allow a connection. This packet could be tracked and used to show when a user enters a new access point in the museum. After asking the staff, we discovered that the museum uses a system of Wi-Fi boosters around the museum which would act as our access points.
The drawbacks with this solution were that after a certain amount of time, the IP assigned to a device from the DHCP server expires and it sends out another packet. Without modifying the core settings of the router, multiple DHCP packets could be sent for a single user if they stay at a certain exhibit for an extended period of time. The device's IP address would also change which would not give us a solid credential to track a user and their location history by. This would skew the data and also interfere with the number of individuals that are tracked during an evacuation, which was a safety risk we weren't willing to take.
Final Constraints
Through our first two proposed solutions, we discovered that we needed:
- A credential to track users by that doesn't change over time
- A single indication of when a user joins an access point each time
- A way to determine when a user has left the museum
Our Final Solution
By using MAC addresses of devices that are already recorded by router logs, we can track devices as they join the networks of different access points over the course of the day. Depending on the placement of access points, we can see when a user has left the museum, entered a new area, and how long they have stayed in each one. MAC addresses don't change over time, so we can pair up the addresses with when it was logged at each access point that they joined the network. Usually, the logs don't tell you when a device disconnects to it, so we will have an access point at the main entrance to determine if a user has left the building. If the main access point was the last one visited before closing or the time when an evacuation occurs, the user can be assumed outside of the museum.
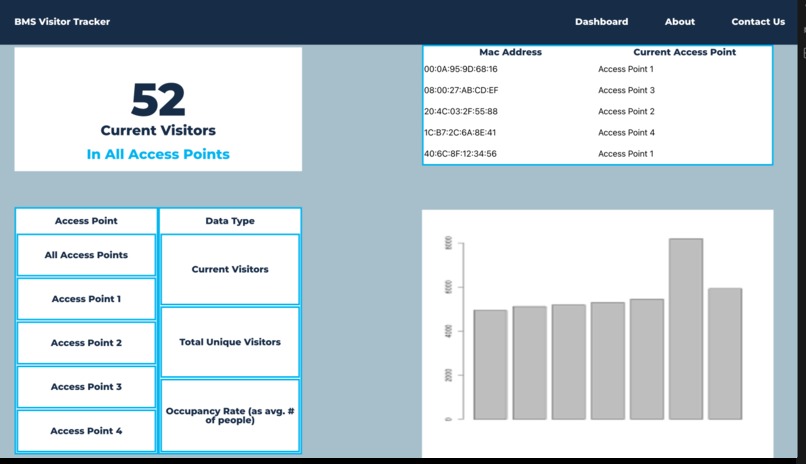
Our Proof of Concept
We have created an example data set of aggregated access point logs to be parsed for important statistics. The method of parsing depends on the format of the logs which will depend on the router in the museum. We used python and pandas in order to get information such as how long a device was in each access point, which access points were the most popular throughout the day, and at what time a device left the museum. These statistics are then displayed on a front-end for worker readability and understanding. The front-end allow you to navigate real-time stats from the current access point logs.
Drawbacks
The only outliers in our data are individuals who are not connected to the Wi-Fi network. This includes those who do not have mobile devices or are using cellular data. In the modern age of technology, most users have a mobile device and use Wi-Fi, so this is not a major concern.
The other drawback would be the use of potentially sensitive information in the form of MAC addresses. This information is already collected by the router and is not being collected for public use or display, so privacy concerns should be minimal with this implementation.

Log in or sign up for Devpost to join the conversation.