-
-
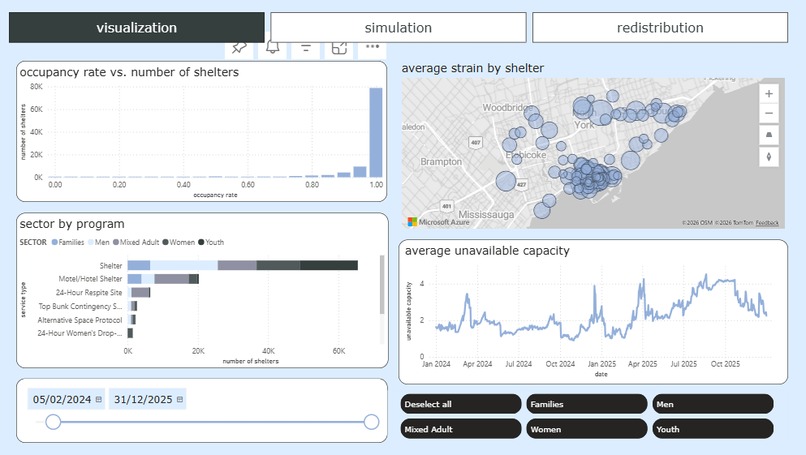
Visualizations showing how different sectors are affected by strain
-

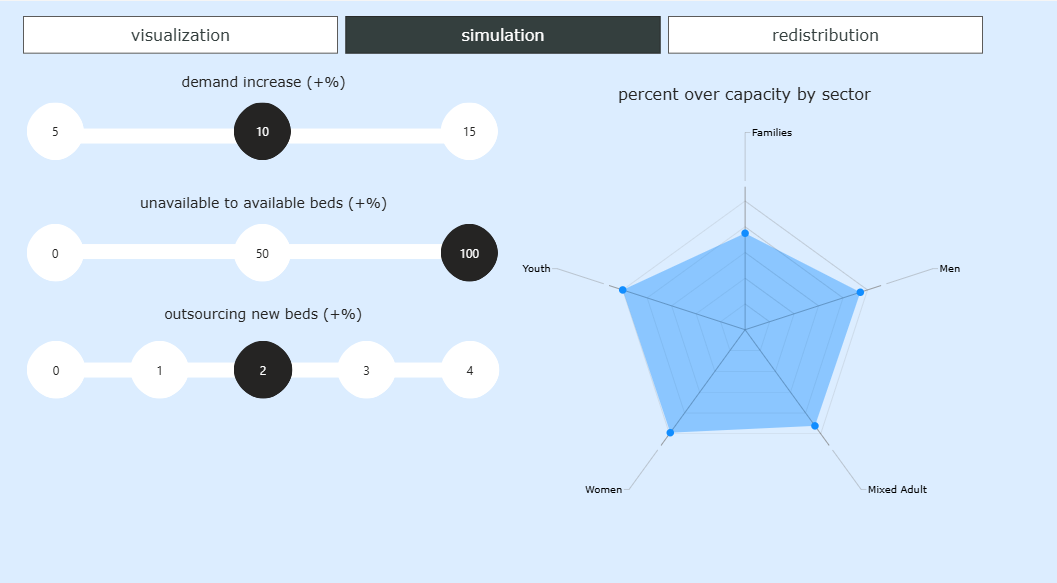
Simulating impact of different policies
-
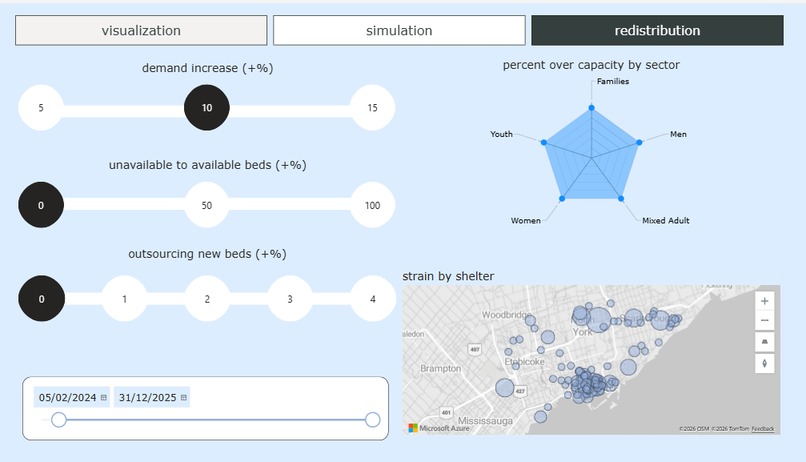
Impact of also utilizing existing resources better through redistribution


Inspiration
The vast majority of Toronto’s shelter operating at or near capacity, causing the entire system to be vulnerable to shocks and preventing people from accessing the housing they need. We wanted to determine which service sectors experience the most pressure and how to use existing resources to improve distribution of shelter demand.
What It Does
We built a dashboard to highlight key areas of strain across the system. Additionally, we created a policy simulation model that illustrates the effect of various scenarios on the system, such as increases in demand, decreases in unavailable rooms, increase in shelters, and relocation strategies.
How We Built It
We cleaned and analyzed the provided public services dataset, realizing several sources of strain on Toronto’s homeless shelter system through data visualization. After identifying possible solutions, we constructed simulations to test the impact of policy changes throughout the system
Challenges We Ran Into
We found it difficult to determine which direction we wanted to take with our project due to some differing views on feasibility and impact. On the technical side, we attempted to geocode latitude and longitude using the open street map or Google API; however, we ran into some issues calling that API and ultimately decided to use Geocodio instead. For our simulations, it was hard figuring out the logic and what types of simulations we wanted to do. We also had to assume a minimum of a 5% increase in demand due to the current data being right-censored, meaning we are not able to see when actual demand is greater than supply because our current observations are capped at demand being equivalent to supply.
Accomplishments We’re Proud of
- Agreeing on a direction to take the project
- Figuring out redistribution logic for simulations (adding a fourth simulation that would illustrate what would happen if we had to reallocate only existing resources)
- Our dashboard looks pretty nice :))
- First hackathon for two of the team members
What We Learned
Homelessness is a very nuanced, systematic issue that requires careful policy decisions, and navigating a balance between feasibility and impact with limited resources can greatly constrain our decision-making scope.
- The system currently operates near saturation and lacks sufficient buffer capacity to absorb modest demand increases
- Mixed Adult shelters are the most common, followed by Men, Women, Youth, and Families. Women and Youth shelters are the most shock-sensitive
- The majority of shelters operate under an Emergency program model.
- General Base is the most common program area.
- Even a modest 5% demand increase pushes a significant share of shelter-nights over capacity across all sectors.
- FSA-level redistribution (REI ≈ 0.07 at baseline) shows modest but meaningful gains, suggesting that redirecting people experiencing homelessness to other shelters with remaining beds within neighbourhoods could reduce crowding.
- Restoring unavailable beds meaningfully reduces strain
- Expanding family shelter capacity yields the largest overall reduction in overflow.
Built With
- chatgpt
- geocodio
- powerbi
- python

Log in or sign up for Devpost to join the conversation.