Inspiration :
Every developer knows the ritual: something breaks, you paste a huge, ugly stack trace into an AI tool, and you burn a pile of tokens on timestamps, memory addresses, and repeated frames just to get to the two lines that actually matter. What bothered us more, though, was the second half of that ritual the same handful of errors recur constantly in any active codebase, and every existing tool re-diagnoses them from scratch, at full price, every single time. I wanted to build something that treated not sending a request at all as the first optimization, not just a cheaper way to send the same request.
What it does:
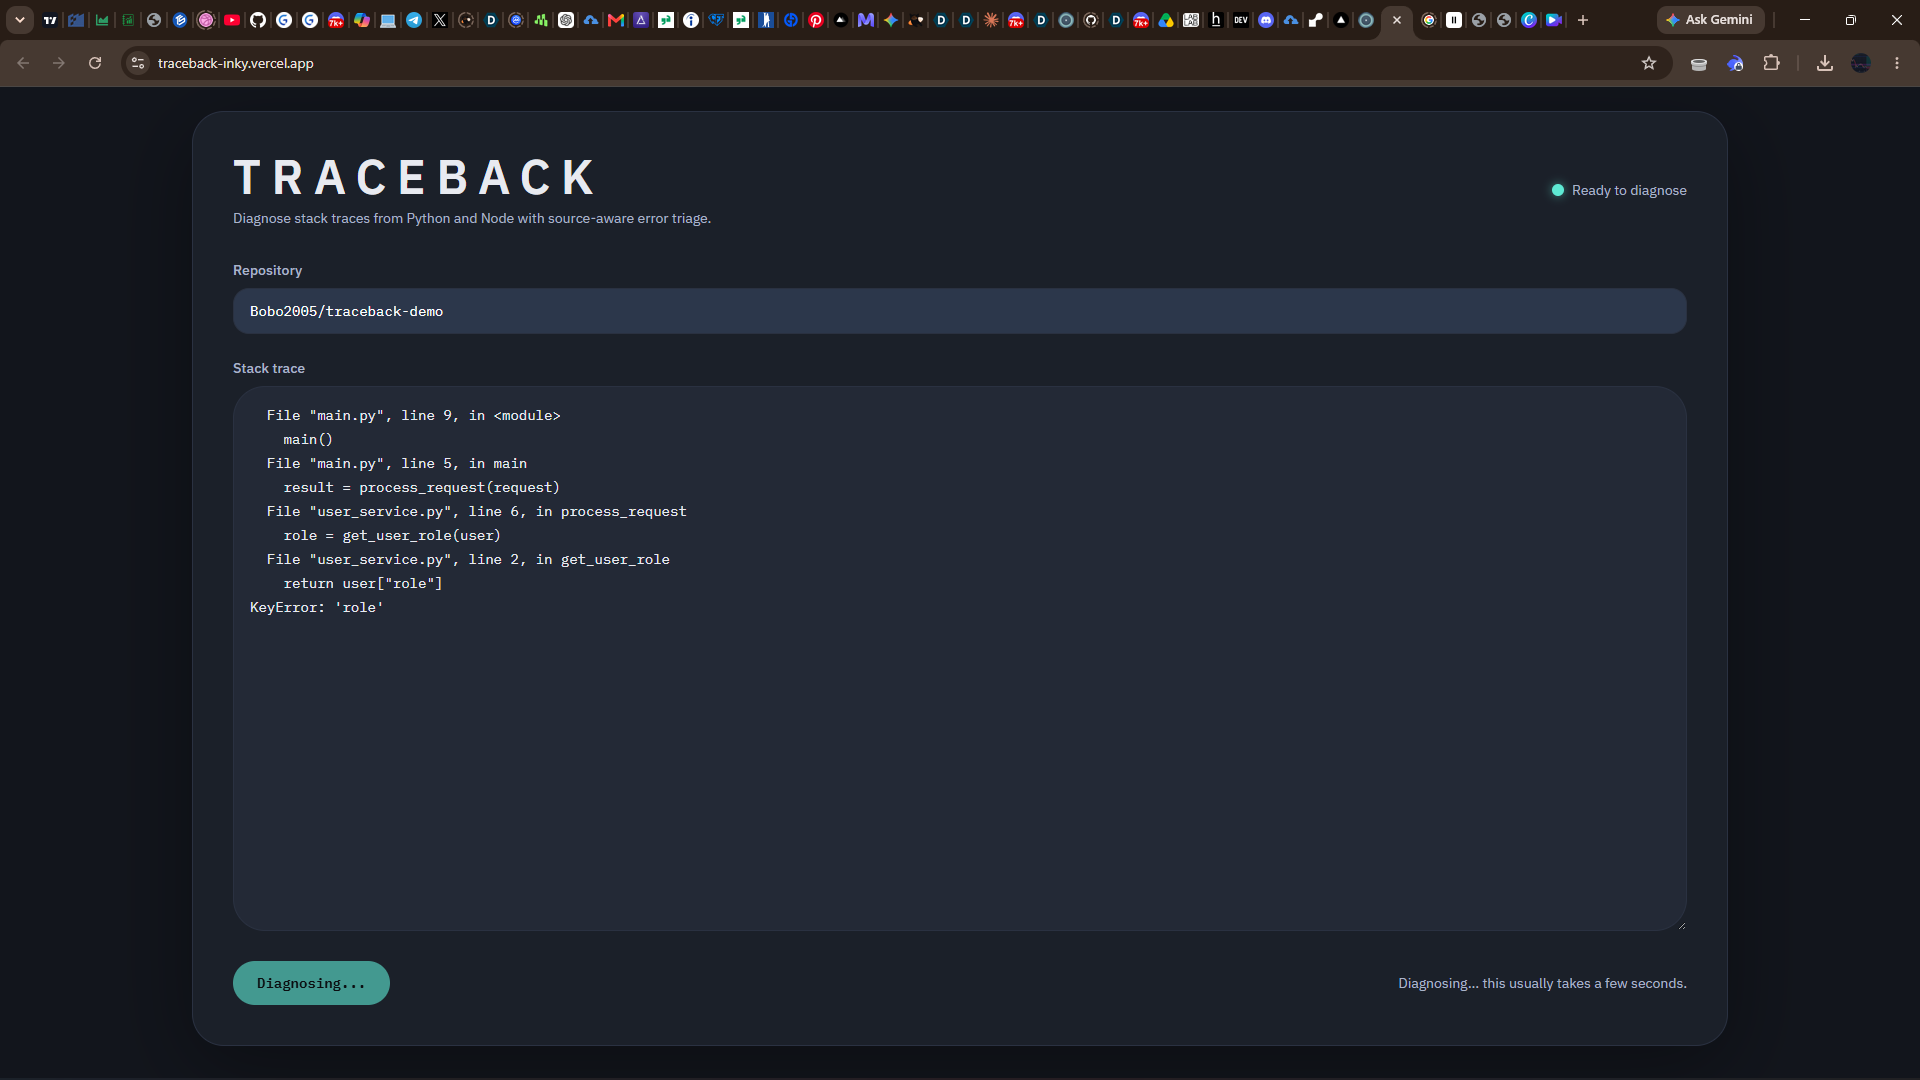
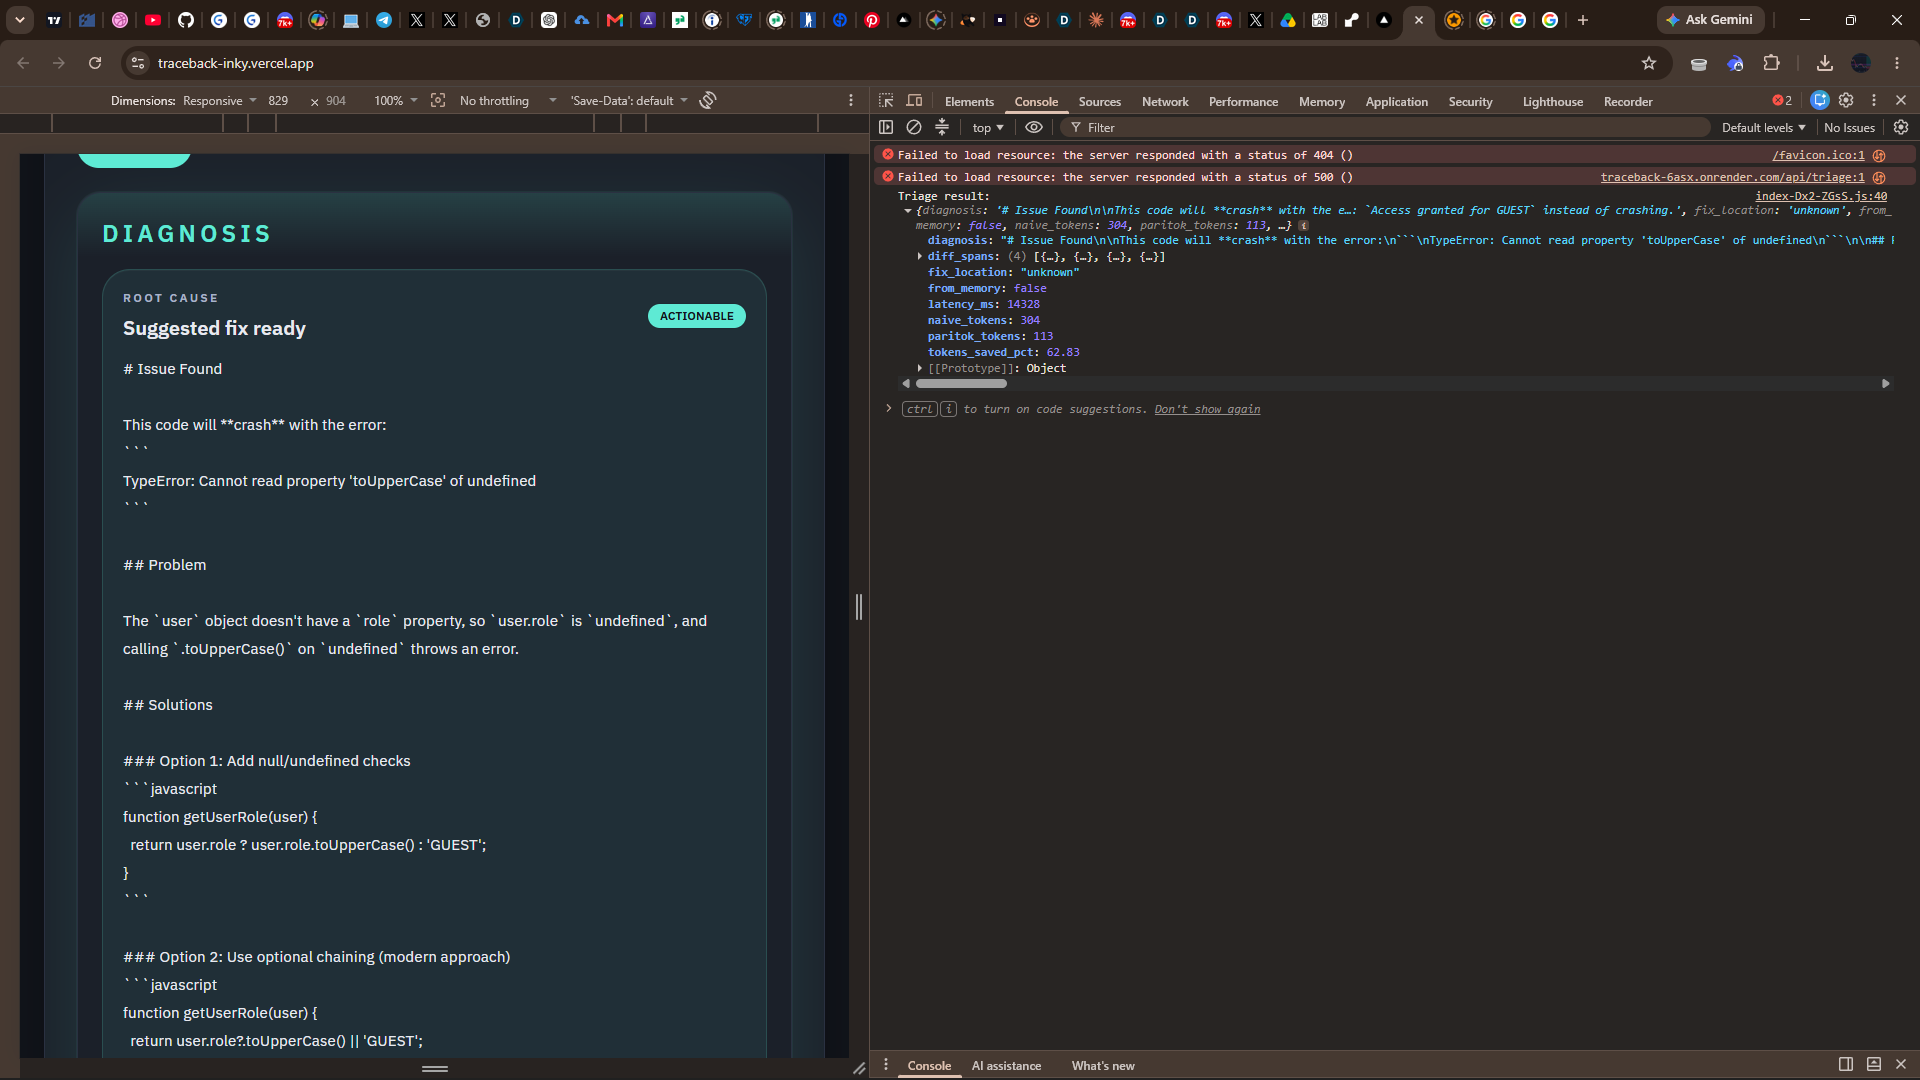
Paste a stack trace and a GitHub repo URL. Traceback parses the trace, pulls the actual referenced source files, and gives you a root-cause diagnosis and a fix location the same way a senior engineer would trace an error back through the code, not just pattern-match the error text.
Two things make it cheap to run:
Compression. Every trace and source file is routed through Paritok's hosted compression before it reaches the model, stripping log noise while preserving file paths, line numbers, and error messages. Memory. Before any LLM call happens, Traceback fingerprints the normalized trace and checks it against errors it's already diagnosed. An exact match returns the prior diagnosis instantly zero tokens, not even a compressed request goes out.
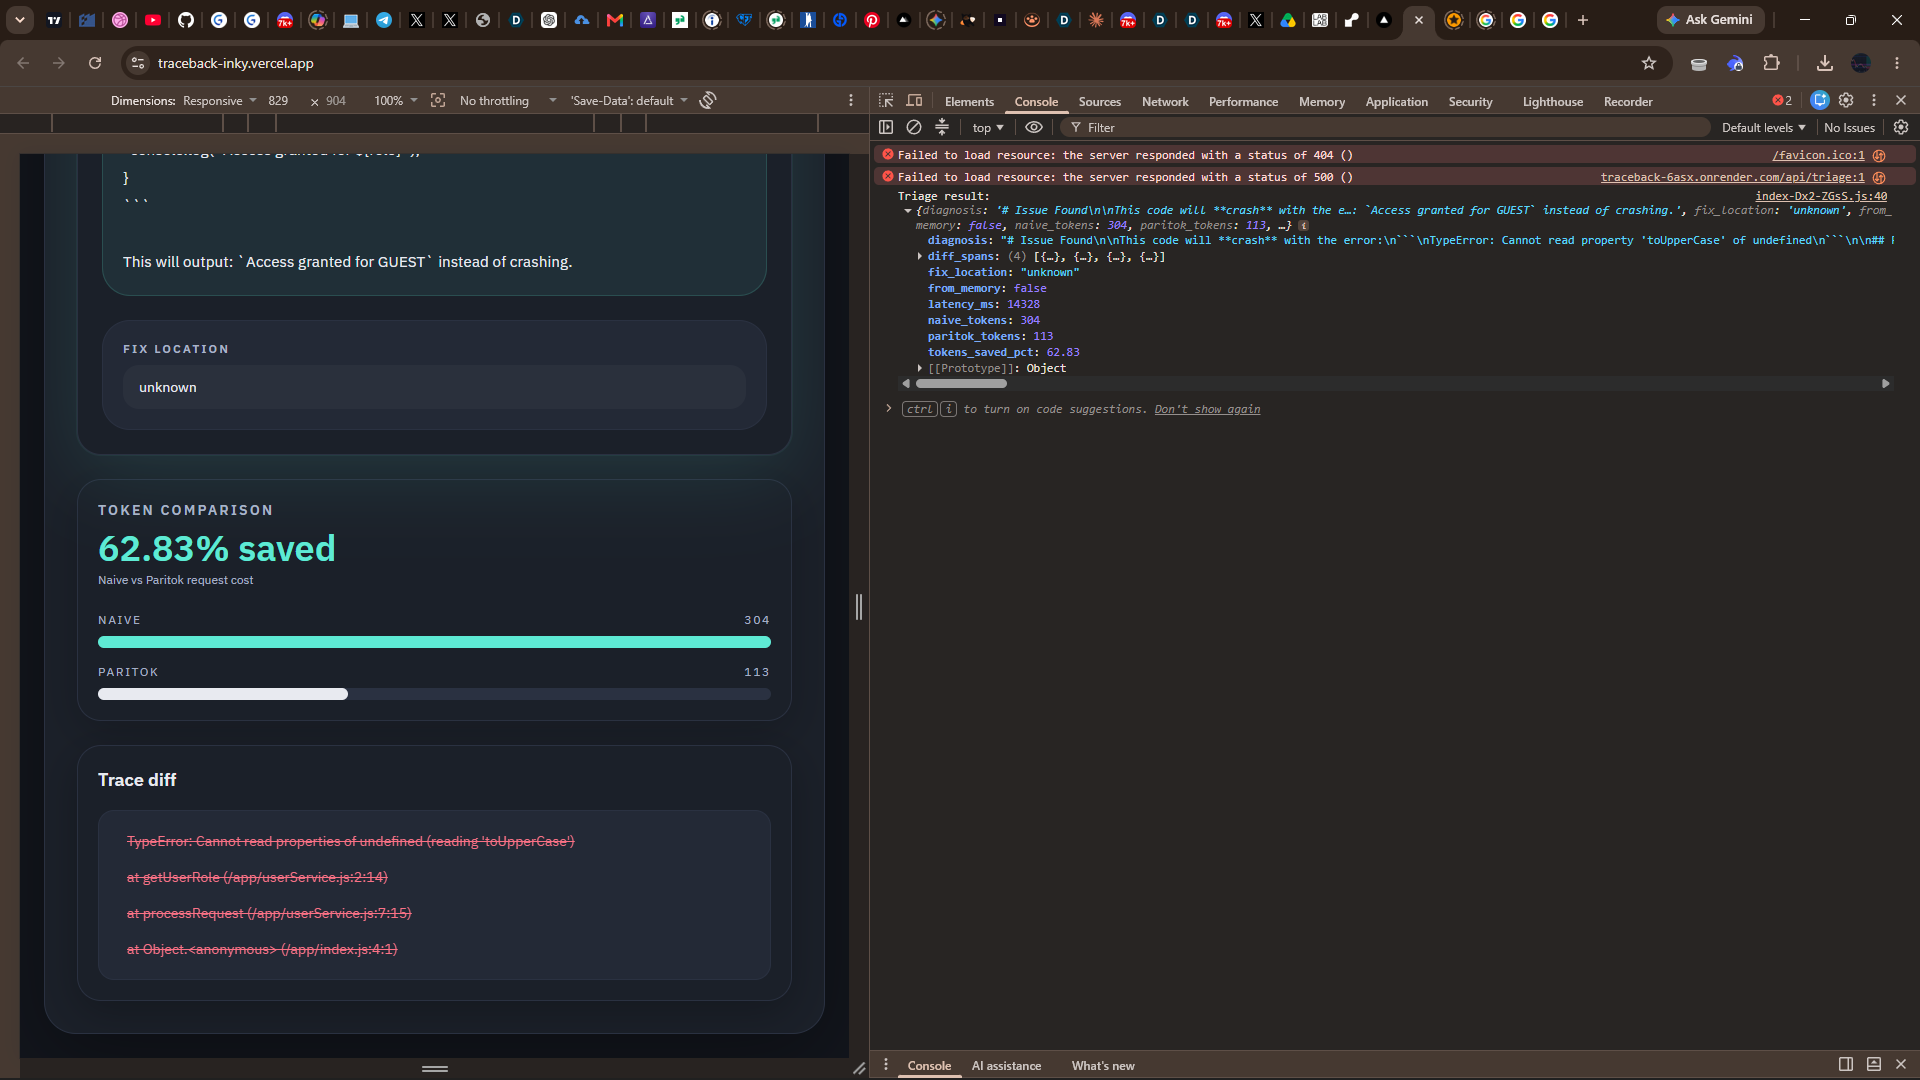
You see both effects on screen: a live diff of what Paritok compressed away, and a token comparison showing the naive baseline versus what actually got sent.
How I built it:
The backend is Python/FastAPI. A parser extracts (file, line, function) references from Python and Node.js stack traces using regex no LLM needed for that step. A fingerprinting function normalizes the trace (stripping timestamps, memory addresses, and variable values while keeping the exception type and the ordered file:line sequence) and hashes it for the memory lookup against a small SQLite store.
If nothing matches, i fetch the referenced files from GitHub, build a single prompt combining the trace and source, and send it two ways: once directly to the provider (Anthropic) as an uncompressed baseline purely for measurement, and once through Paritok's hosted /api/compress endpoint before forwarding the compressed result to the model this is the answer actually shown to the user. Both paths report real input_tokens from the API responses, so the comparison numbers are measured, not estimated.
The frontend is React + Vite with a deliberately un-dashboard-like design: a dark, single-pane diagnostic console built around IBM Plex Mono/Sans, with a signature "trace diff" view that renders the pasted trace back with compressed-away noise struck through and preserved signal highlighted literal visual proof of what Paritok did, not just a percentage in a box.
Deployed on Render (backend) and Vercel (frontend).
Challenges i ran into:
Most of the real debugging time went into getting authentication right across three different services with three different header conventions Anthropic's x-api-key + anthropic-version scheme is nothing like OpenAI's Authorization: Bearer, and it took a few rounds to stop leaking one service's key into another service's request. I also initially built against Anthropic's legacy /v1/complete Text Completions endpoint instead of the current /v1/messages Messages API, which surfaced as a confusing 404 before we caught it.
The other big one: figuring out the right integration shape for Paritok itself. I originally assumed it worked like a retrieval/routing system, then briefly built against a local proxy model (paritok up on 127.0.0.1:8080), before realizing the hosted /api/compress endpoint was the better fit for a service we needed to deploy without a persistent background process. Diagnosing a stubborn request timeout down to an invalid API key silently falling back to "pass-through, uncompressed" rather than erroring outright was a good reminder to always check for silent-success failure modes, not just thrown exceptions.
Accomplishments that i am proud of:
Getting a genuinely two-layer efficiency story working, not just one the memory-hit path returning a correct diagnosis at zero tokens, instantly, for a repeated error, sitting right alongside the real measured compression savings for anything new. Also proud of the trace-diff visualization actually working as a live, honest representation of what got compressed, rather than a decorative stat.
What i learned:
That the cheapest token is the one you never send, and that's worth designing for explicitly rather than treating compression as the only lever. Also relearned, the hard way, that different LLM providers really do have meaningfully different API conventions, and it's worth verifying the exact current endpoint and header shape rather than assuming continuity with an older or more familiar format.
What's next for Traceback:
Broader trace-format support beyond Python and Node (Java, Go, Ruby stack traces), fuzzy/near-match memory lookups instead of exact-fingerprint-only, and multi-file dependency tracing so a diagnosis can follow an error beyond the files directly named in the trace.
Built With
- developertools?debugging??tokenoptimization?promptcompression?aiagents?devtools
- fastapi
- github-api
- httpx
- javascript
- llm
- openiai?rest-api
- paritok?anthropic?claude
- pydantic
- python
- react
- render
- sqlite
- tailwindcss
- uvicorn
- vercel
- vite


Log in or sign up for Devpost to join the conversation.