Inspiration
The dearth of good, publicly available, interpretable statistics on how climate change will impact local areas economically inspired us to try to bridge the gap; we wanted to make it easier for laypeople and climate experts alike to access high-quality statistics that have meaning both in scientific and casual contexts.
What it does
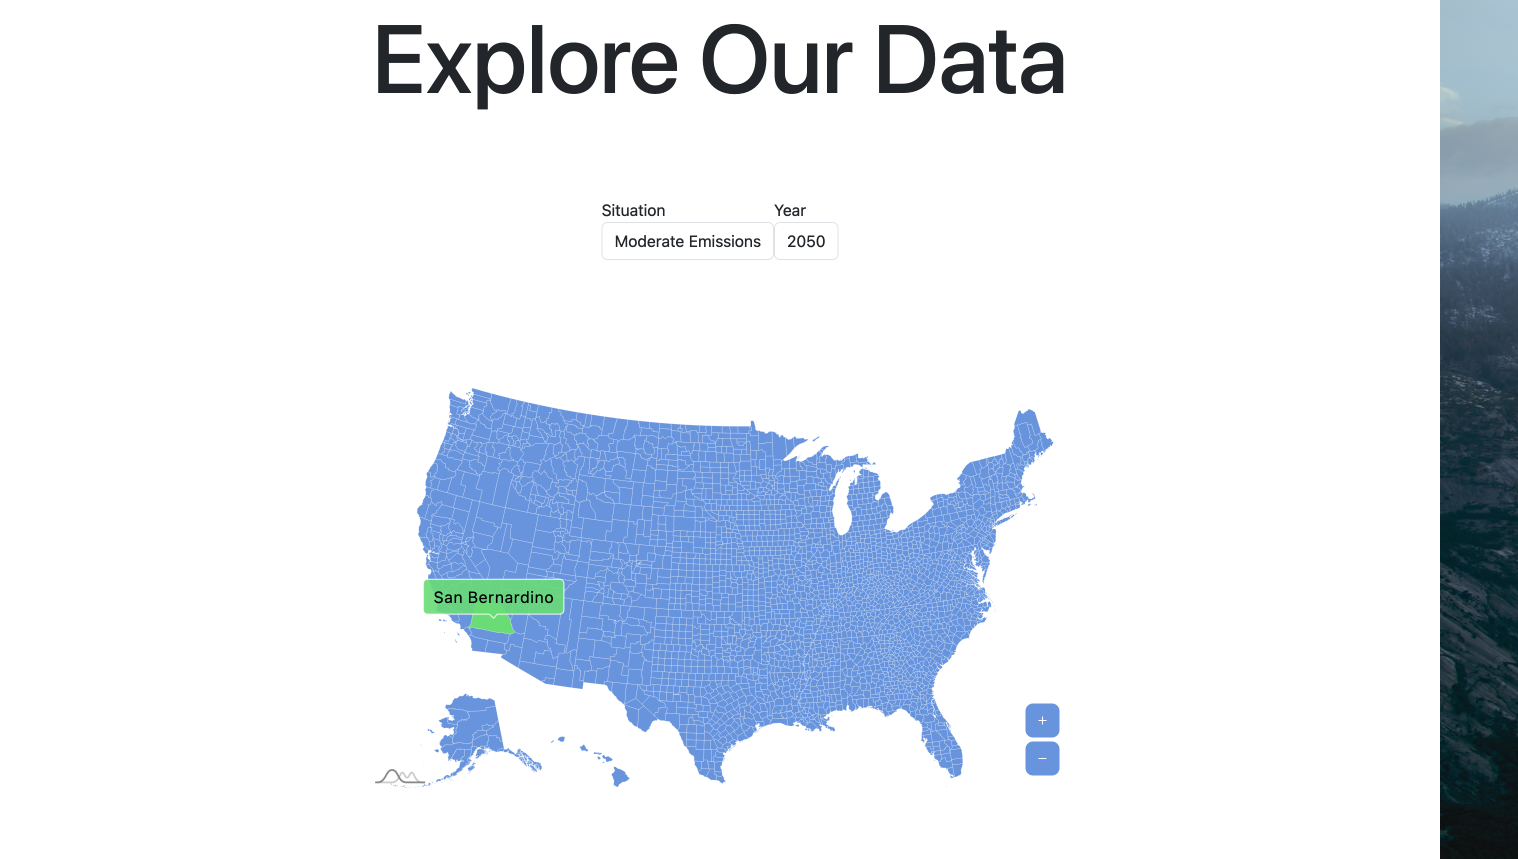
It analyzes various economic factors to build a composite economic impact projection for each county in the United States; it does this in four different cases (high emissions 2050, high emissions 2030, moderate emissions 2050, moderate emissions 2030), so users would have been able to see a visual comparison of projections under different circumstances (unfortunately, we didn't quite finish).
How we built it
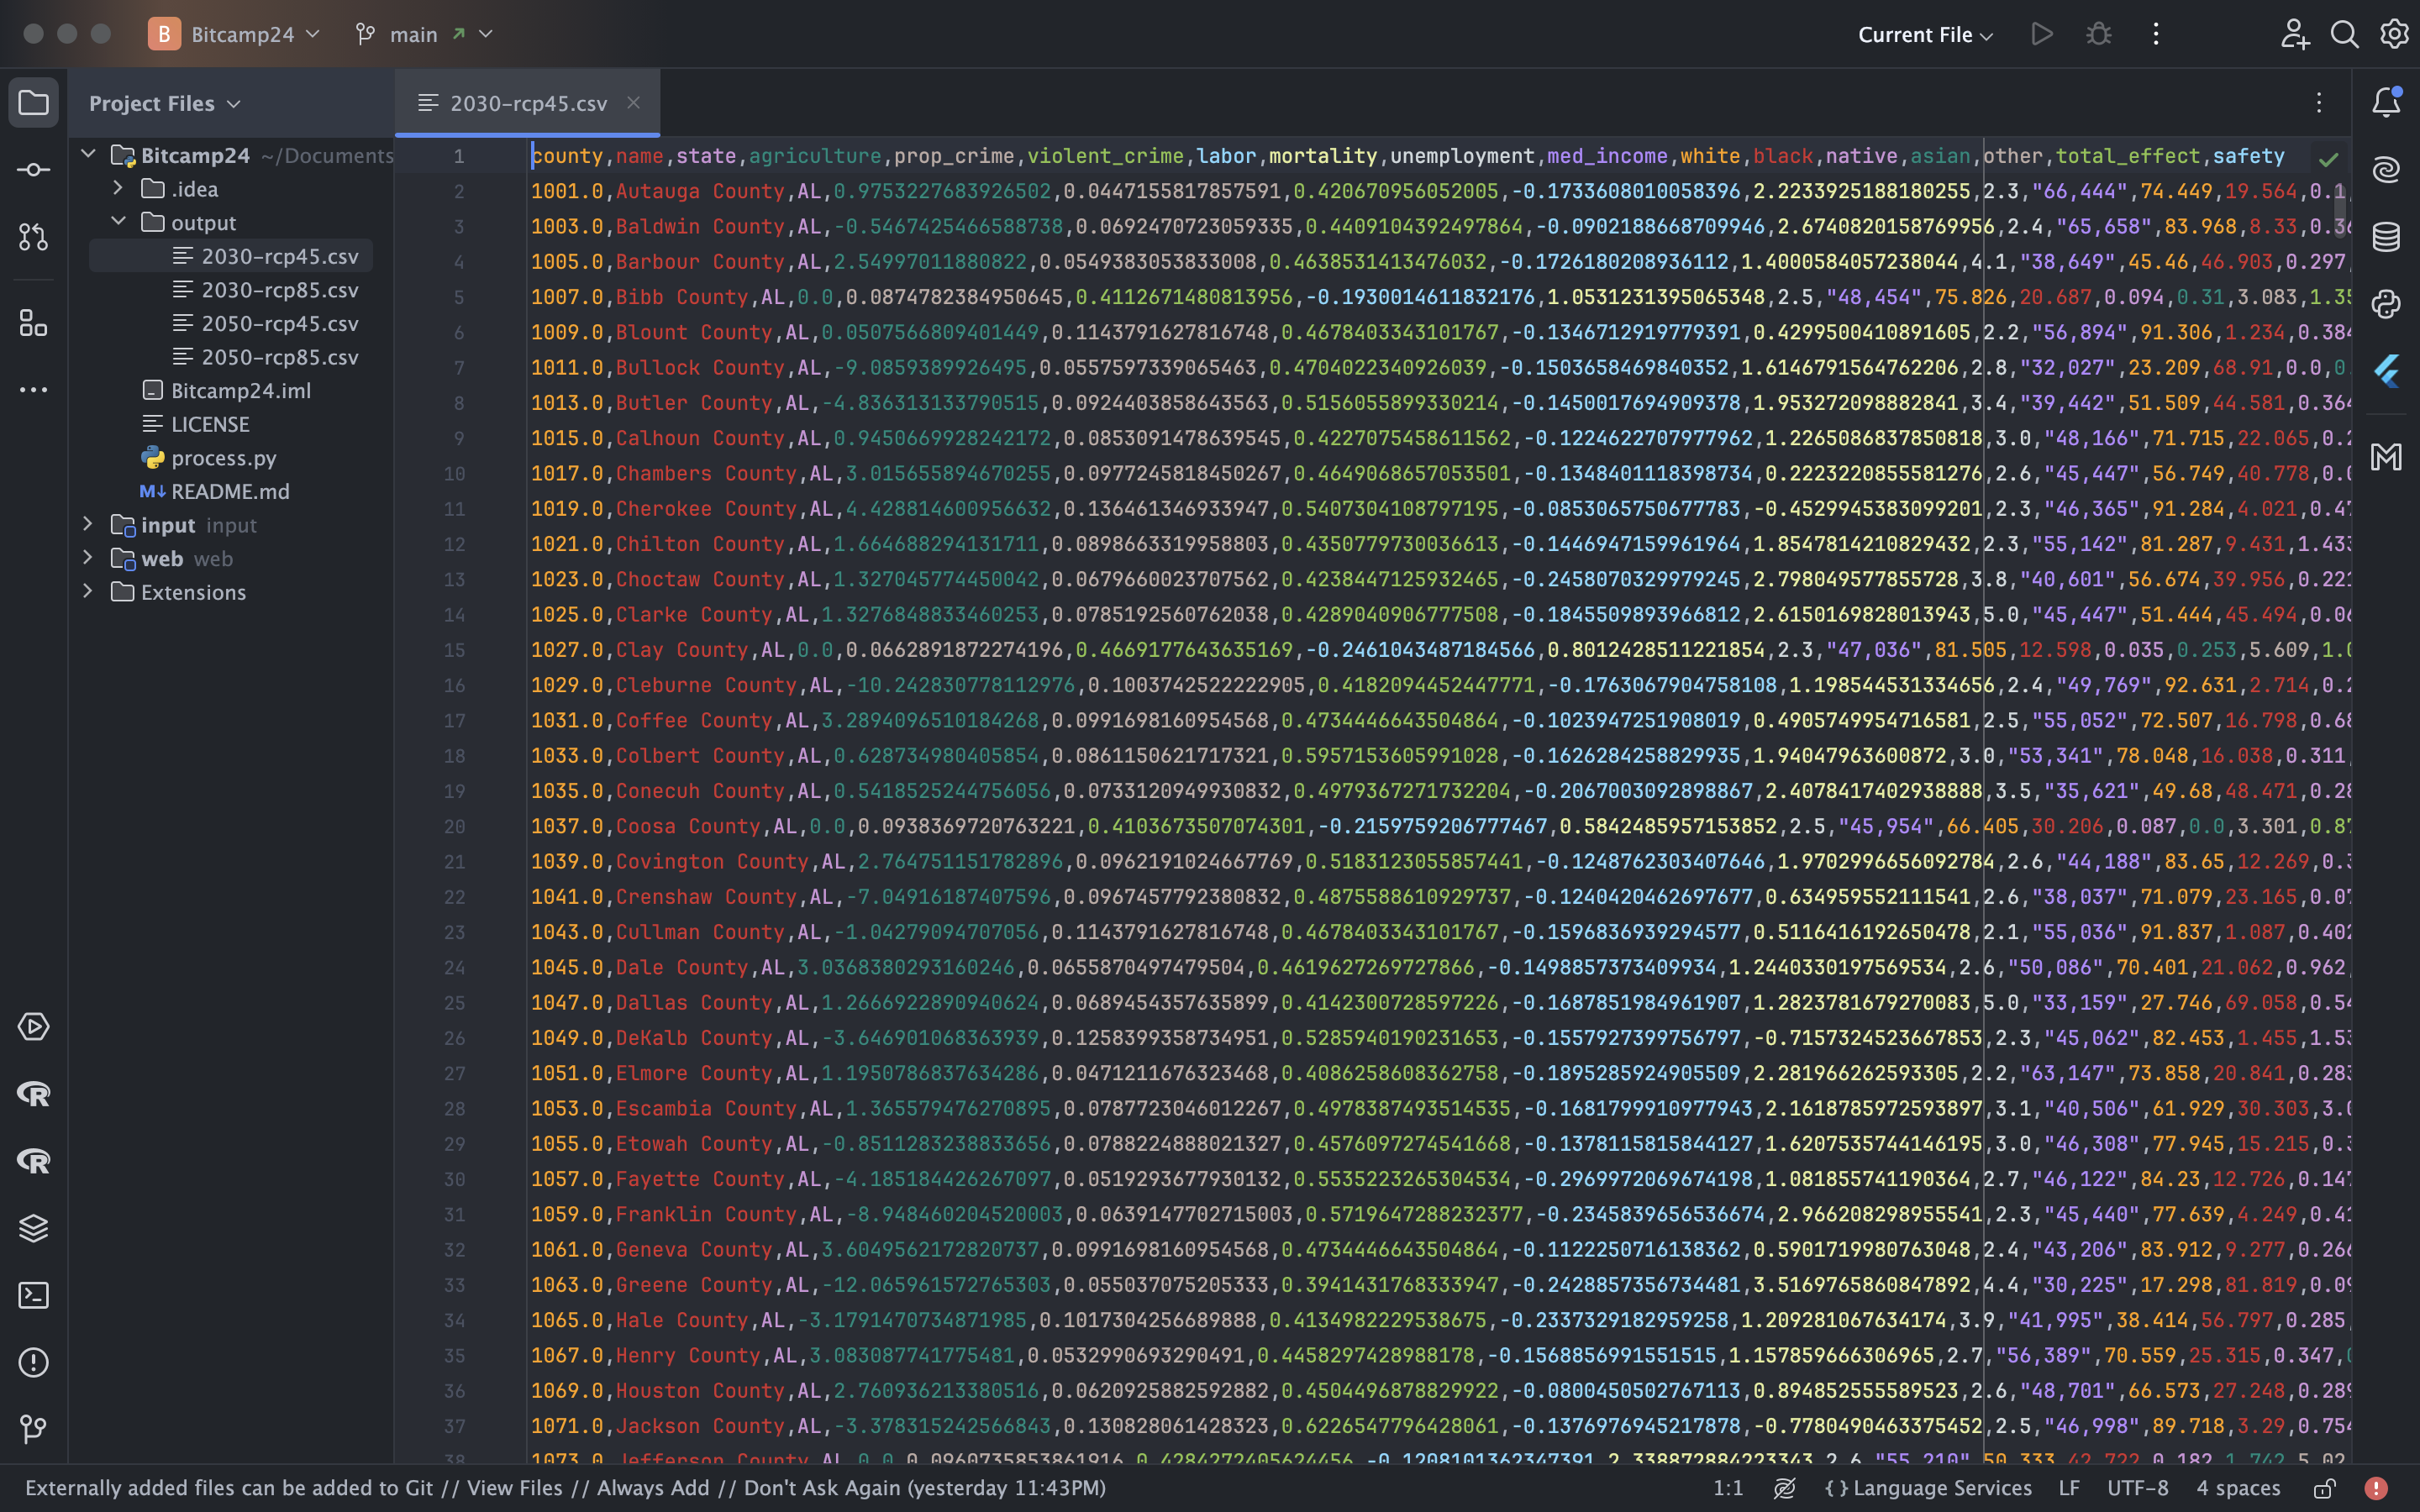
Our goal was a Python data processing stack underneath a React frontend, though we didn't finish the second part. We did statistical data pre-processessing in Matlab, Google Sheets, and Python; and then used Python and numpy to standardize outputs and join tables.
Challenges we ran into
We were probably overly ambitious, as we couldn't get everything to work quite right. The data model proved to be tougher than anticipated, and collating the different economic factors into a single impact model proved troublesome. We would probably simplify the experimental surface if we did the project again today.
Accomplishments that we're proud of
We wrangled all sorts of data into a coherent schema, and have robust, state-of-the-art estimations of climate change's economic impact. We would've built some really cool visualizations with a bit more time.
What we learned
Bite off a bit less to chew and focus more on executing and implementing.


Log in or sign up for Devpost to join the conversation.