-
-
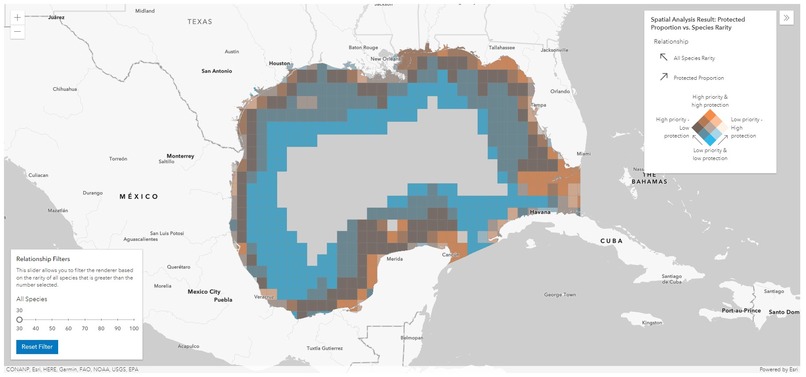
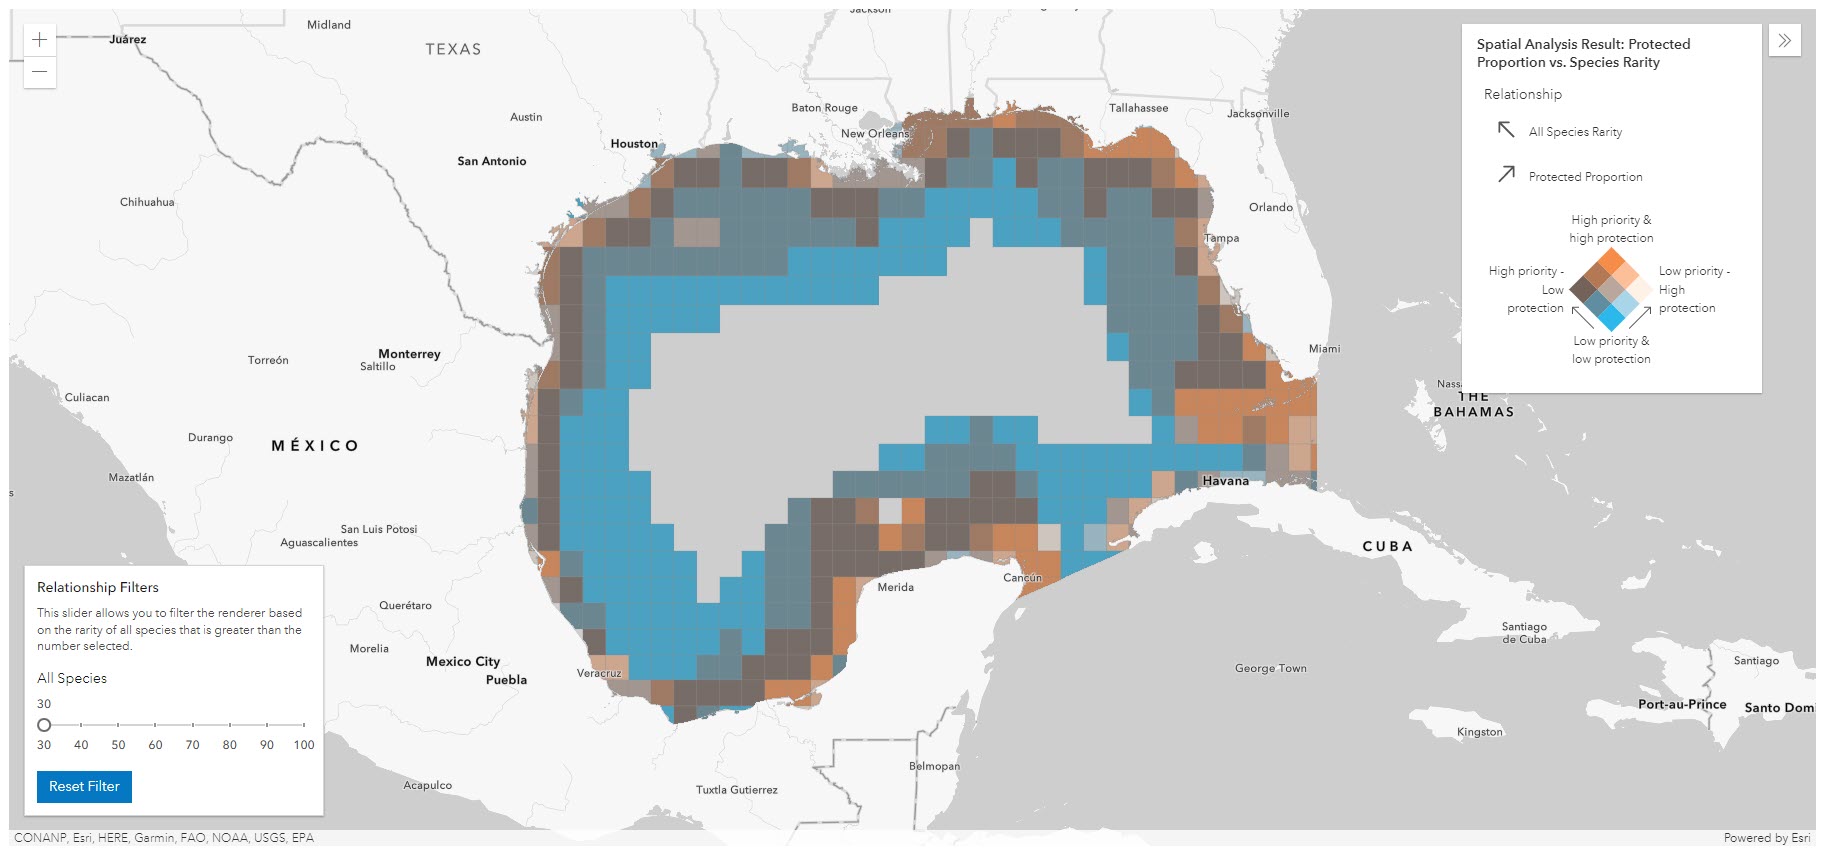
Marine Species Rarity vs. Protection Analysis
-

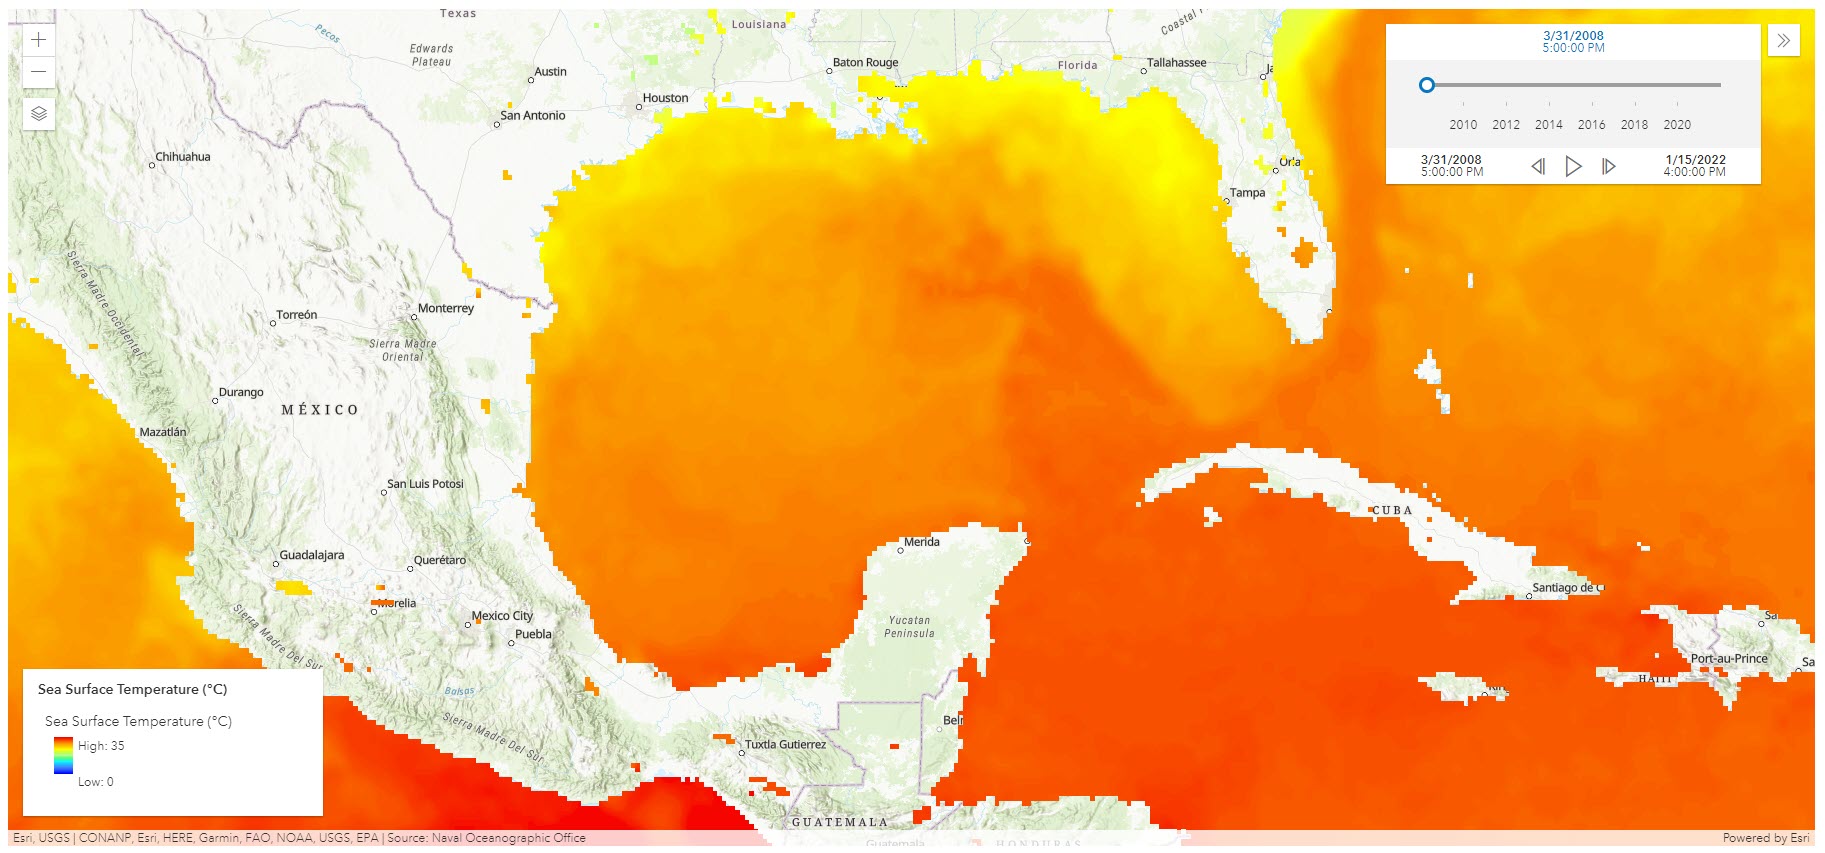
Sea Surface Temperature
-
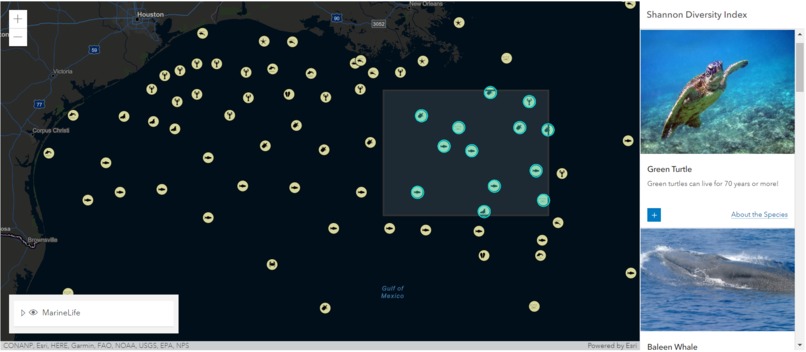
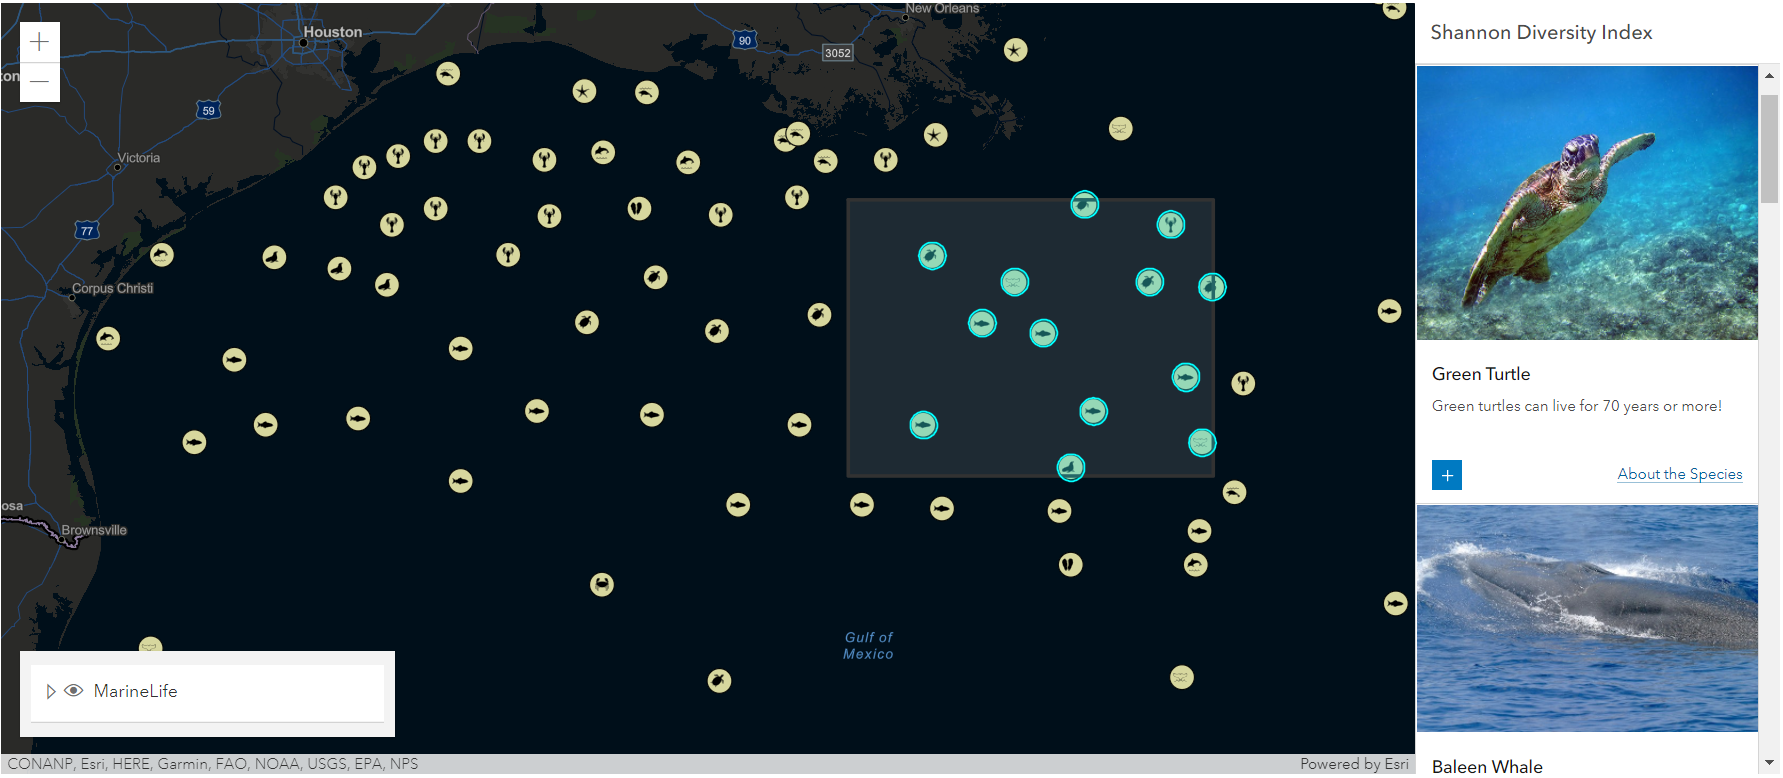
Biodiversity w/ Shannon-Wiener Index
-
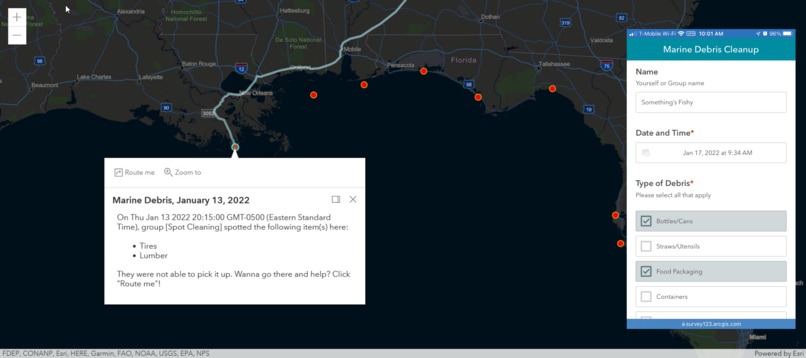
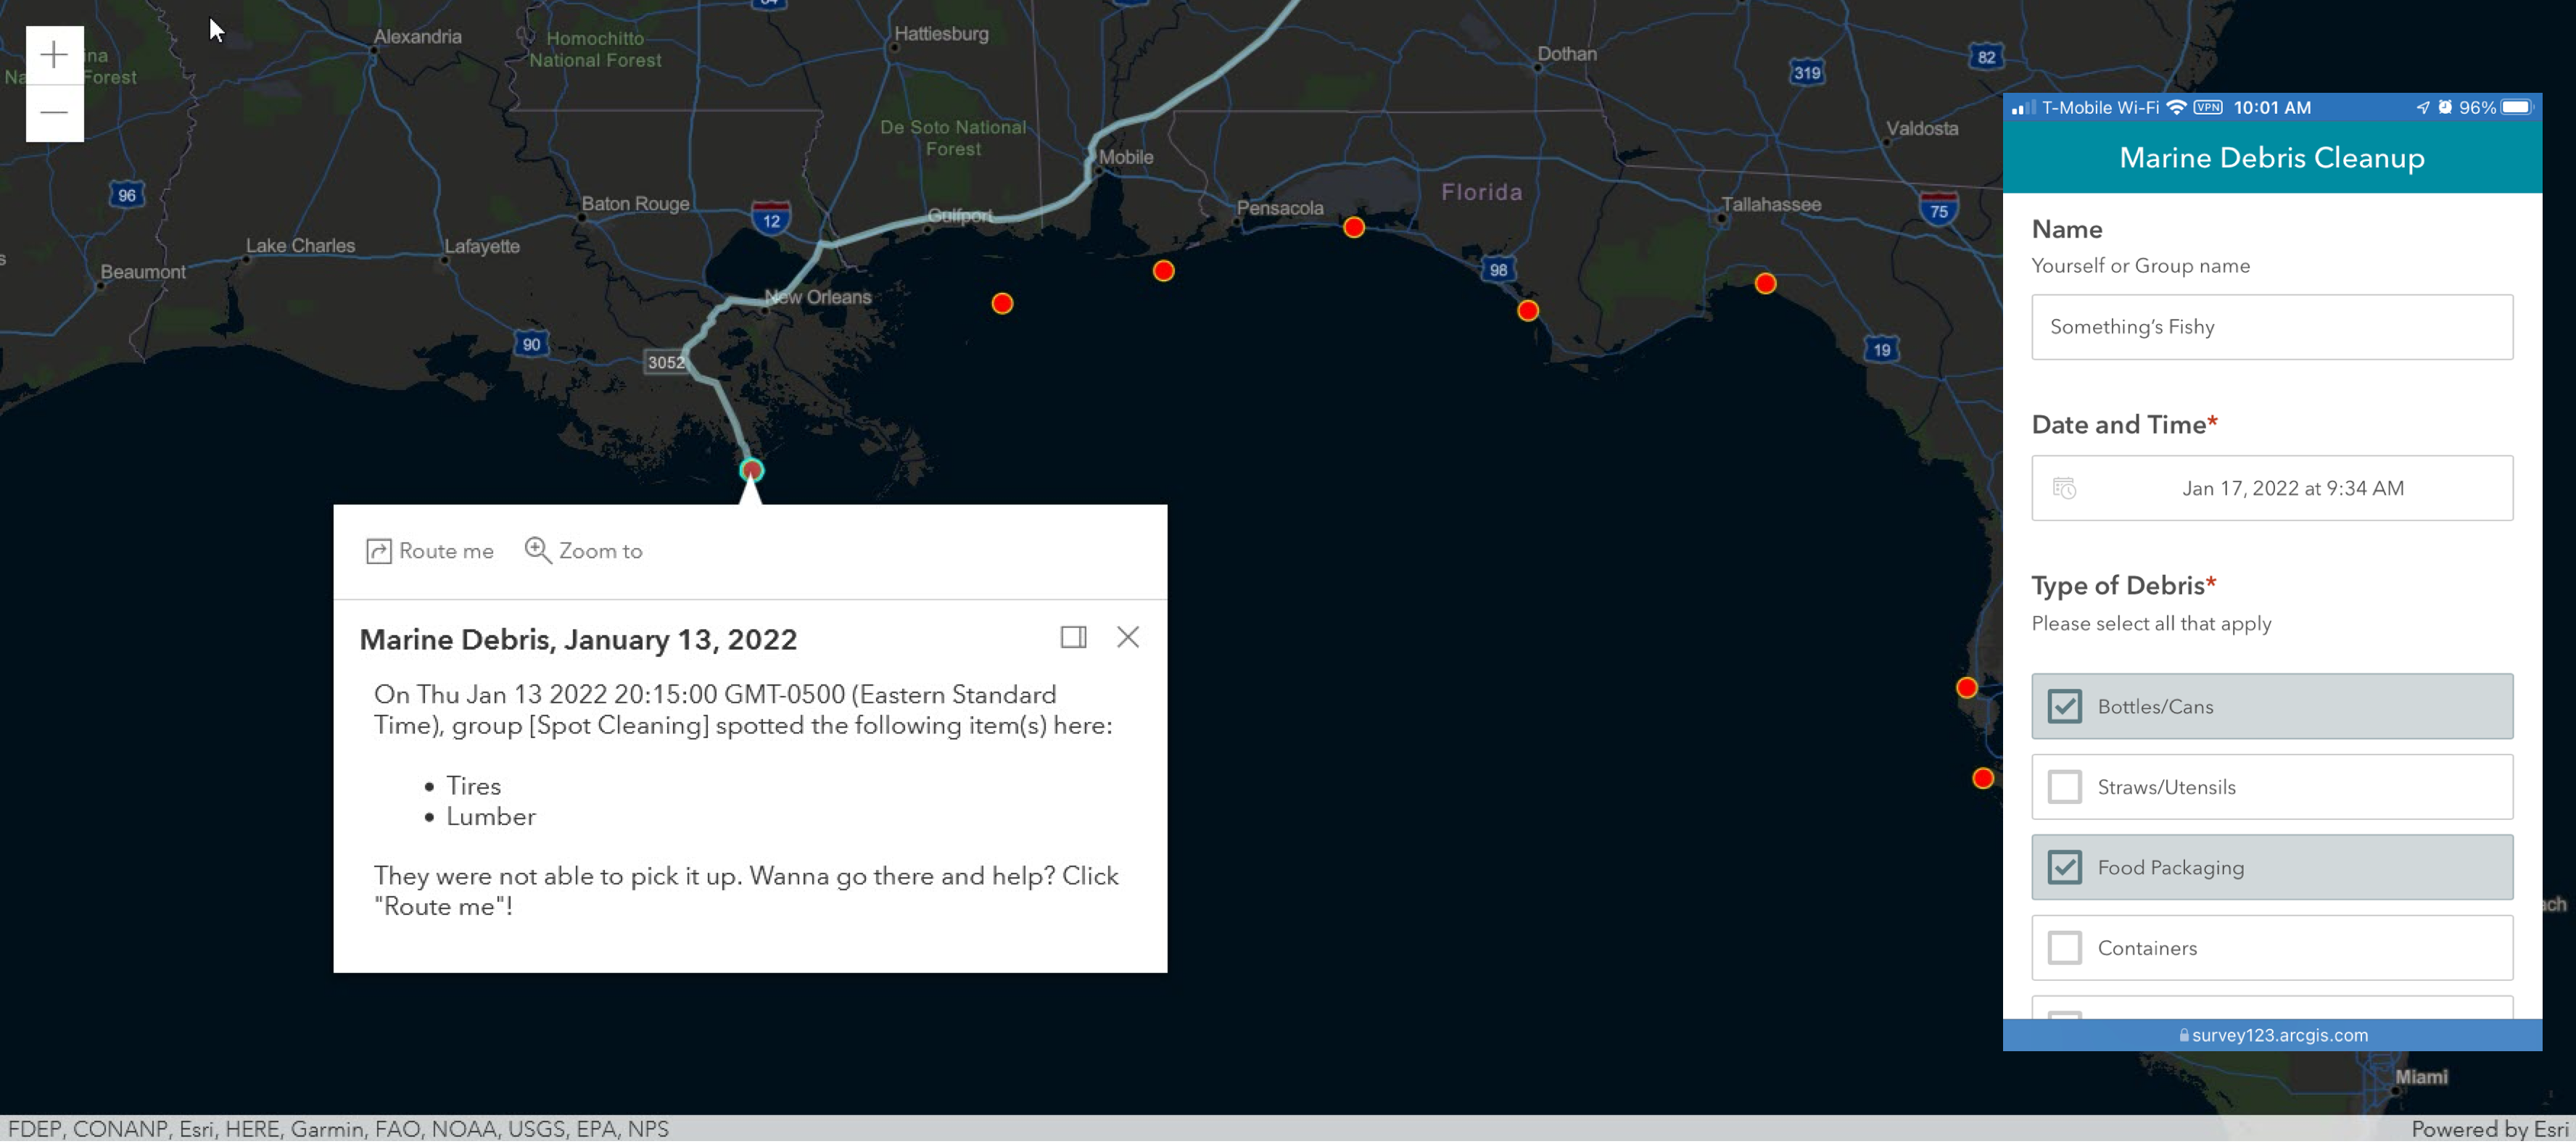
Marine Debris Collection


Category: Sustainability
The Problem
- Global warming may reduce fish and other sea life by 17% by the year 2100. source
- Over the last decade, the rate of plastic consumption [by fish] has doubled, increasing by 2.4 percent every year. source
- 386 marine fish species are known to have ingested plastic debris, including 210 species that are commercially important. source
- Ocean pollution is a widespread, worsening, and poorly controlled problem that is directly affecting human and ecosystem health. source
The Solutions
- Buy local, sustainable fish when possible. source
- Carry a reusable bottle instead of buying single-use plastics. source
- Ask your representatives to create and fund more Marine Protected Areas to save endangered aquatic ecosystems. source
- Volunteer your time to pickup trash at a local beach (more info below). source
- Reduce greenhouse gas emissions one step at a time. source
Pickup Marine Debris
If you see something, pick it up and/or let others know!
According to National Ocean Service, marine debris is defined as any persistent solid material that is manufactured or processed and directly or indirectly, intentionally or unintentionally, disposed of or abandoned into the marine environment or the Great Lakes. There is no part of the world left untouched by debris and its impacts. It is one of the most widespread pollution problems facing the world's ocean and waterways. source
The mapping application shows marine debris data points that we collected via ArcGIS Survey123. Click on the points to see further details (debris type, photo, etc.) in a pop-up. Click on other places on the map to see demographic data of the area (if they are available).
Access the survey with this link, this shortened link, or scan this QR code with your phone!
Inspirations
Conserve and sustainably use the oceans, seas and marine resources for sustainable development. source
Recent news and events on climate change such as the recent Tongan Volcano eruption, Kentucky tornados, the Colorado wildfires, and east coast flooding.
What it does
Investigates the impact of human influence on aquatic ecosystems in the Gulf of Mexico.
Shows spatial analysis results of how much area has been marked as protected in relation to the species rarity score.

Collects marine debris locations and details from the public; maps the debris records with demographic data and generates routes from end-users' location to the location of the debris records.
Includes an interactive experience with an application that allows users to use a scientific formula to measure species diversity (Shannon-Wiener Index). It educates on biodiversity, its importance, and the human impact from recent studies.
Allows visualization of Sea Surface Temperature over the last decade.

How we built it
Used ArcGIS Platform location services to analyze data collected from ArcGIS Online and federal agency websites.
Created the marine debris survey using ArcGIS Survey123
Utilized the ArcGIS API for JavaScript to create interactive mapping applications and styled them with the Calcite Design System.
Split up the project into different parts and used Git/Github to collaborate.
Challenges
During spatial analysis data creation, we ran into a bug that would not allow running a spatial analysis tool more than two times. To overcome this, we used another developer account to run the analysis task.
Styling some of the components of the application was challenging at times.
Formatting requests with Postman and the Spatial Analysis services.
Securing the API key on a public site.
Accomplishments
Built a website that shows information about marine sustainability, focused on the Gulf of Mexico, using ArcGIS Platform services including spatial analysis, geoenrichment, geocoding, routing, data hosting, etc.
Published a public survey where people can record marine debris they spotted and/or picked up.
Created an educational tool that will help bring awareness of the problems facing our oceans and provide resources to help take action.
What we learned
We learned how scientists measure species diversity in specific areas. We learned how to use diversity indexes like the Shannon-Wiener Index to mathematically measure and compare species diversity among communities.
How to secure API keys for a public-facing application.
How heavily humans have impacted the aquatic ecosystem.
Next steps
Adding more data as factors that could affect some of the data in our applications. For example, adding a layer for ocean salinity, ocean acidity, and pollution into some of the applications. There are more factors contributing to sustainability issues in our oceans that we did not have time to illustrate.
Create a script to generate the data from the ArcGIS Platform location services.
Run statistics from the marine debris data once we have more survey submissions.
Donate a dollar to charity for each piece of debris picked up.
Integrate more filters on the Marine Species Rarity vs. Protected Area Map
Route to the closest land point when the debris is in the ocean.
Spatial Analysis: How are we doing in protecting rare species’ living areas?
Mapping data sources
Global Marine Species Patterns (55km), by Map of Life (MoL) source
WDPA - World Database of Protected Areas, by UN Environment World Conservation Monitoring Centre source
Gulf of Mexico region with GSHHS and/or NaturalEarth shorelines, by GSHHG - A Global Self-consistent, Hierarchical, High-resolution Geography Database source
Depth Contour at multiple intervals of GEBCO 2020 Bathymetry - Gulf of Mexico, by GCOOS - Gulf of Mexico Coastal Ocean Observing System source
Sea Surface Temperature (°C), by Naval Oceanographic Office source
Biodiversity. Cofrin Center for Biodiversity. Retrieved Jan 17, 2022. source
Hancock, L. What is Biodiversity. WorldWildlife.org. source
Dominance diversity. Retrieved Jan 17, 2022. source
Kubiak, L. (2019, May 6) Marine Biodiversity in Dangerous Decline, Finds New Report. NRDC. source
Ocean warming. International Union for Conservation of Nature. Retrieved Jan 17, 2022. source
Global Greenhouse Gas Emissions Data. United States Environmental Protection Agency. Retrieved Jan 17, 2022. source
How do We Reduce Greenhouse Gases? UCAR Center for Science Education. Retrieved Jan 17, 2022. source
Built With
- arcgis-js-api
- arcgis-platform
- arcgis-rest-js
- calcite-components
- eslint
- husky
- react
- react-lazyload
- styled-components
- typescript
- vercel


Log in or sign up for Devpost to join the conversation.