Forge Sentinel: Process Assurance for 3D-Printed Titanium Brackets
Problem and Use Case.
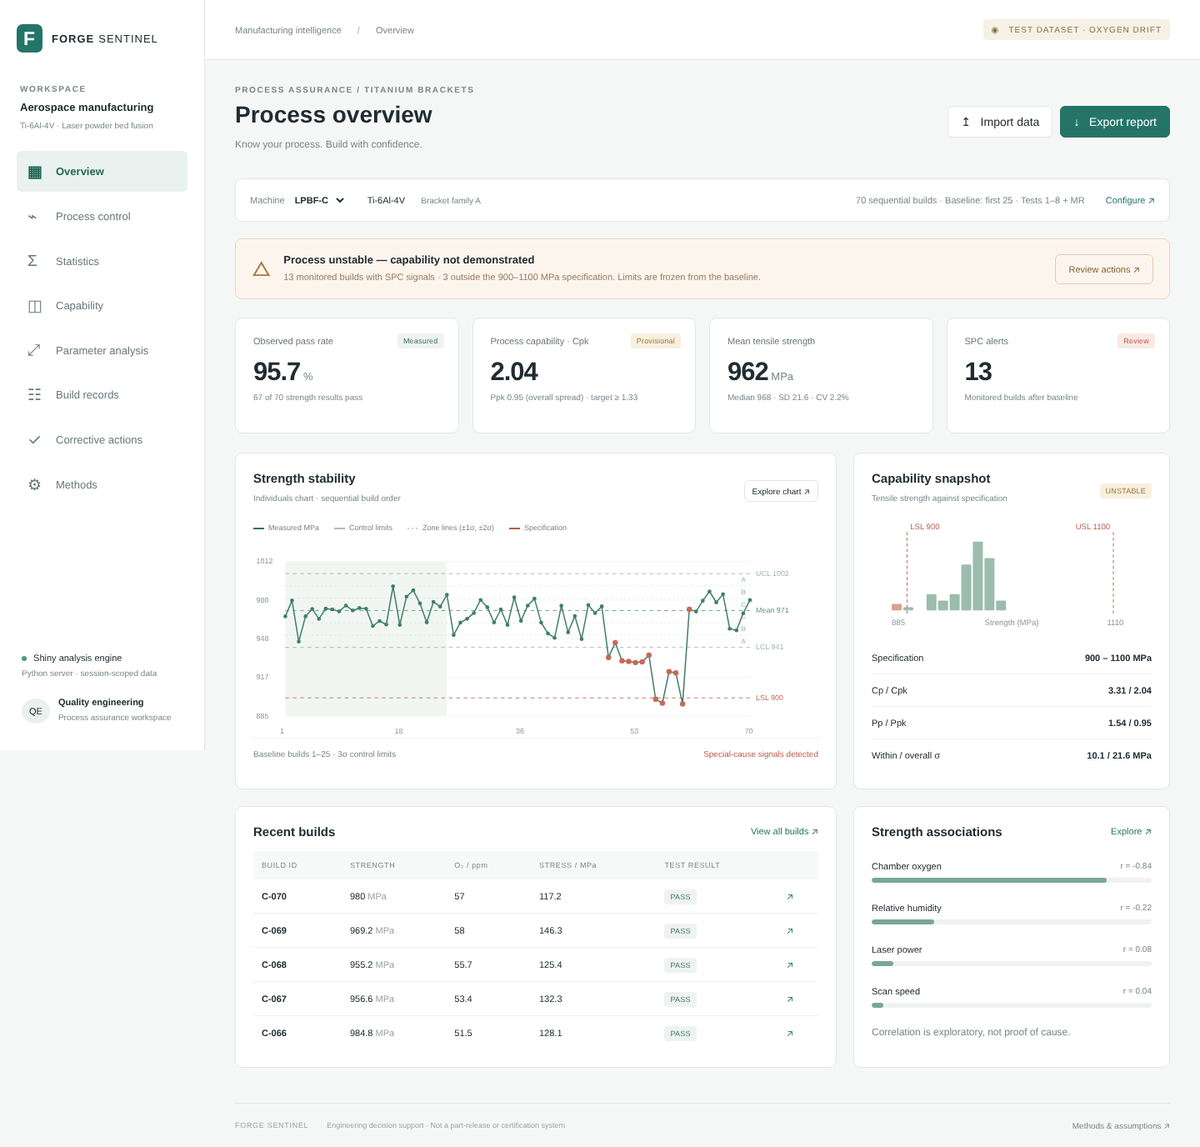
An aerospace contractor printing Ti-6Al-4V brackets by laser powder bed fusion (LPBF) is failing its client's tensile-strength acceptance tests, but does not track enough process data to know when or why. Forge Sentinel is a web dashboard, built with Shiny for Python, that lets the contractor's quality engineer monitor whether the printing process is stable and capable of meeting the specification, flag when it changes, and find and fix the cause.
Inputs
The tool needs only three columns that every contractor [should] already have: build ID, machine, and the tensile strength from the client test. Data can be uploaded as CSV or Excel. Optional process columns (chamber oxygen, humidity, plate temperature, laser power, scan speed, residual stress) unlock root-cause analysis, and an optional coupon column accepts several test coupons per build.
Quality-control Analysis:
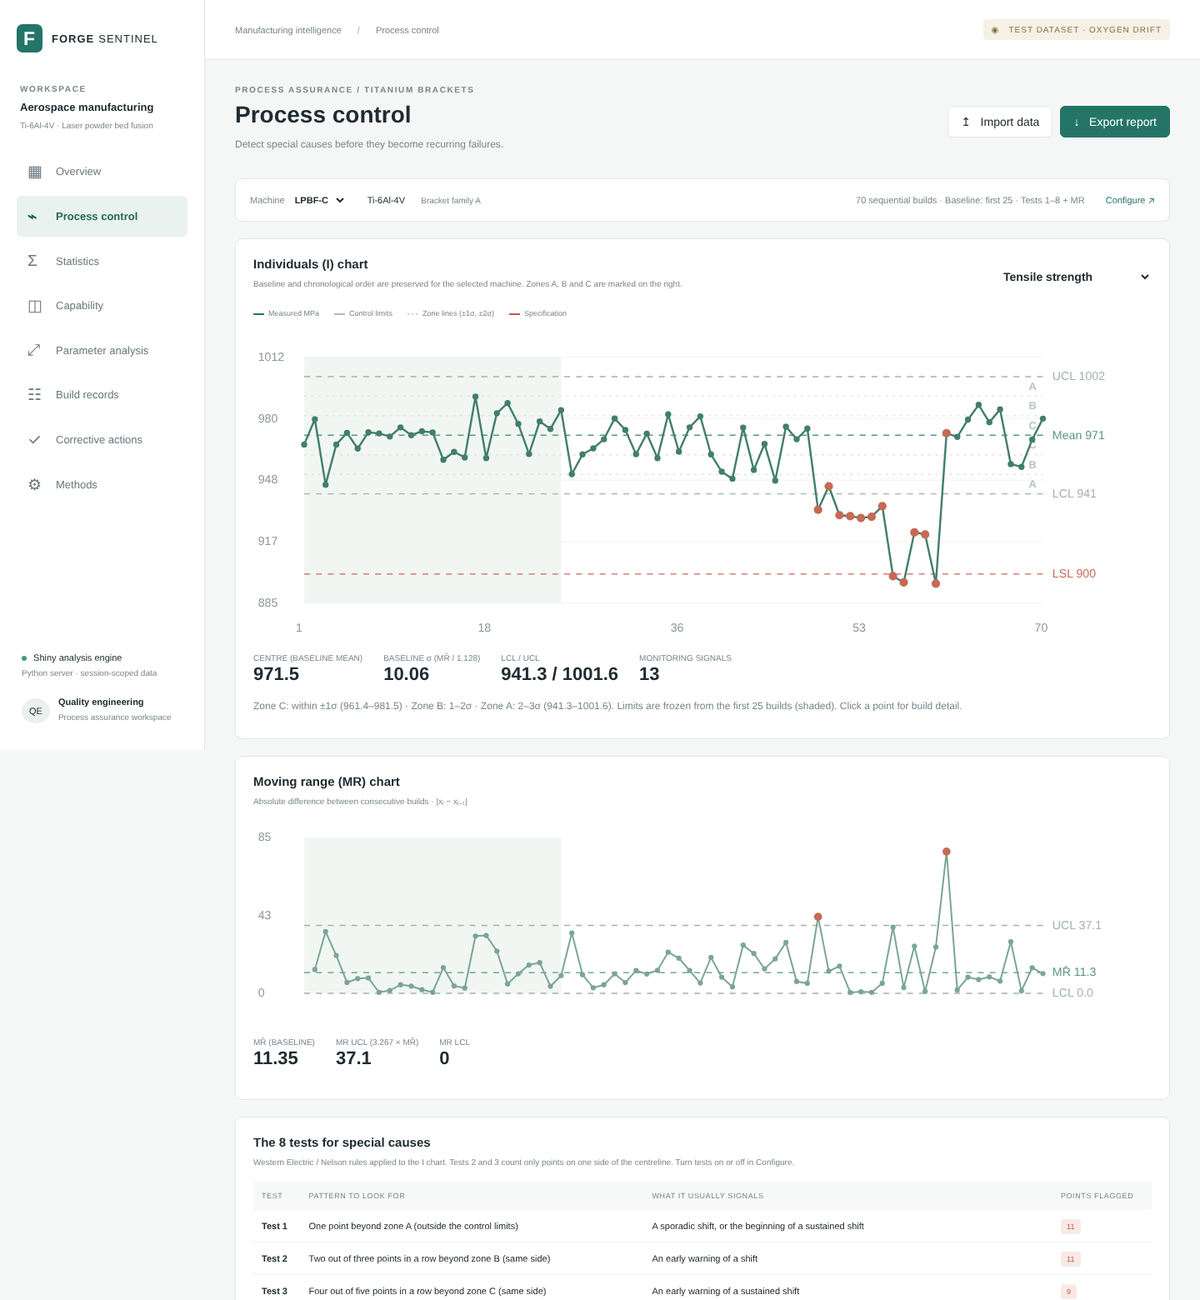
- Control charts: Individuals and moving-range (I-MR) charts for one result per build, and X̄ and S charts when several coupons per build are recorded. Limits are frozen from a baseline period and checked with all eight Western Electric/Nelson tests for special causes.
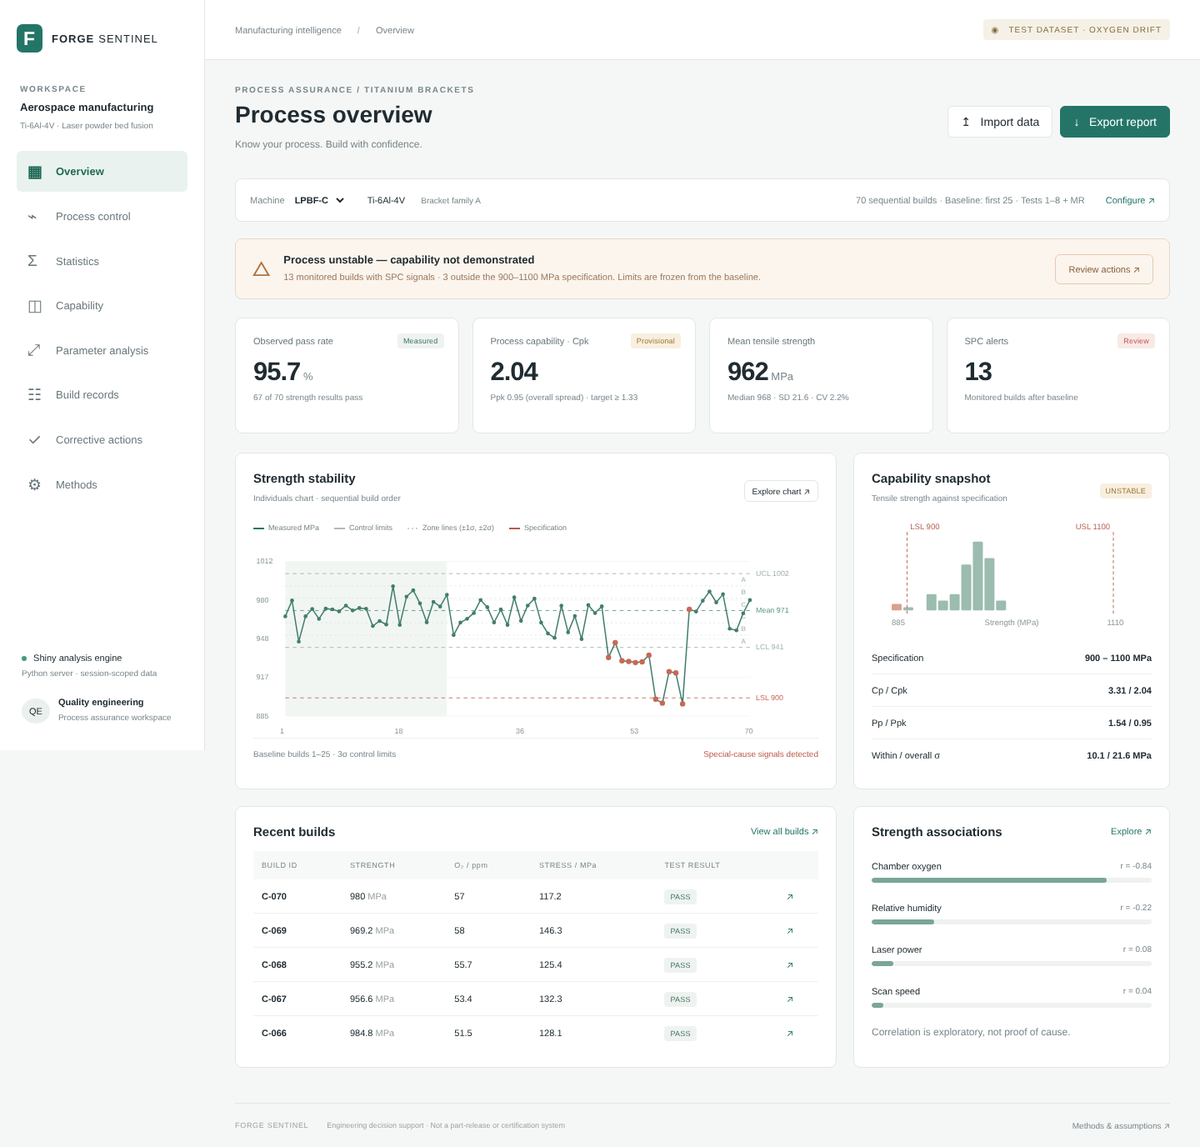
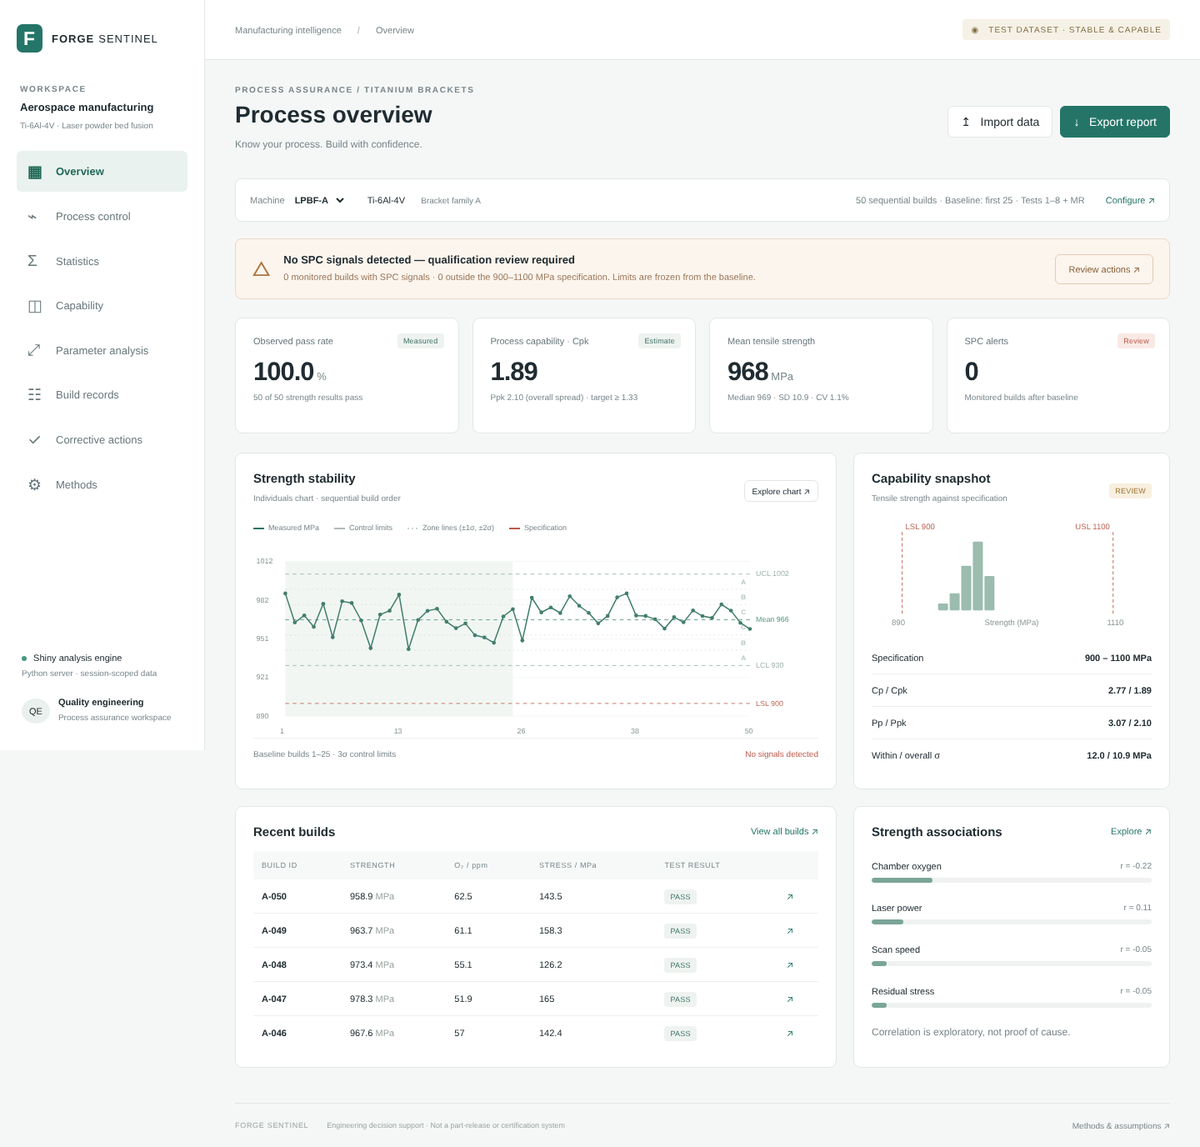
- Capability: Cp, Cpk, Pp and Ppk against configurable specification limits, with the observed pass rate and its 95% Wilson interval.
- Distribution Checks: Histograms with fitted normal curves, normal probability (Q-Q) plots, the Anderson-Darling normality test, and expected versus observed parts per million out of specification. The tool warns when non-normal data make capability figures unreliable.
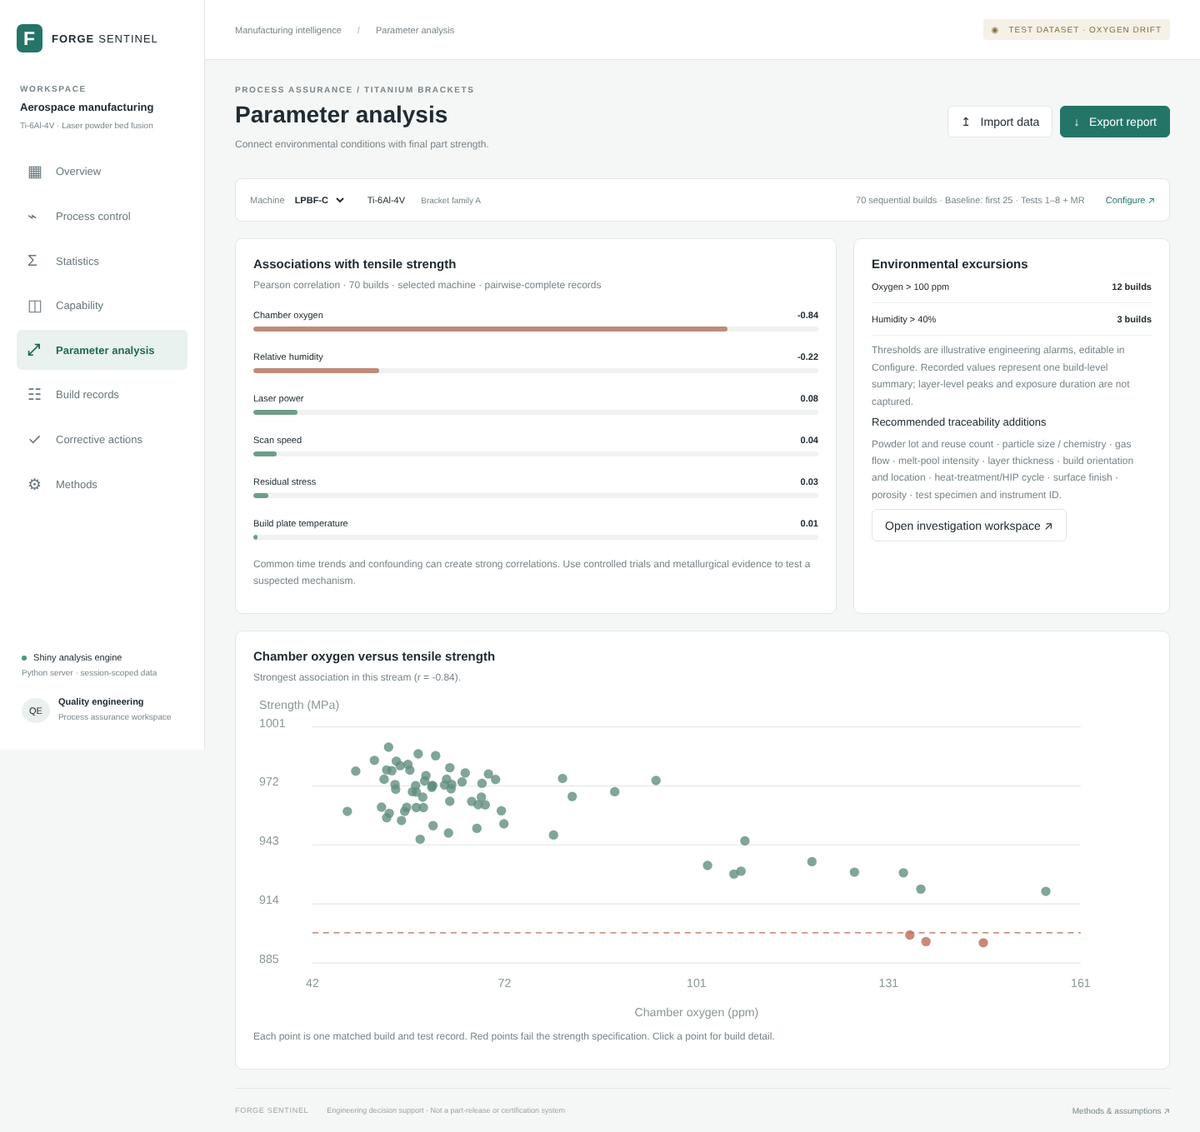
- Descriptive statistics and root cause: Mean, median, standard deviation, variance, coefficient of variation, standard error, range and IQR for every variable, plus correlations that rank process variables as likely causes and flag early warnings.
Why This Matters
We want to help contractors resolve issues and figure out where the issues are. Signals are currently linked to a corrective-action register (containment, chamber atmosphere, material and thermal history, verification). One click exports a printable PDF report, a formatted Excel workbook with a native control chart, or machine-readable JSON.
Future Improvements
Current, our corrective-action register is stored locally. Future work and testing could include integrating a workflow manager such as JIRA, Monday, or Workflow so that a ticket or PTR (Problem Trouble Report), or story can be created to track and investigate the problem to the respective stakeholder.
Logistics
Demonstration and reproducibility. Demo link walkthrough: link
Four documented test datasets, generated with fixed seeds and described in a codebook, show a stable process, an oxygen leak that the tool traces to its cause five builds before strength fails, a strength-only data set, and a four-coupon-per-build case where the S chart detects uneven gas flow four builds before the X̄ chart. Seventy automated tests check the statistics against published control-chart constants, SciPy and hand-worked examples.
Links. Live app · Source code, documentation and test data on GitHub

Log in or sign up for Devpost to join the conversation.