-
-
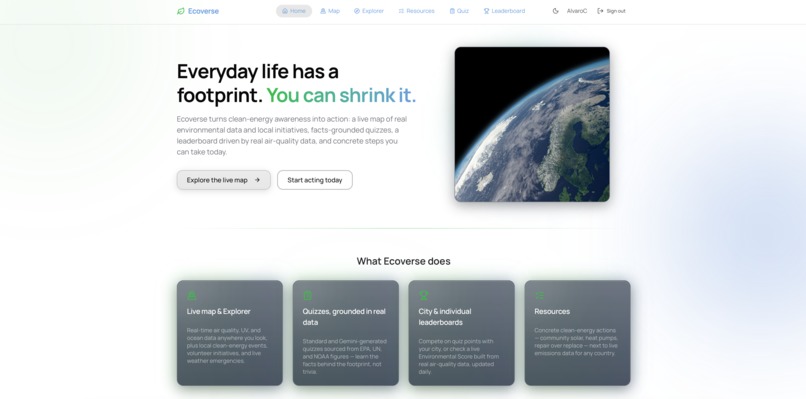
Home Page
-
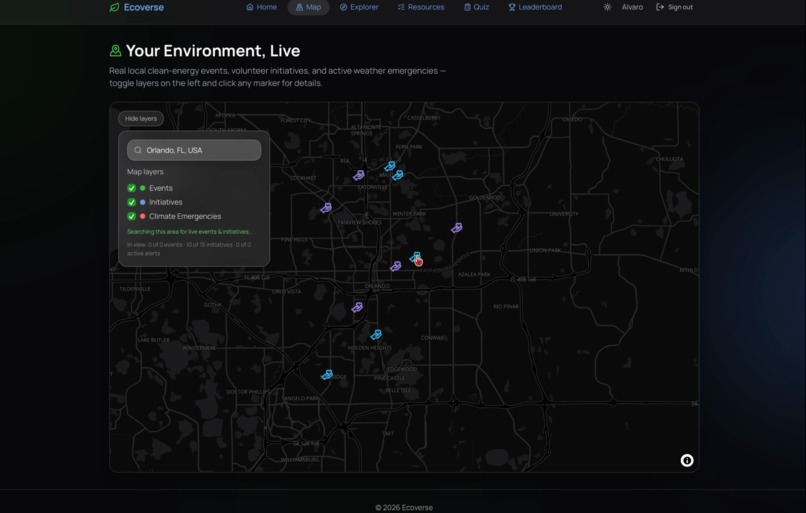
Finding local initiatives/volunteering opportunities
-
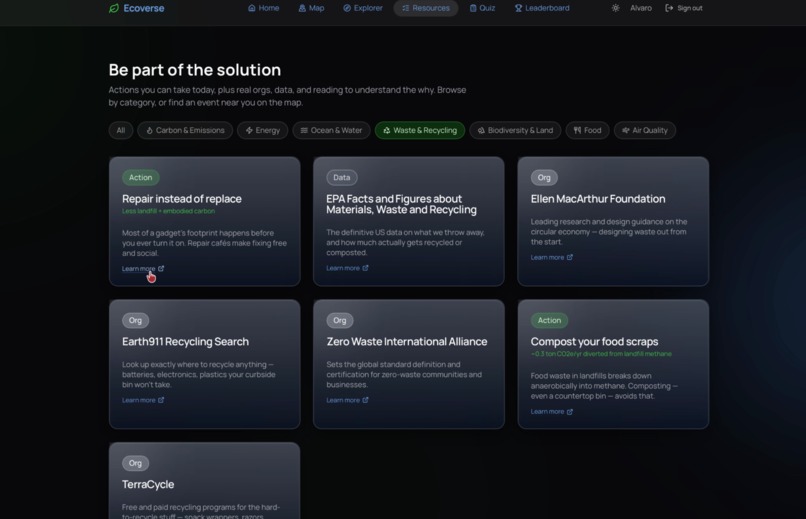
Find new resources
-
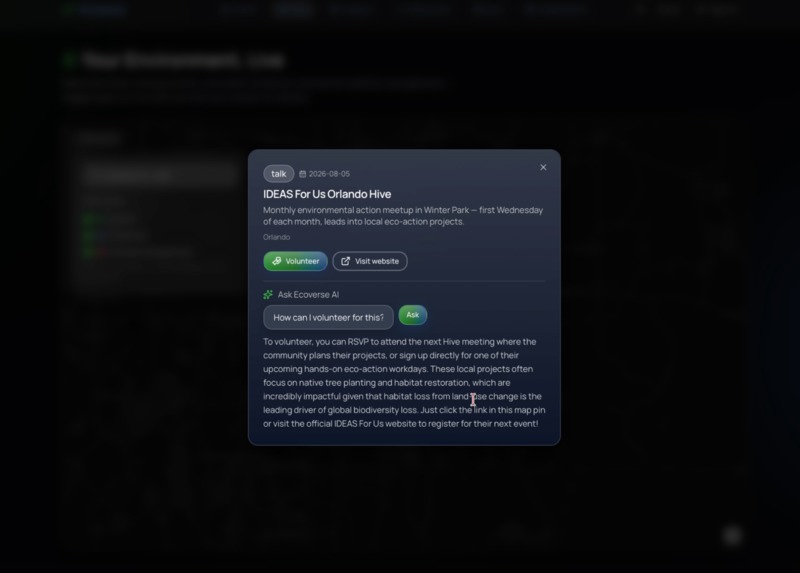
Asking Gemini for more information
-
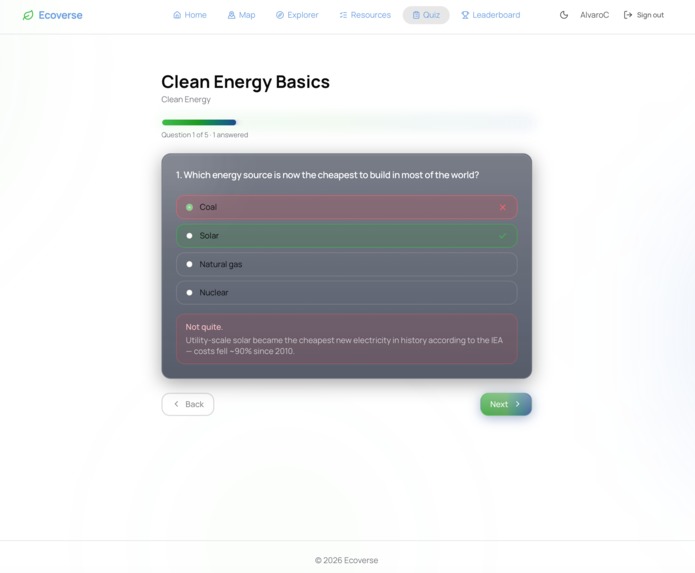
Quizzing yourself
-
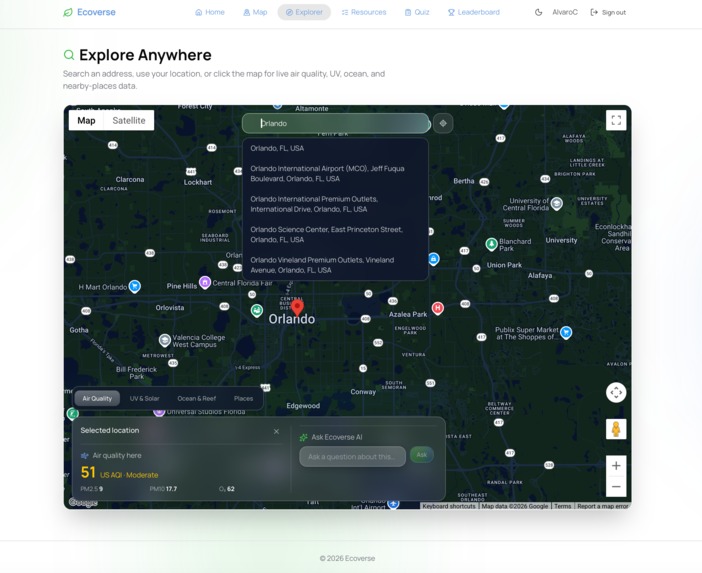
Searching up an area
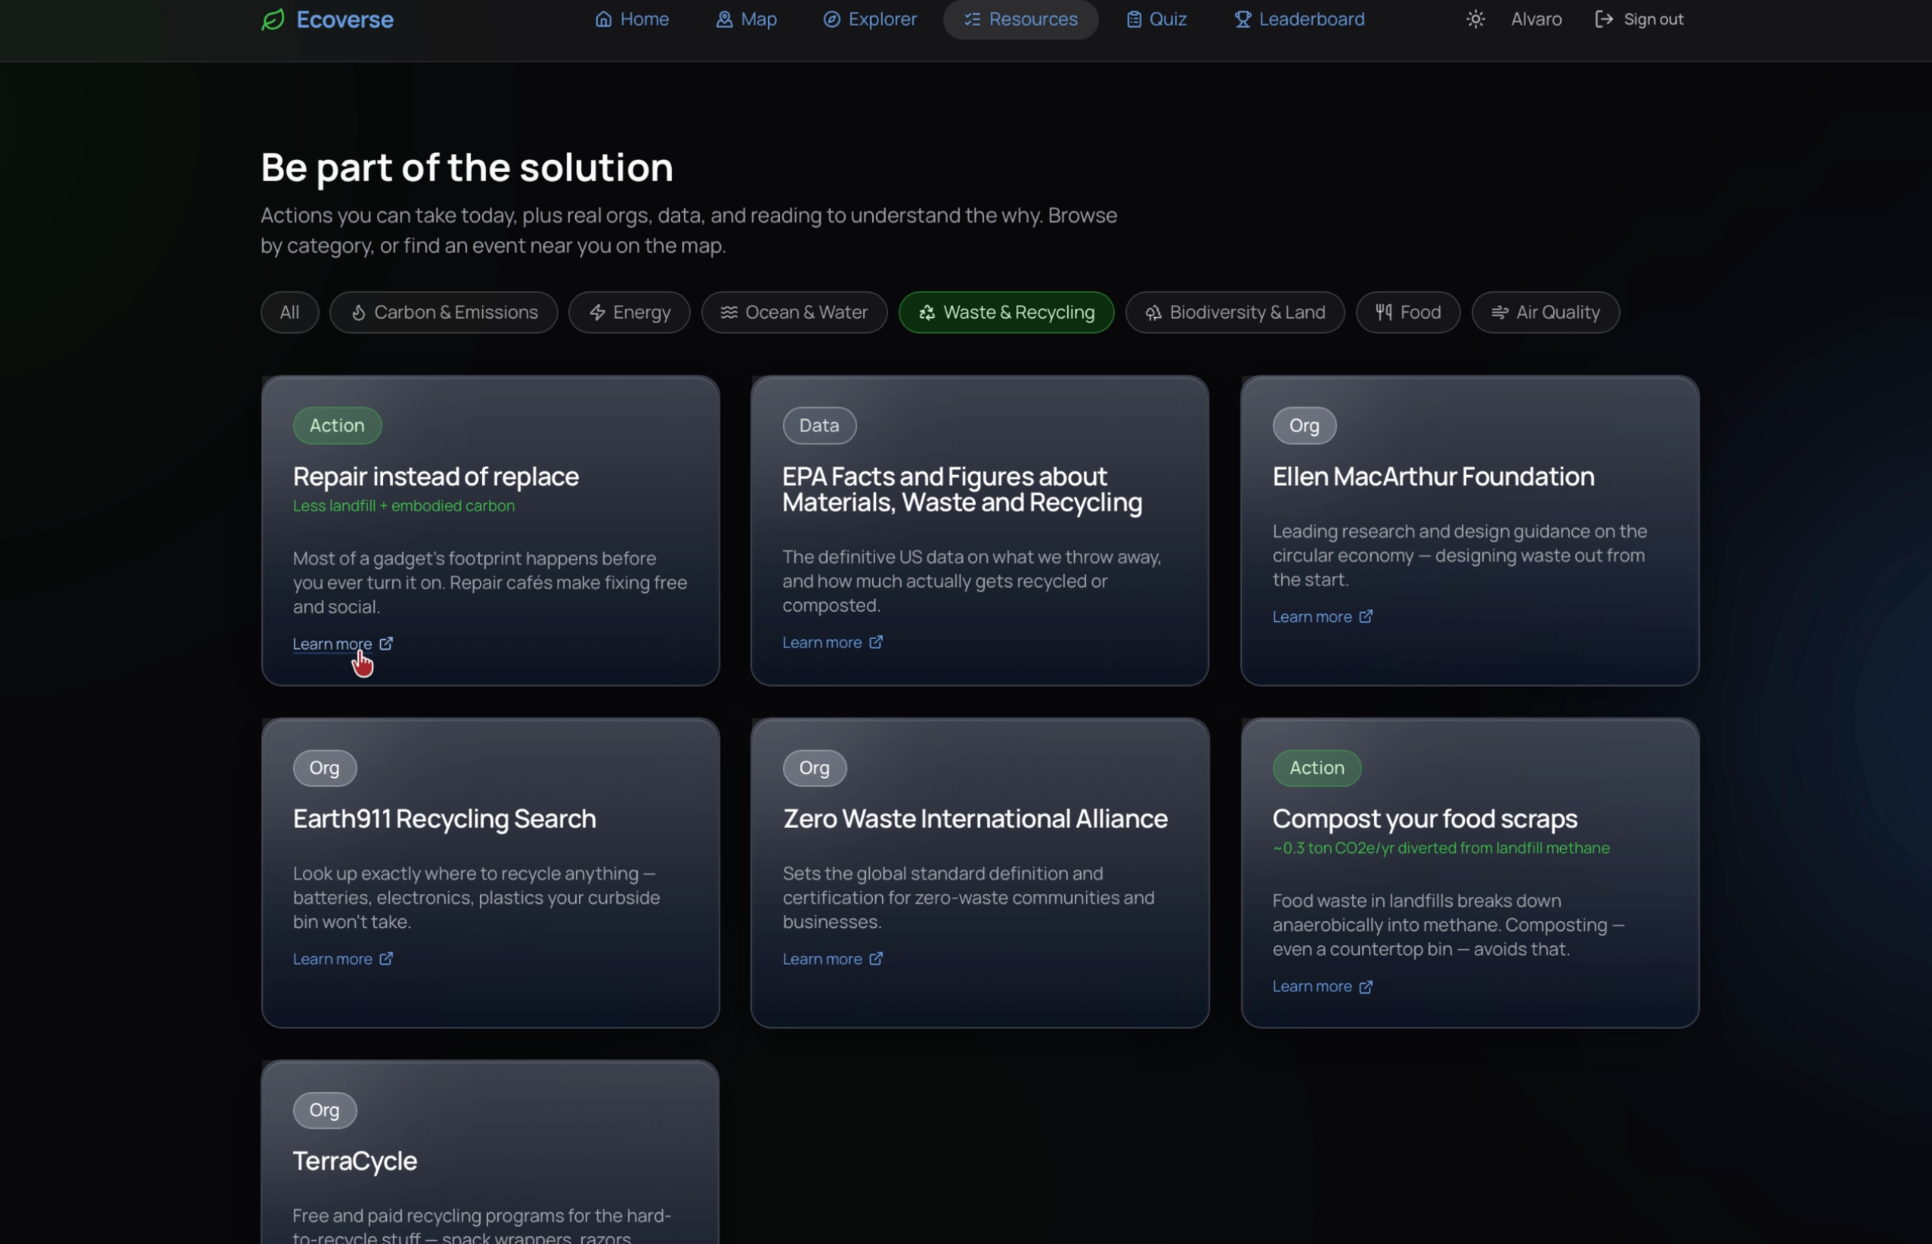
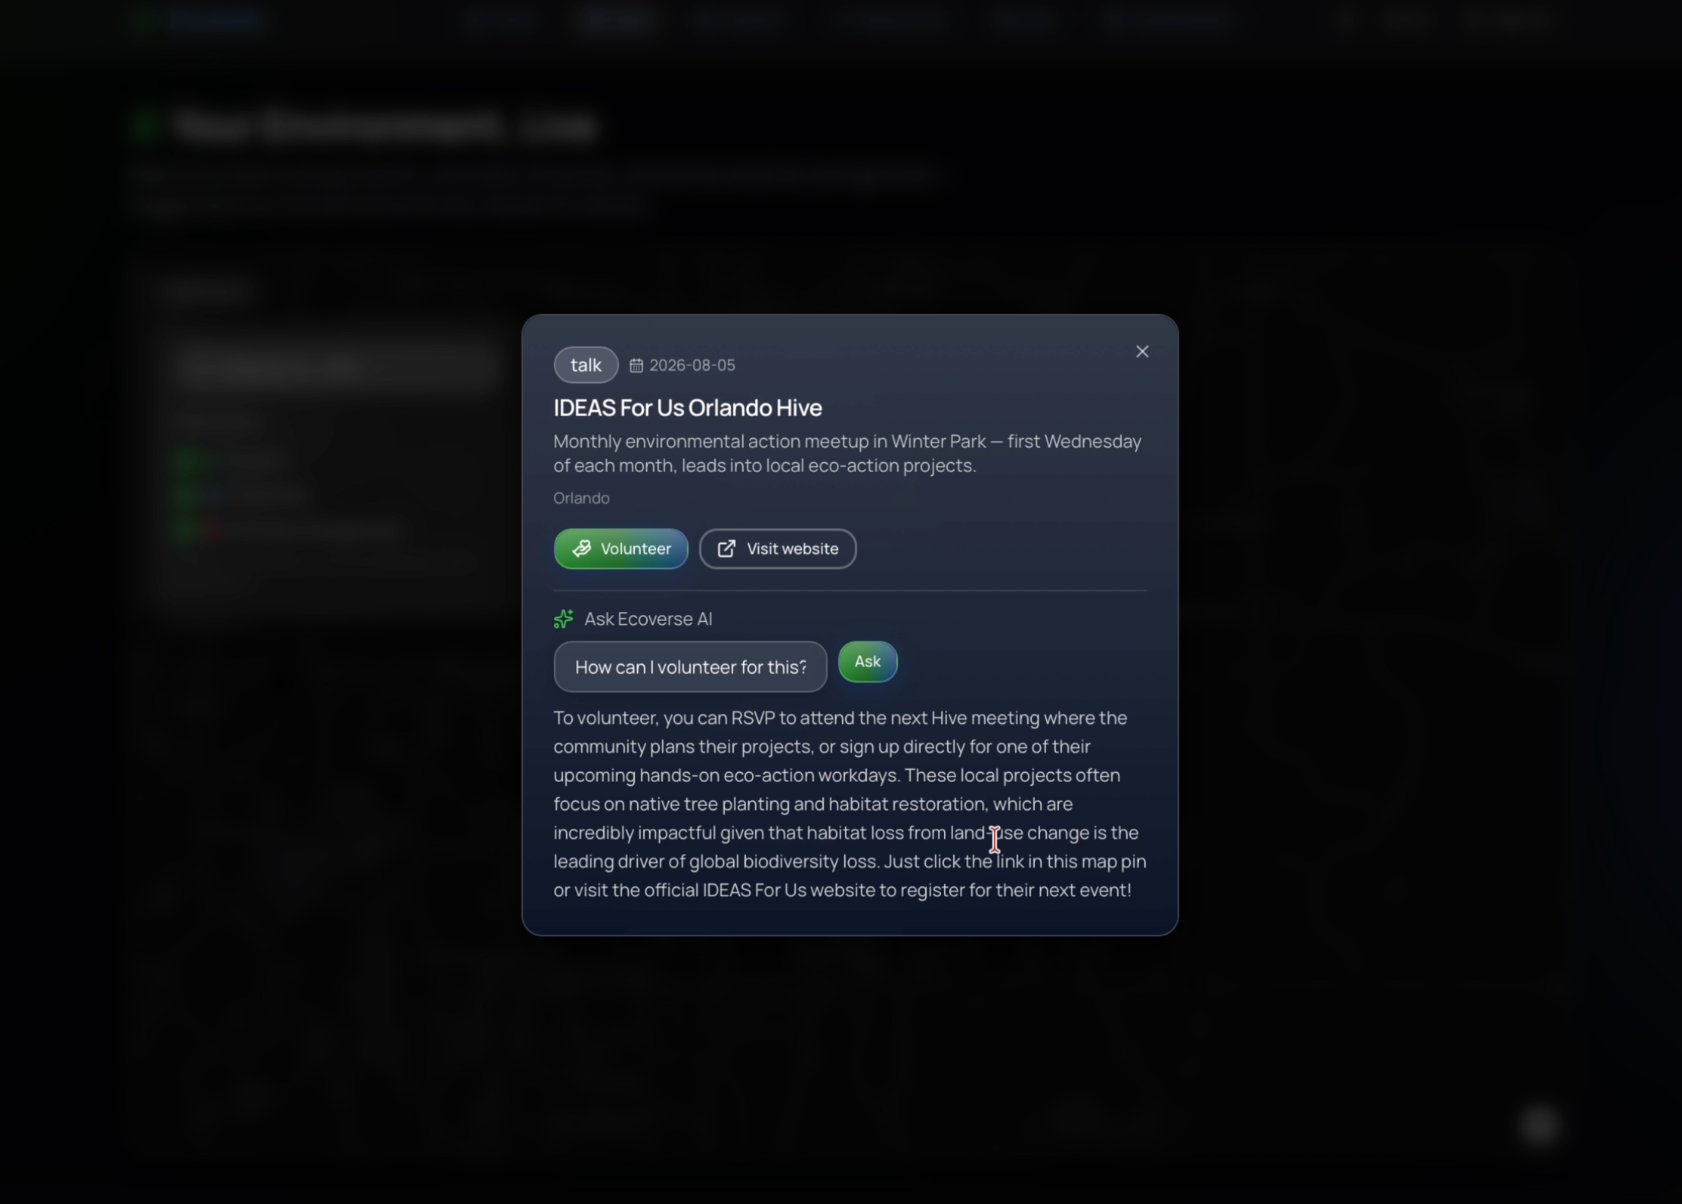
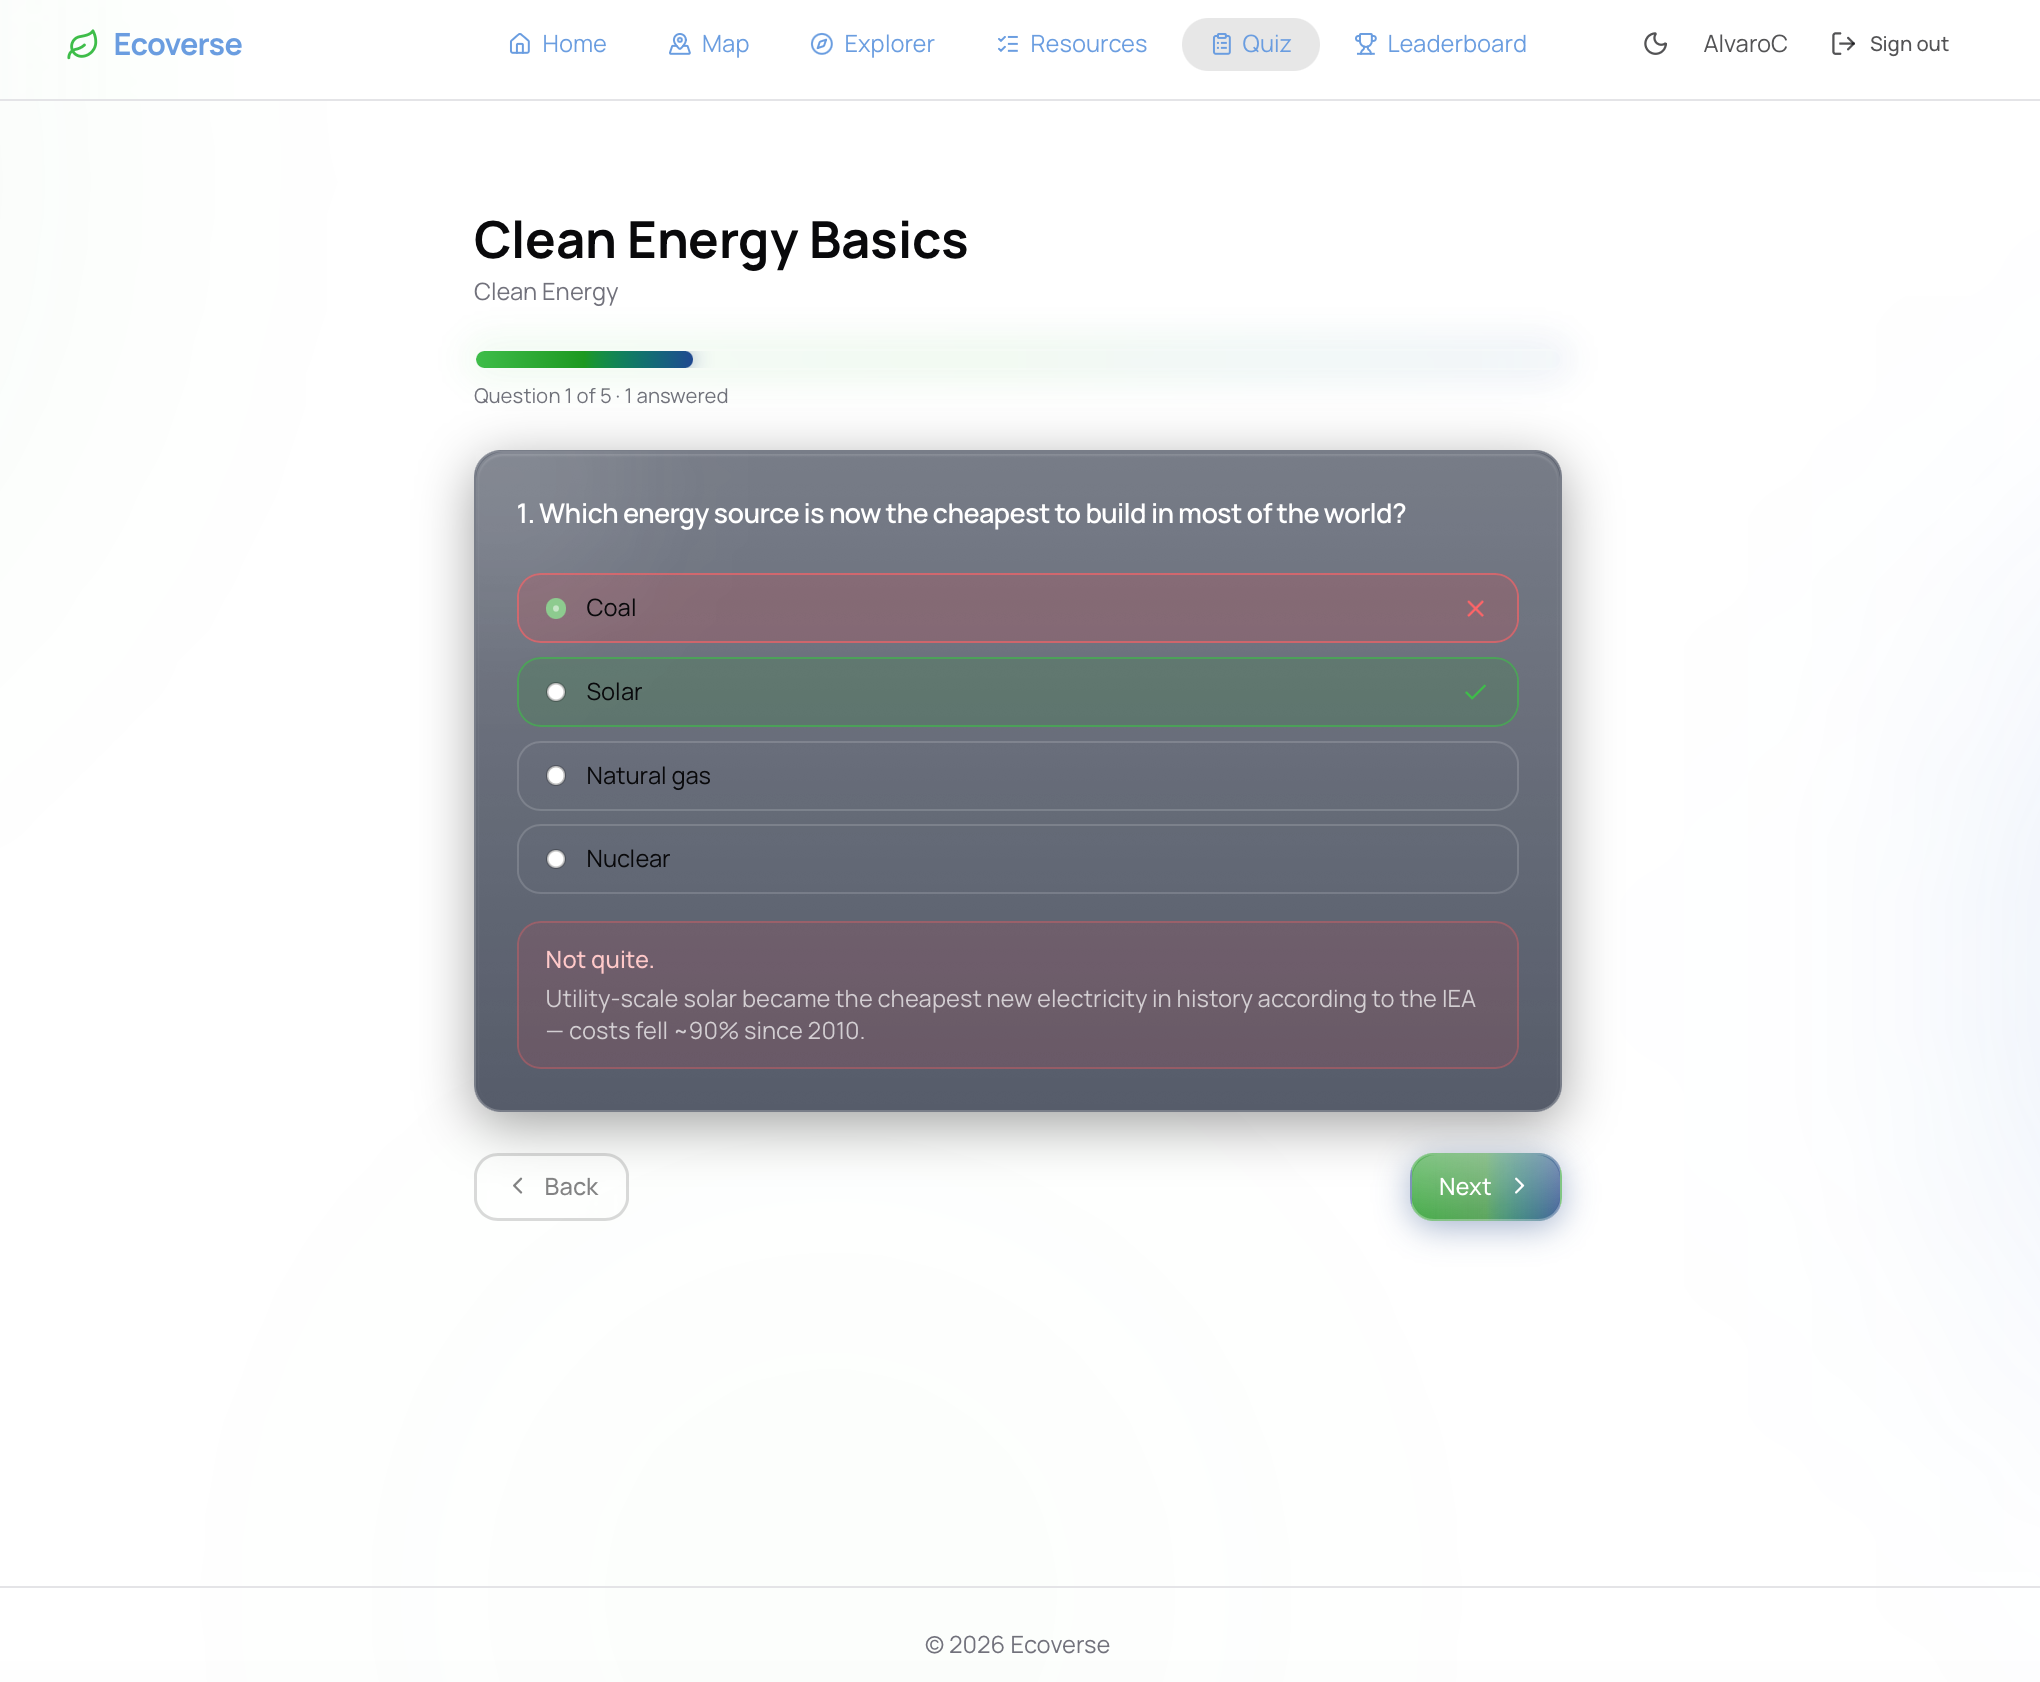
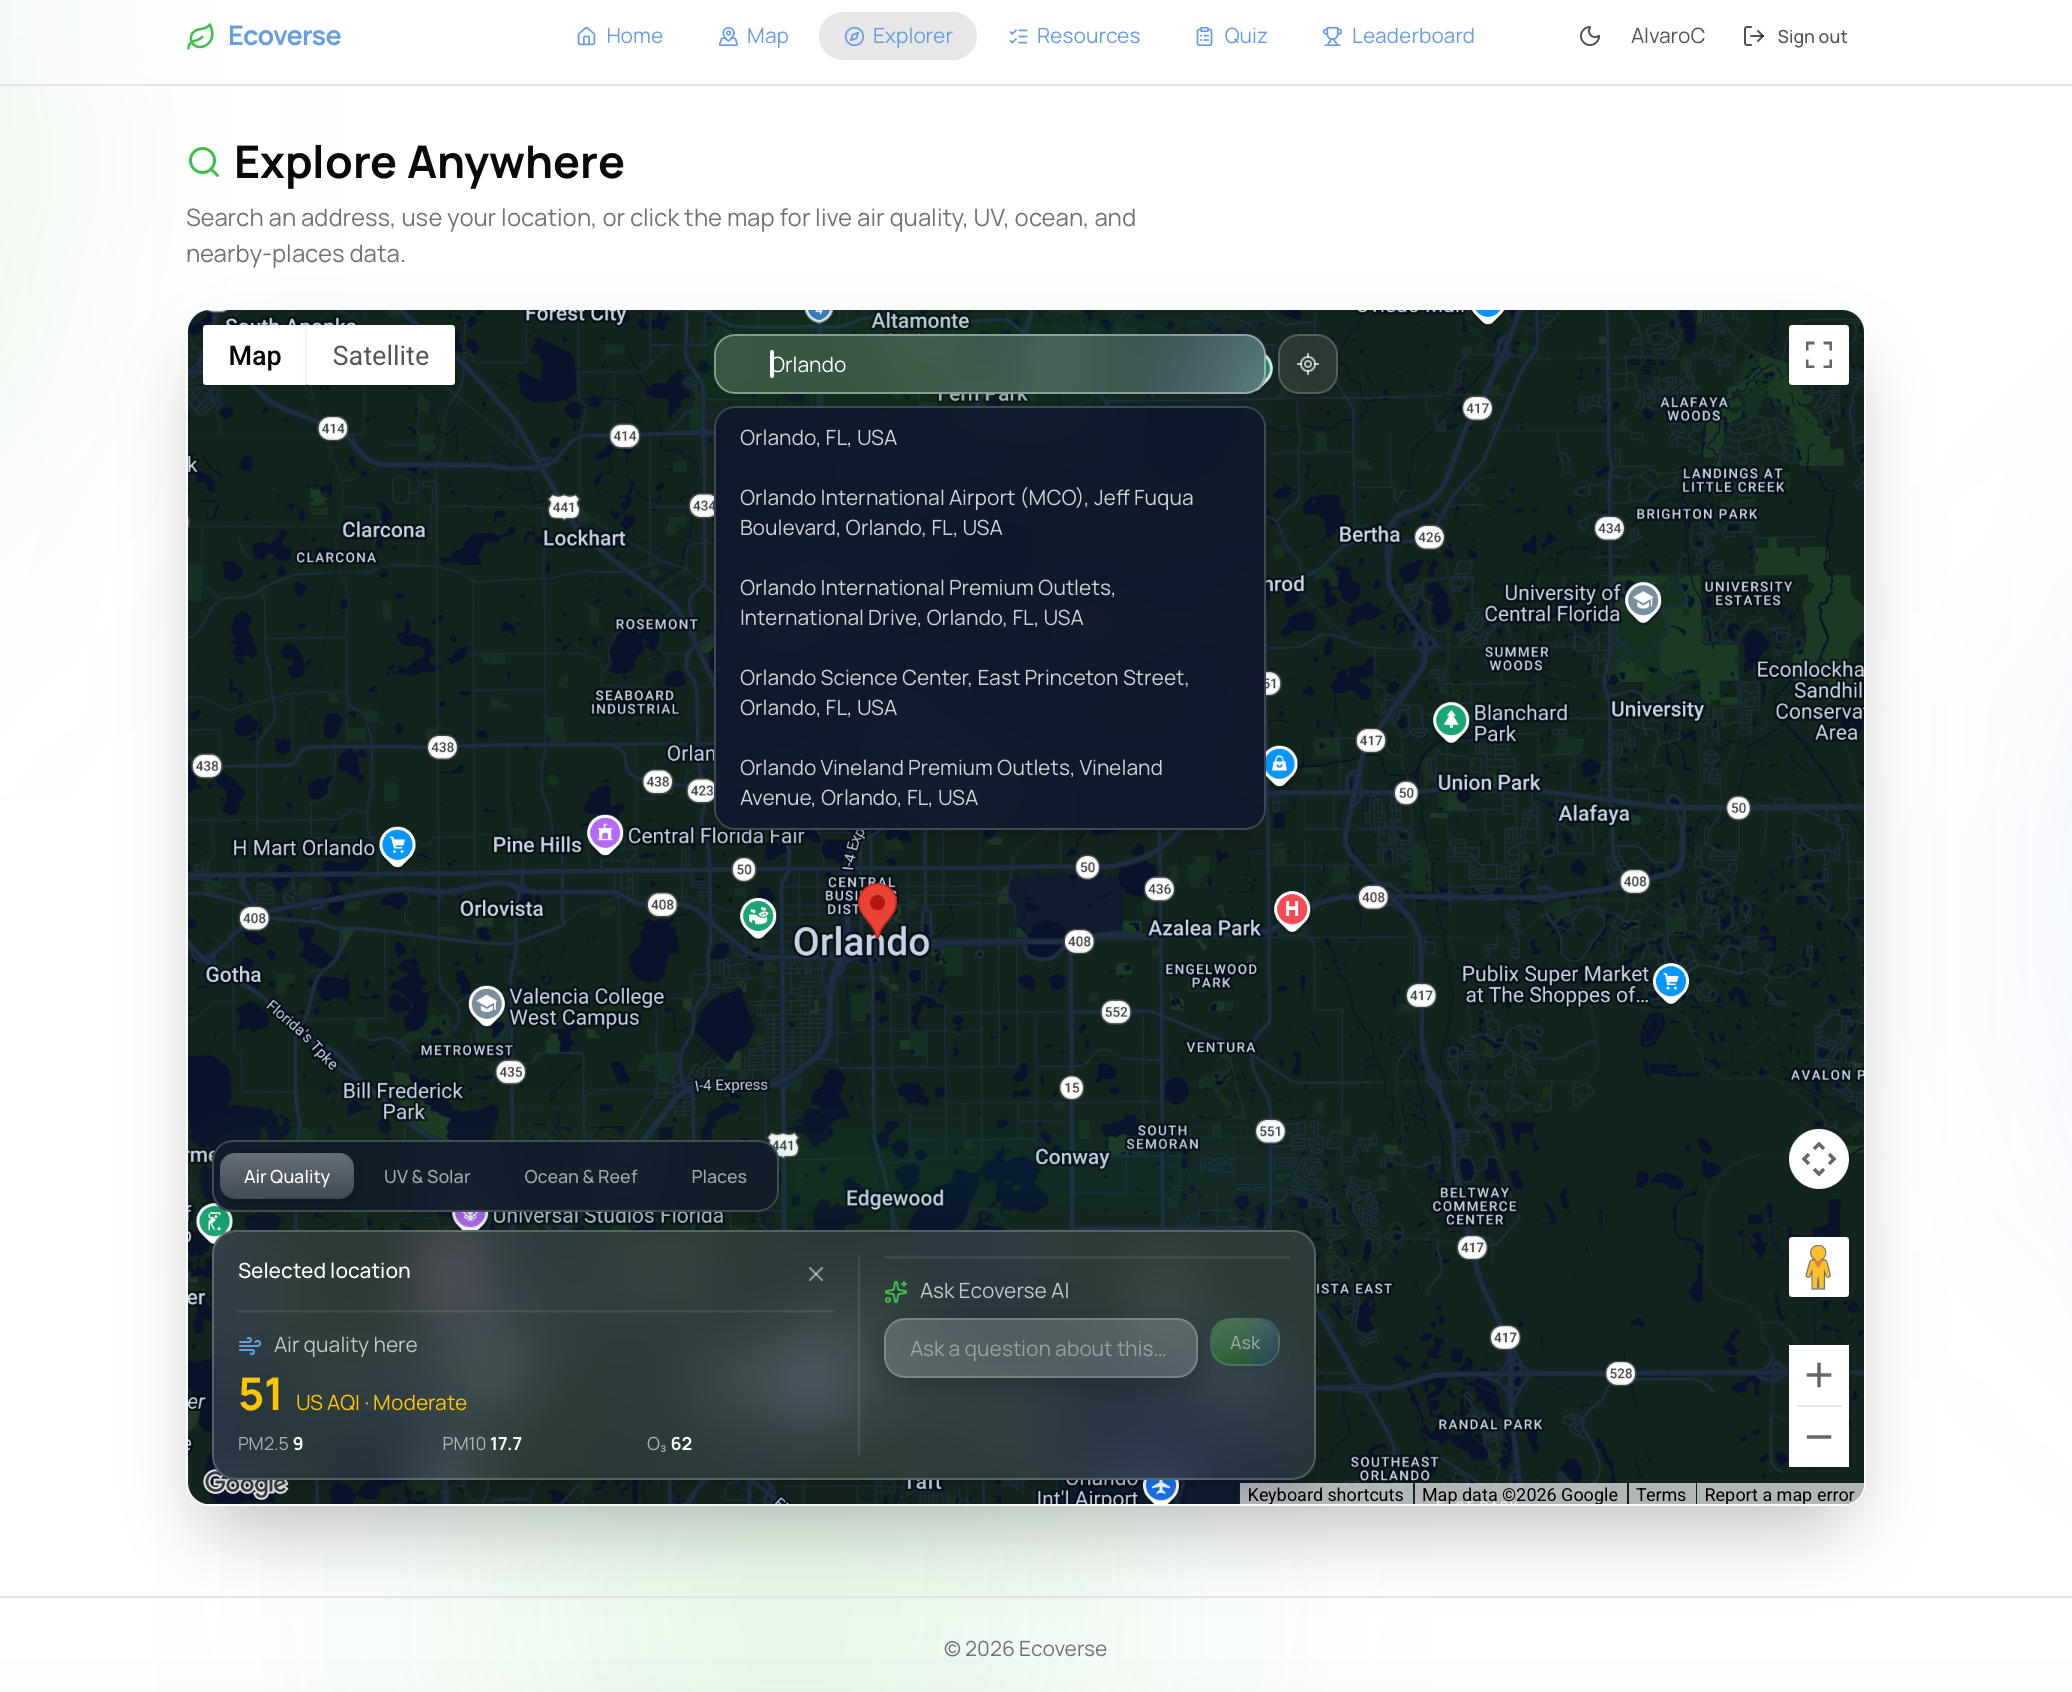
TEMPLATE
Inspiration
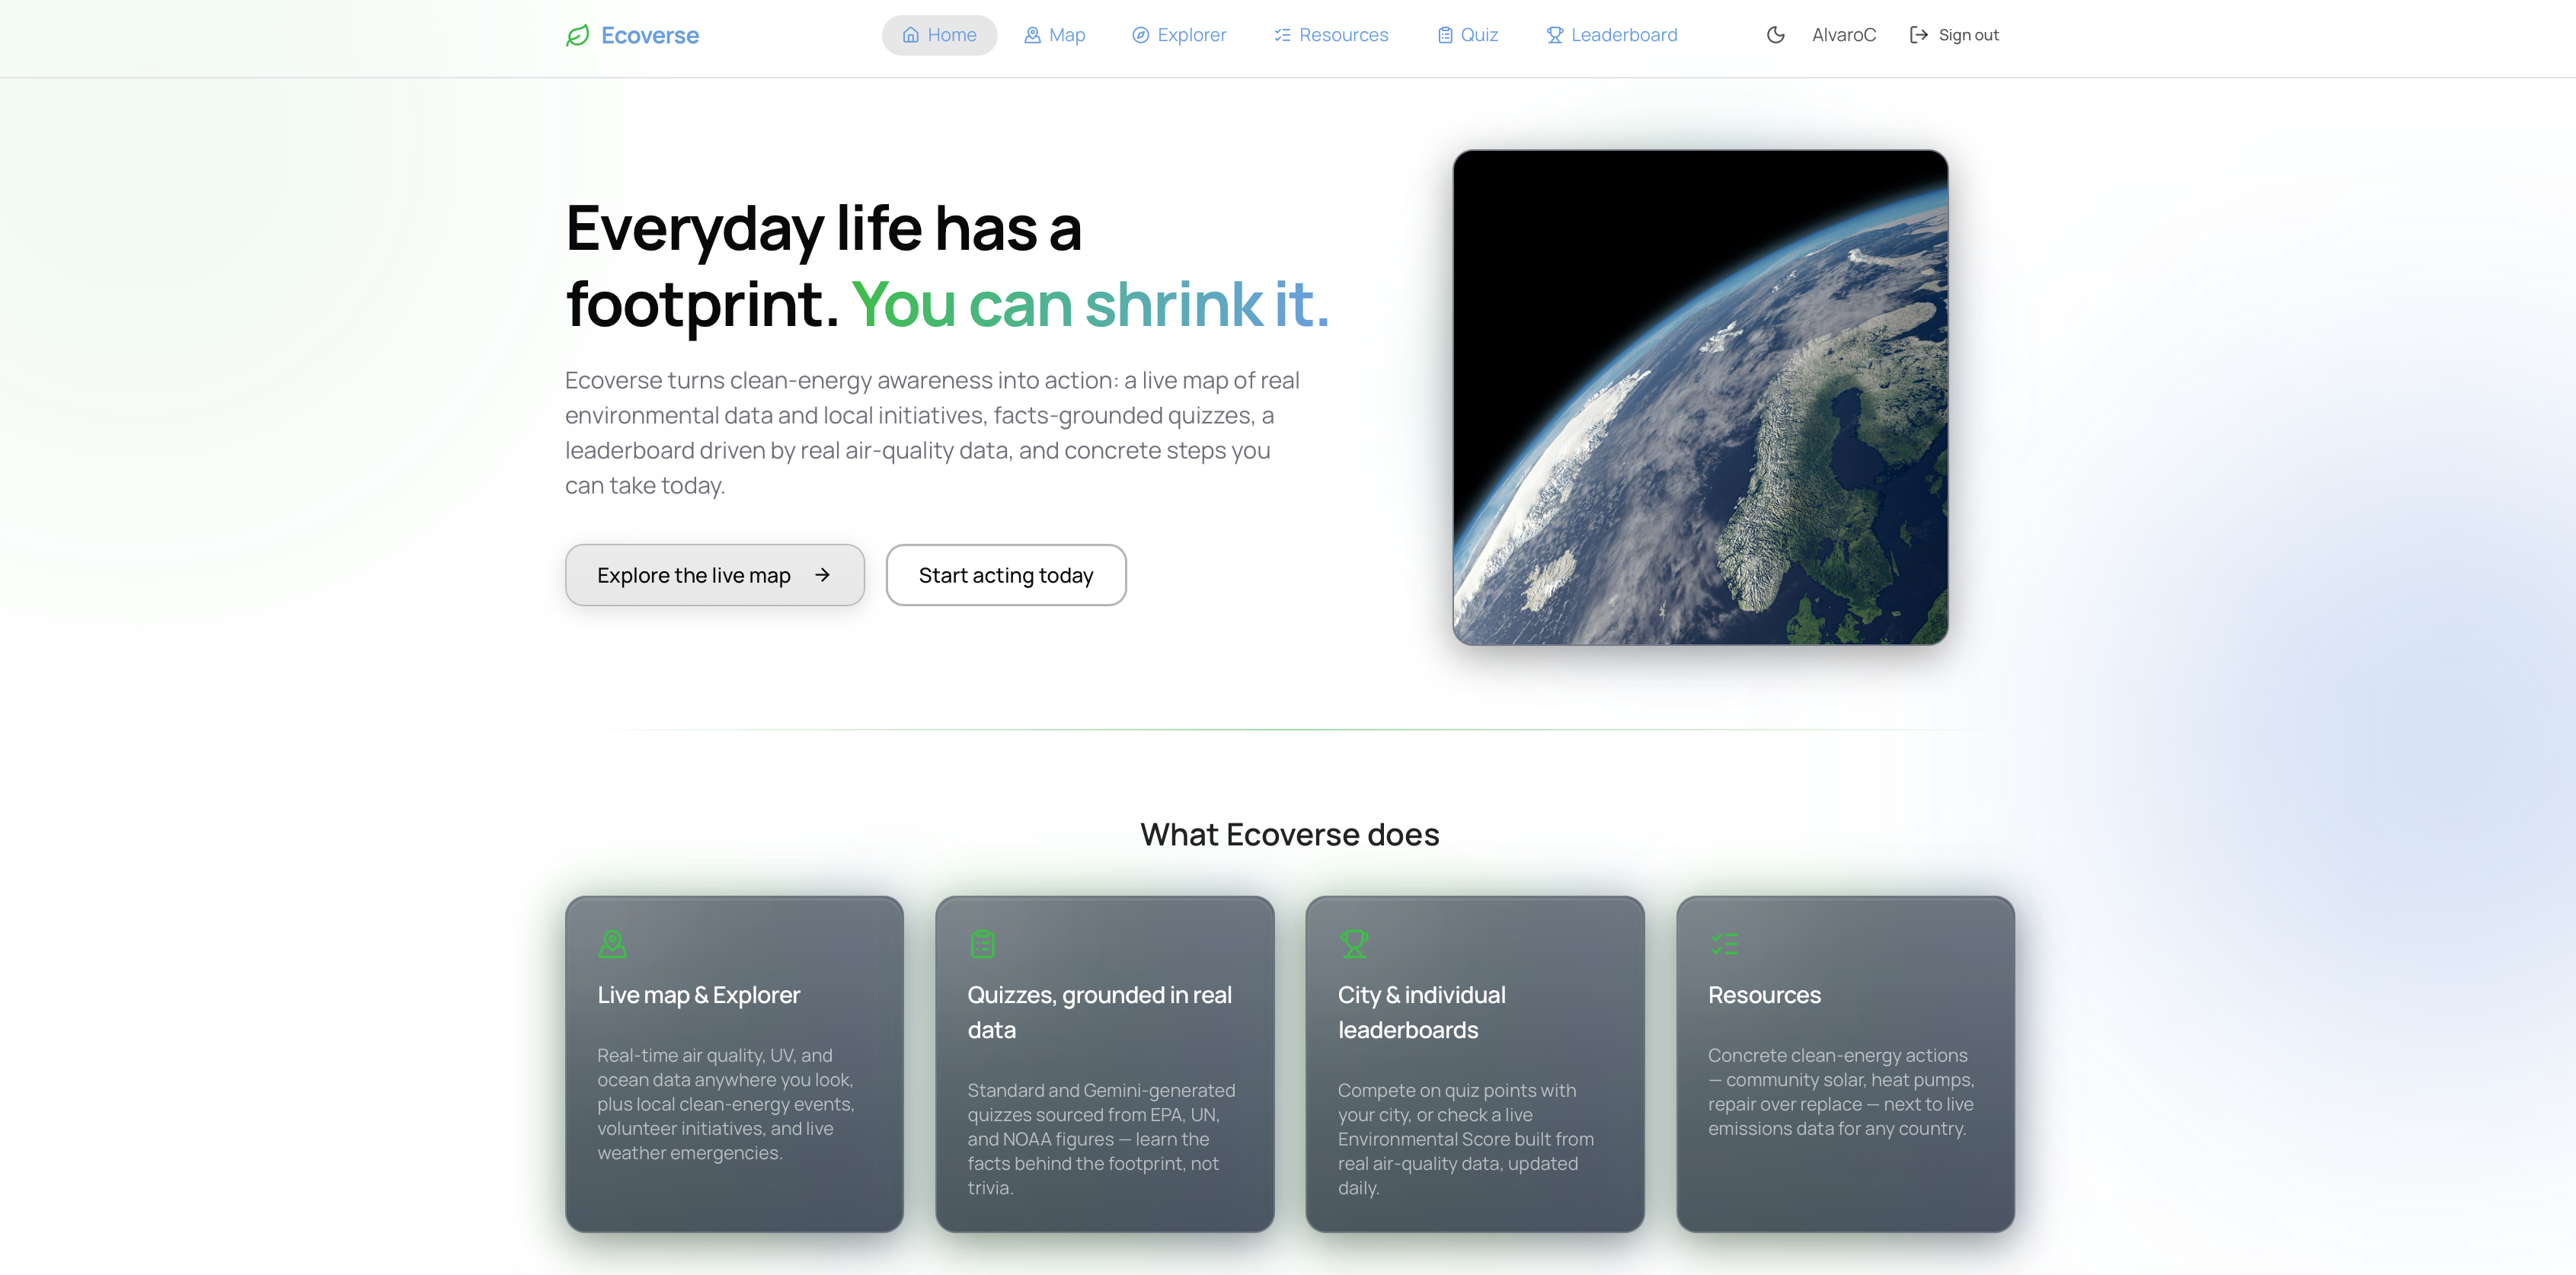
We wanted to challenge and educate ourselves on making a website that concerns helping to raise awareness on clean energy practices that could used by others to help make a difference within our world.
This challenge motivated us to analyze how people engage with climate data and present information to them in the most simple, intuitive, and educational manner as possible. Our goal was to make a web app that could explain to users how to make simple changes that can help to benefit their community without oversimplifying or abstracting from proven practices and information through trusted information.
This problem space led us to focus on:
- Making live environmental data (air quality, UV, weather emergencies, ocean/reef health) explorable through the power of Google Maps
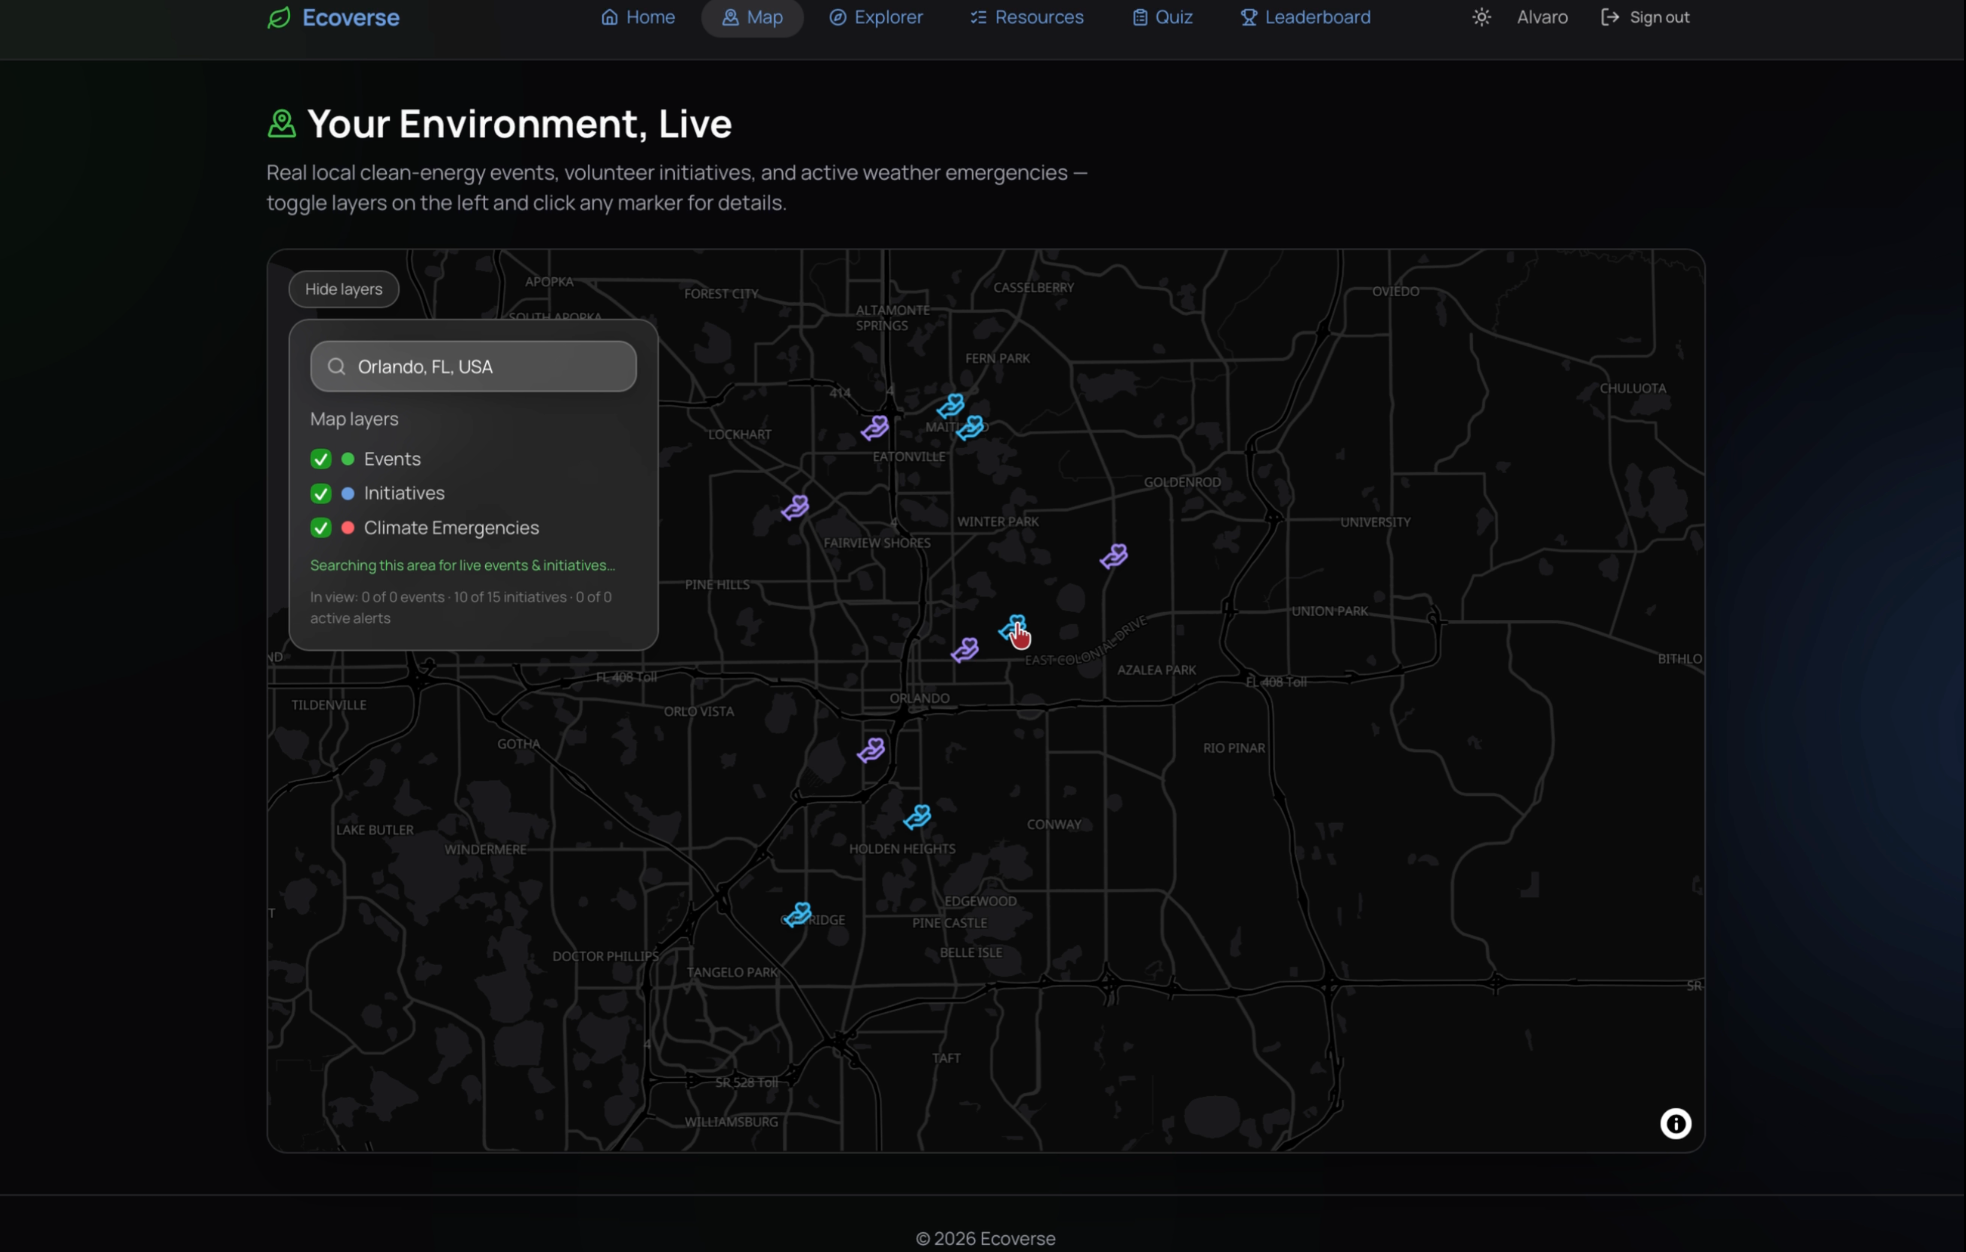
- Connecting data to real, local action and recommending actual volunteer events and organizations near users to help promote making a real-world change
- Turning climate literacy into something people engage with through quizzes and friendly competition
- Keeping every claim grounded in real sources (EPA, NOAA, Open-Meteo, OBIS) to ensure credibility
What it does
- Renders a live map of environmental conditions anywhere in the world including air quality, UV index, ocean and coral reef health alongside local clean energy events, volunteer initiatives, and active NOAA weather emergencies
- Lets users ask Gemini contextual questions about any event, initiative, or location they've selected
- Turns climate facts into short, data-sourced quizzes, with an option to make new quizzes with Gemini
- Ranks cities on two different boards: a live, daily-refreshed Environmental Score built from real AQI, and a Community Score built from quiz participation
Core experience
- An explorer where you can get an instant snapshot of local air/UV/ocean data plus nearby volunteer opportunities
- A map that toggles live layers such as events, initiatives, weather emergencies and an option to ask Gemini for more information
- Quizzes grounded in real EPA/NOAA/UN information, plus a Gemini-generated option for infinite variety
- Leaderboards that challenges users to complete quizzes and rank higher than other cities, promoting the urge to learn
How we built it
- Frontend: React, TypeScript, Tailwind CSS, EinUI (liquid-glass components), lucide-react, MapLibre GL, Google Maps JavaScript API, TanStack Start, TanStack Query, TanStack Router, Framer Motion
- Backend/Database: PostgreSQL, SQL, Drizzle ORM, Better Auth, TanStack Start server routes, Bun runtime
- External data: Open-Meteo, NOAA, OBIS, OpenStreetMap/Overpass, Climate TRACE, Google Places API
- LLM Access: Google Gemini, Claude
- Dev Tools: Docker, GitHub
Challenges
- Collecting the half a dozen live data sources (NOAA, Open-Meteo, OBIS, Google Places) into one coherent map experience without drowning the UI in loading states or continuously making APIs
- Making sure that the CI/CD pipeline we created was able to pass our changes without any problems
- Having to adjust Gemini and make sure the prompts were accurate, reliable, and proven by real data
- Ensuring that the map was not cluttered with numerous amount of data that overwhelms the users
Accomplishments
- Built a fully live map that updates with real data layer that is current, proven by sources, and valid
- Created the Gemini component that takes a look at what the user is currently looking at and being able to describe/provide more information
- Sourced and verified real local environmental organizations and volunteer opportunities
- Delivered two working leaderboard views, one backed entirely by live real-world data and other by users
What we learned
- Grounding an LLM feature in live app state which made answers more useful and current
- Utilizing government data APIs (NOAA, Open-Meteo) to provide trusted information
- Making sure that we implemented frontend components that all work together and unified
- Prioritizing UX choices and making sure our site is efficient as possible*
What’s next for Ecoverse
- Expanding real event/initiative coverage beyond the initial region to more cities
- Adding push/email notifications when a new weather emergency or nearby event appears to users
- Letting users log their volunteering efforts and reflect them in their score
- Exploring partnerships with local sustainability orgs to keep the initiative data current automatically
Built With
- betterauth
- cicd
- claude
- docker
- framermotion
- gemini
- github
- google-maps
- postgresql
- react
- sql
- tailwind
- tanstack
- typescript



Log in or sign up for Devpost to join the conversation.