-
-
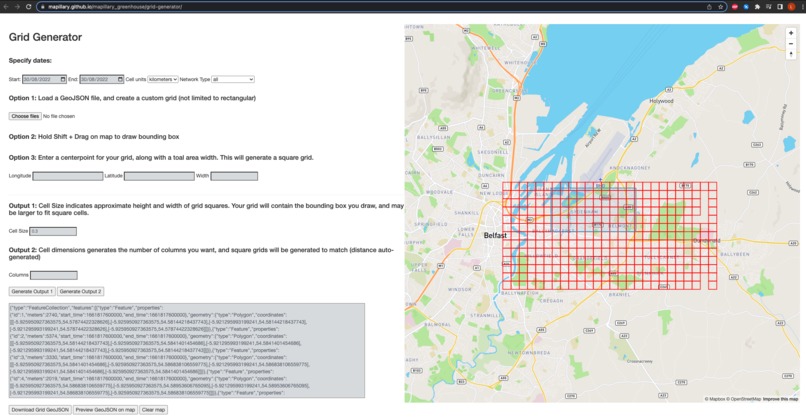
Shows the tool used to generate a grid for East Belfast, which was necessary for georeferencing the satellite images
-

Describes different map icons. Includes trees detected by ML model, provided in Council dataset & trees plotted on OpenStreetMap
-

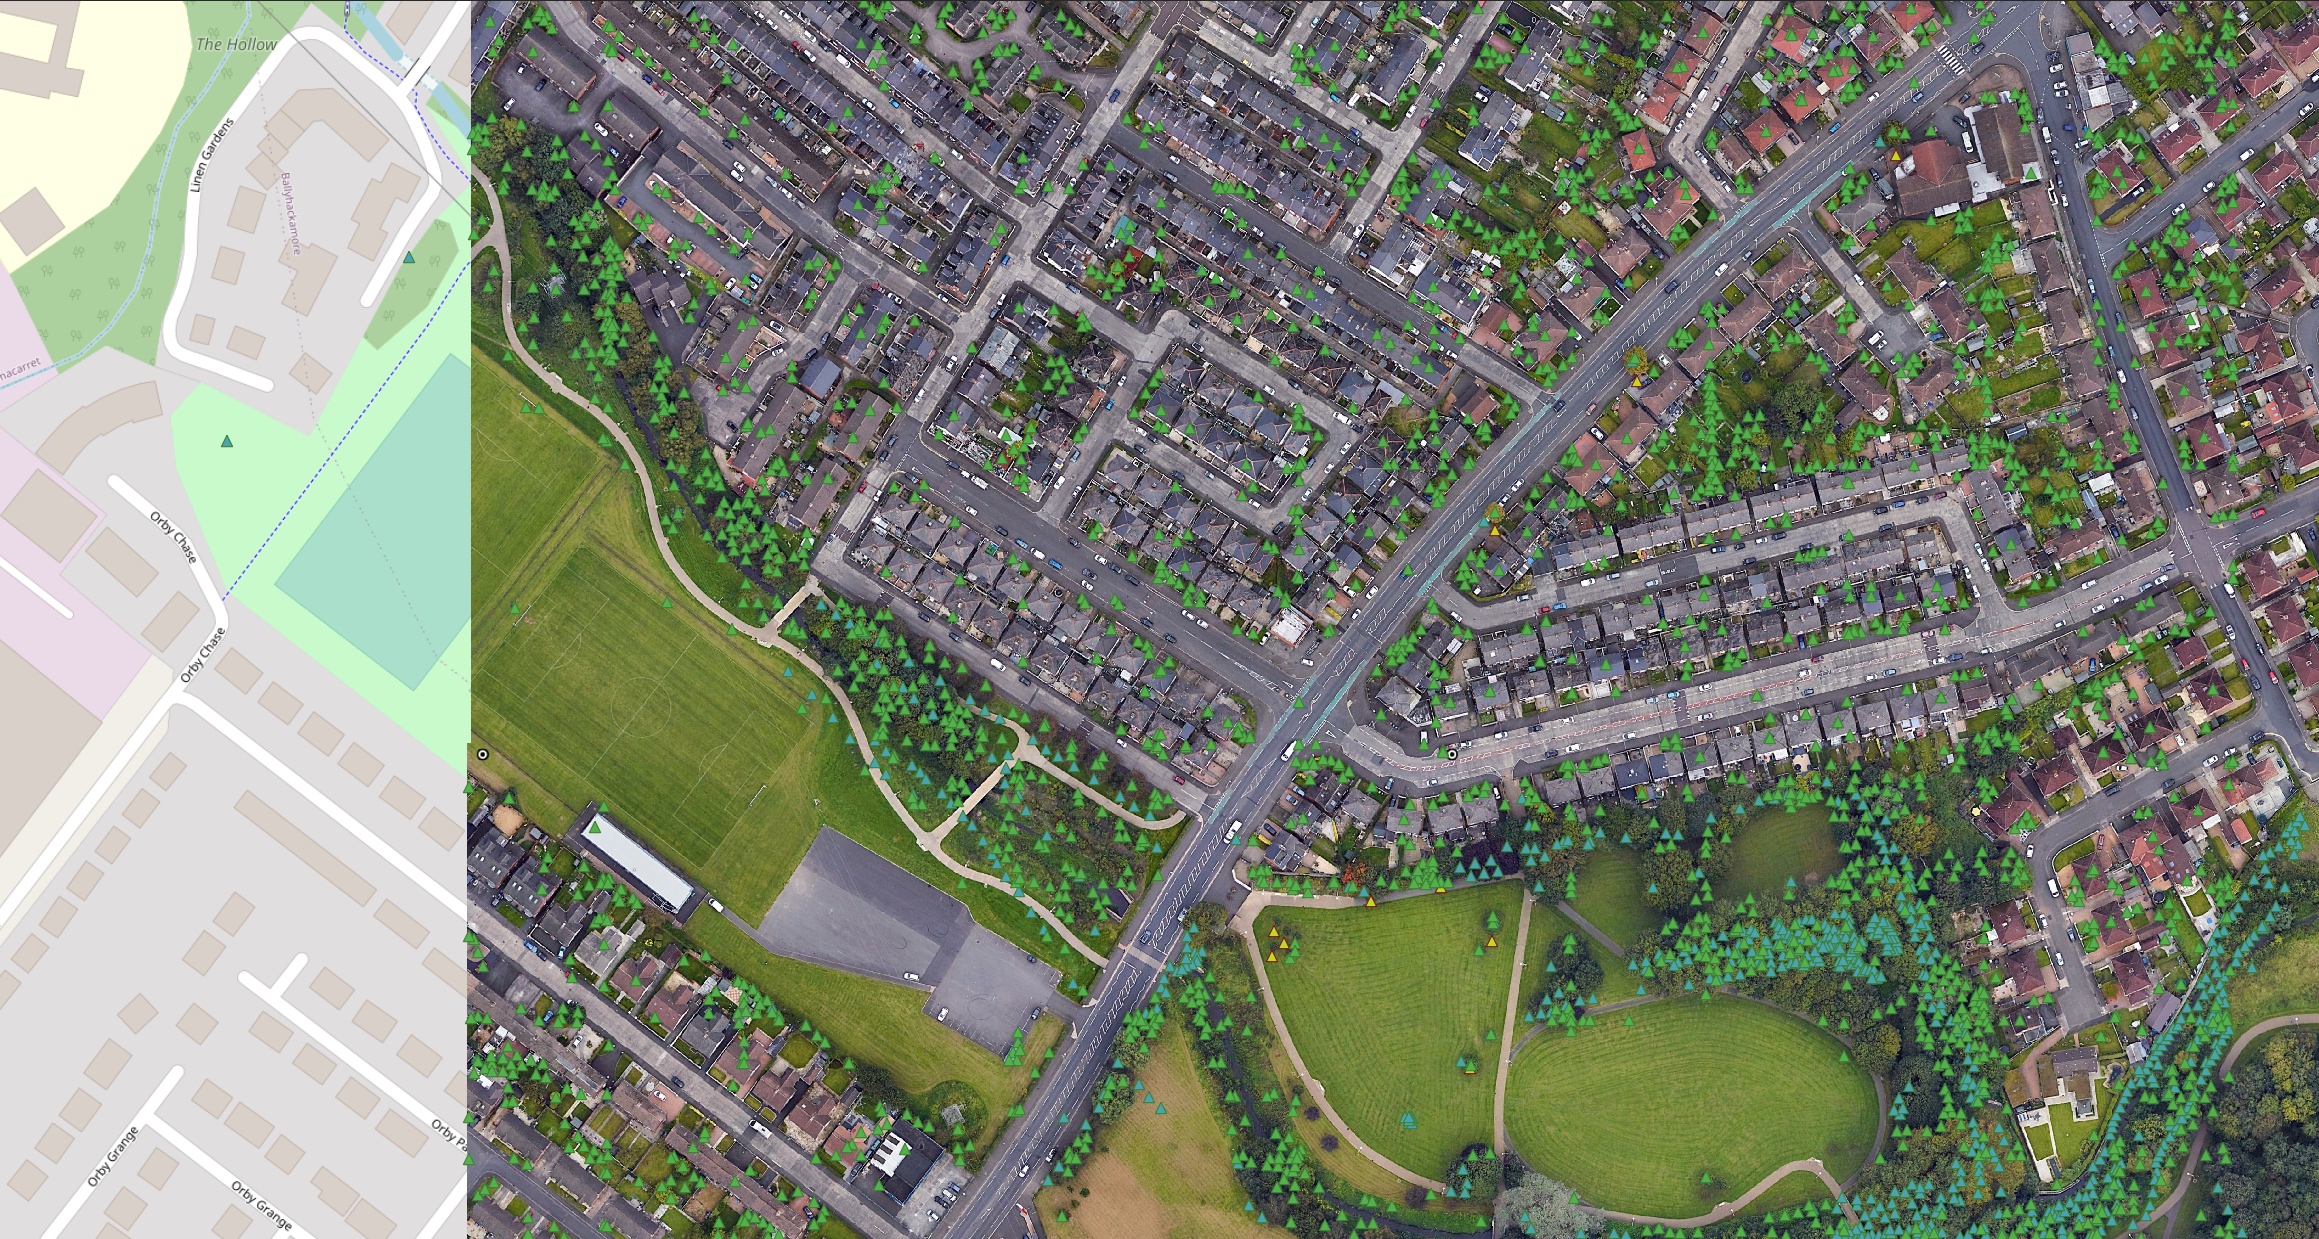
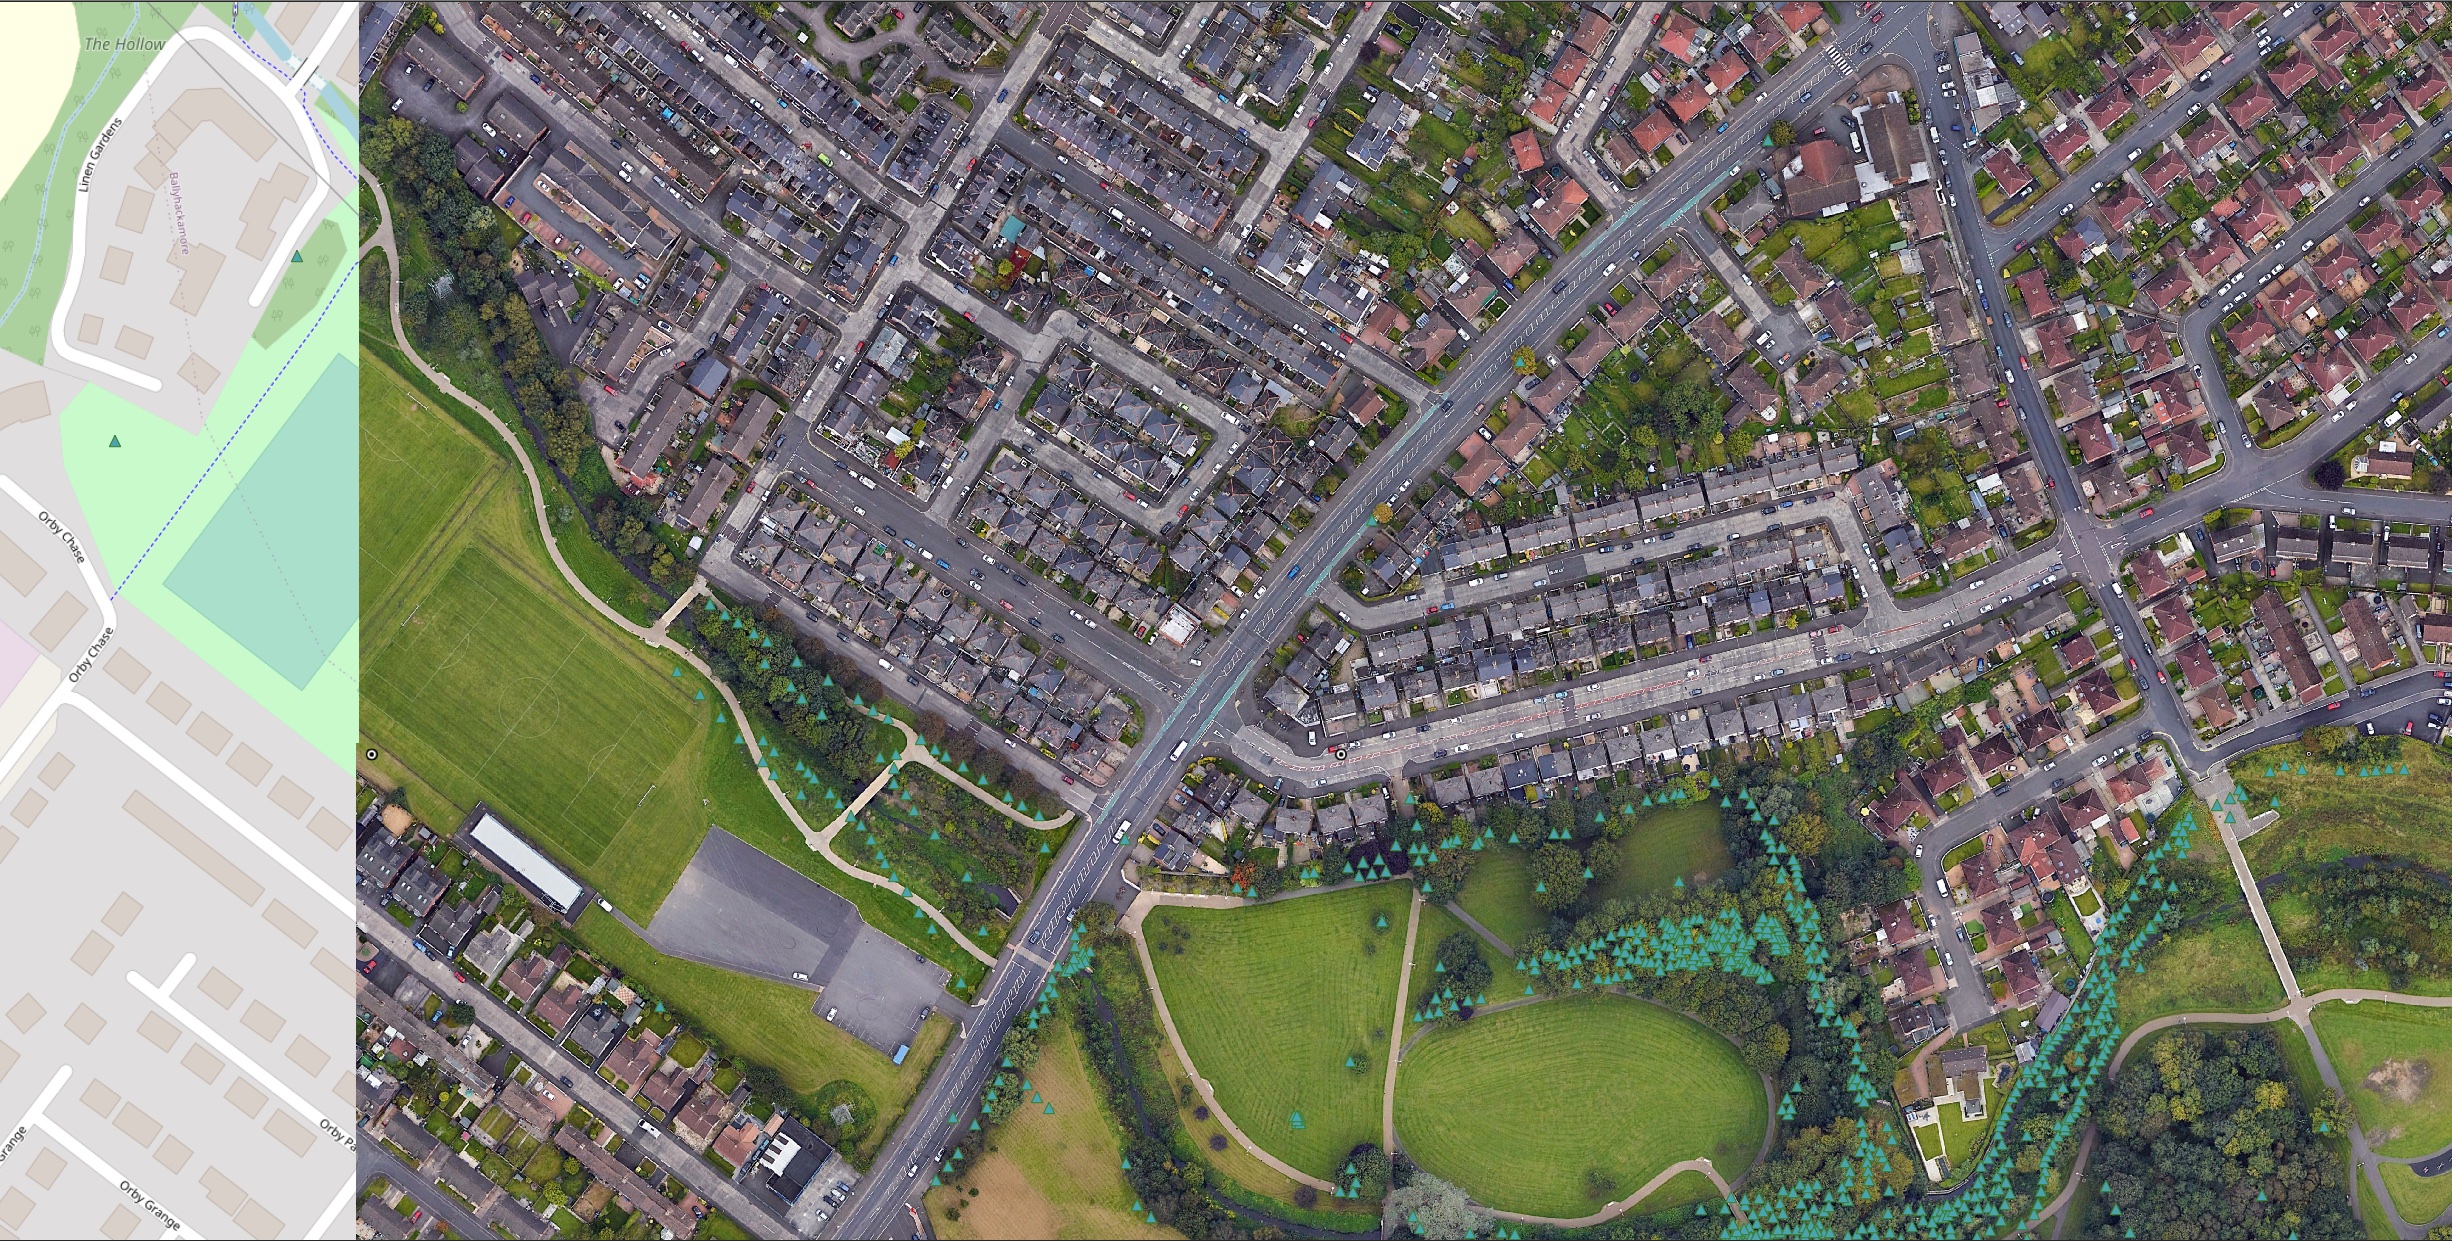
Greenville Park East Belfast, satellite imagery overlayed on OpenStreetMap data. Trees from all 3 datasets shown, visible in lower half
-

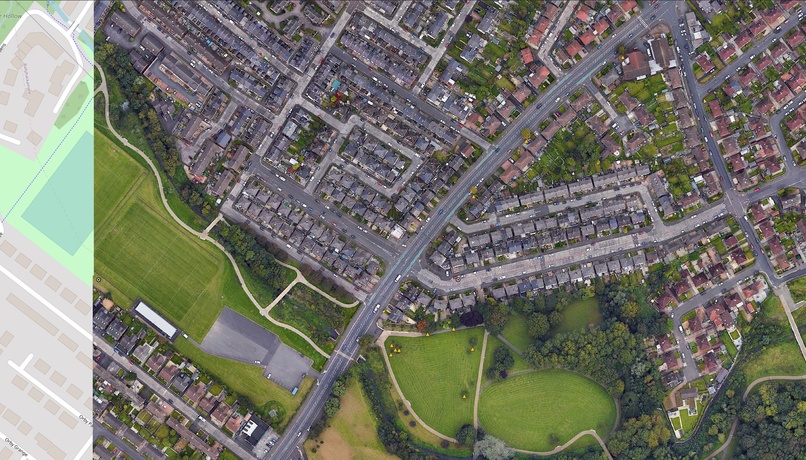
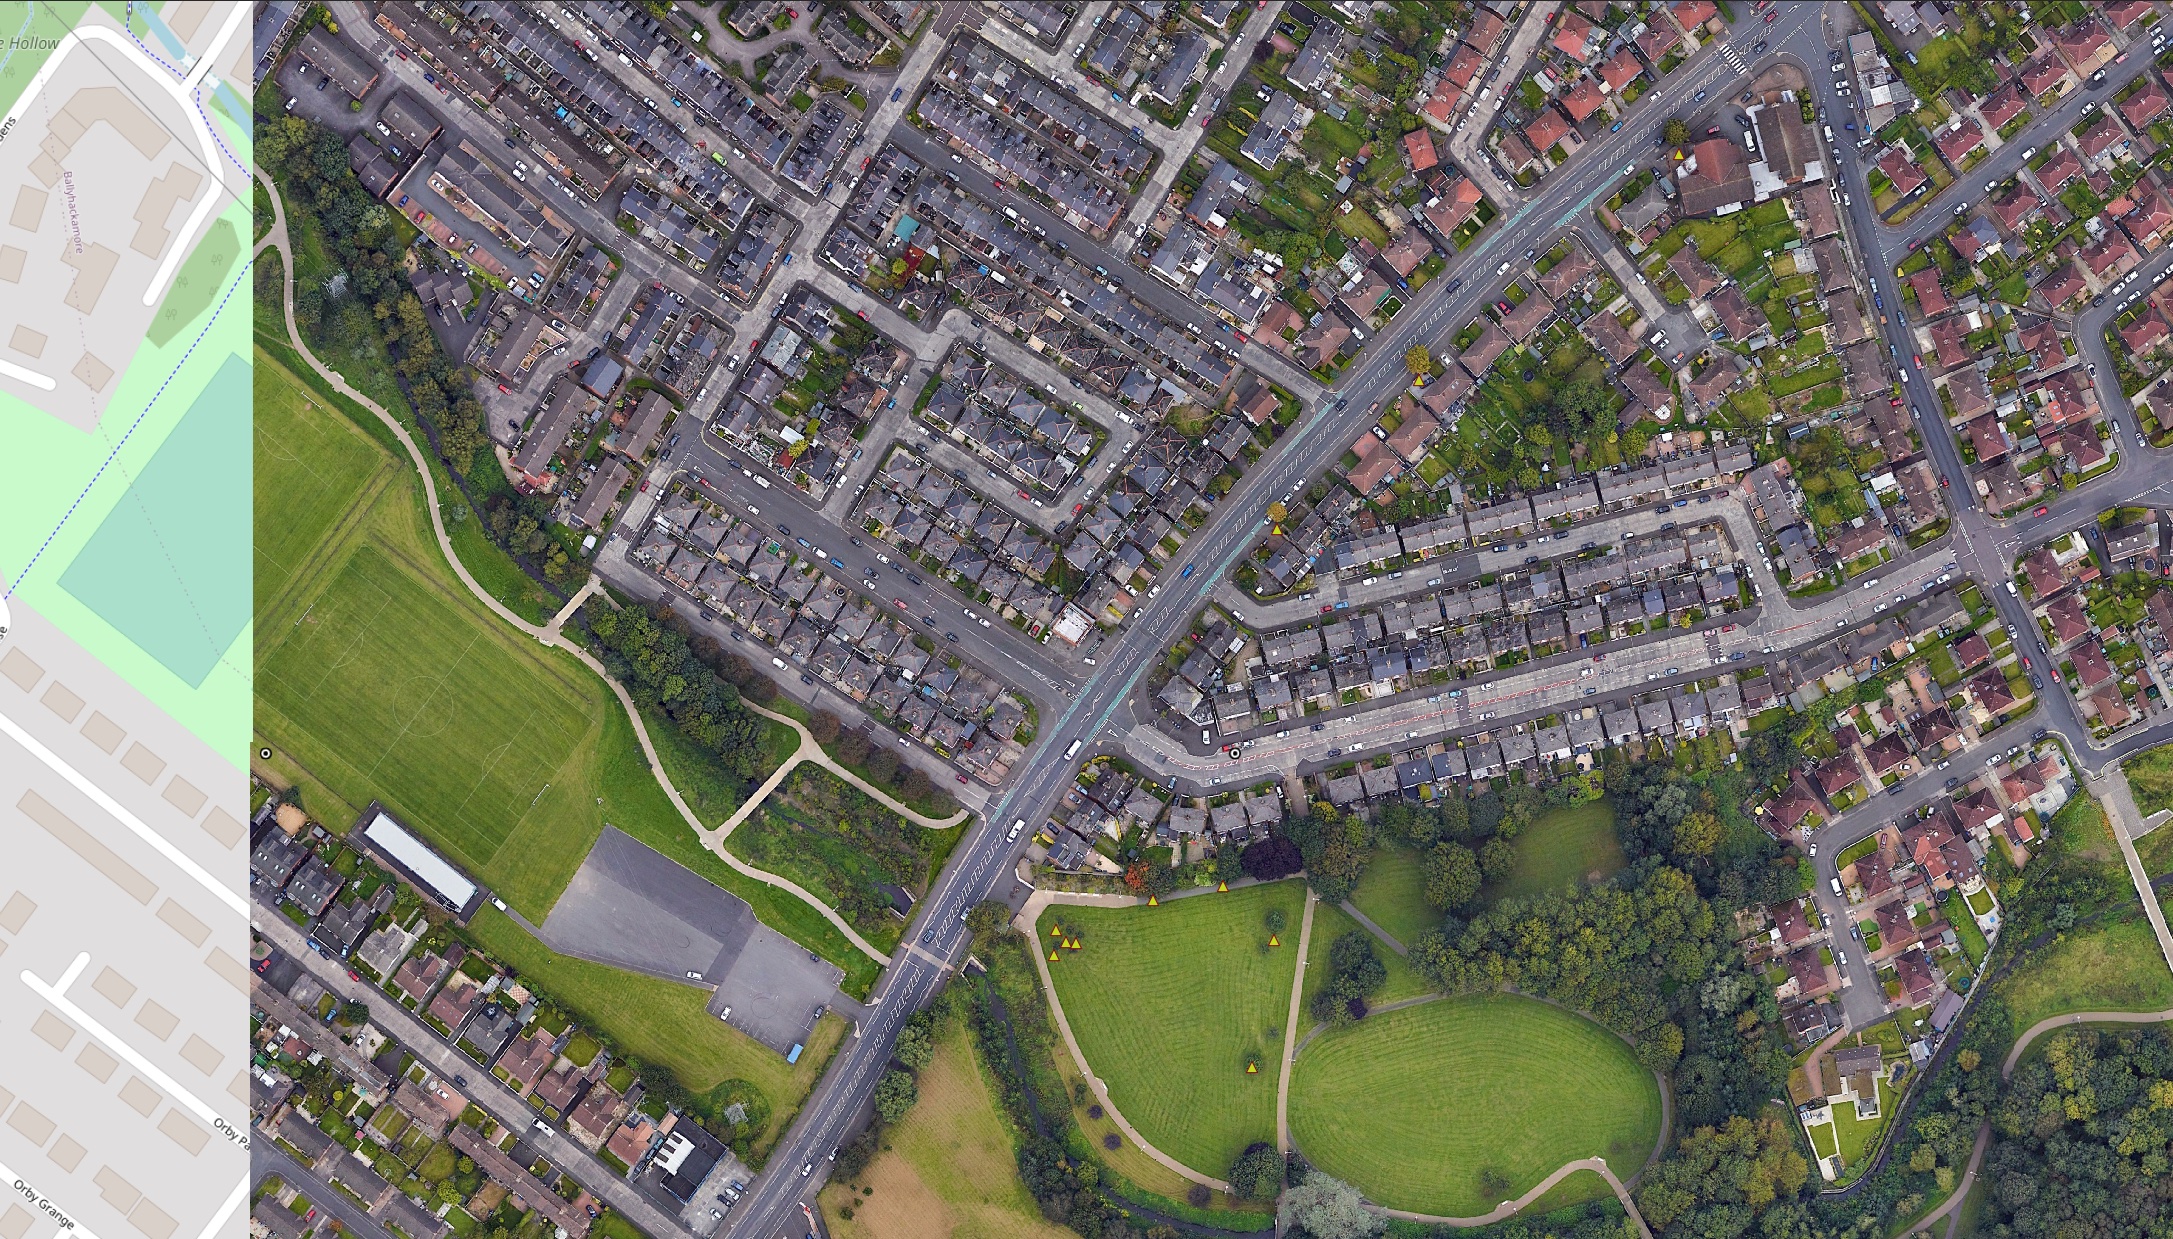
The same view of Greenville Park. However, only trees identified in the Belfast City Council dataset are shown
-
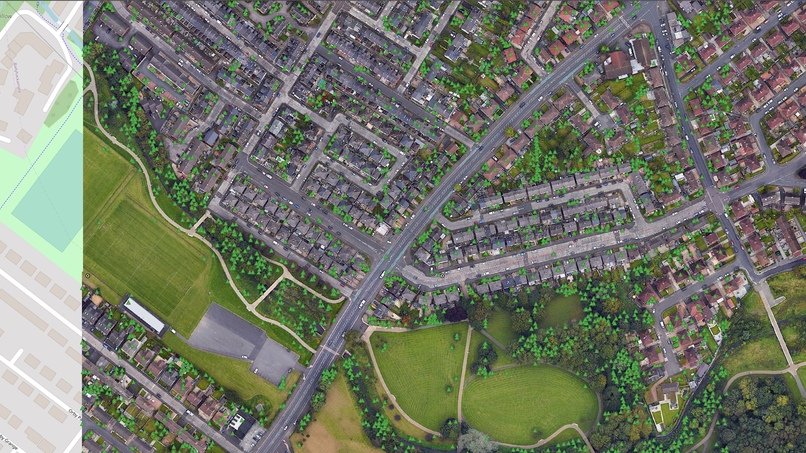
The same view of Greenville Park. However, it only shows the trees detected by the ML model
-
The same view of Greenville Park. However, it only shows the trees plotted on the OpenStreetMap platform
-

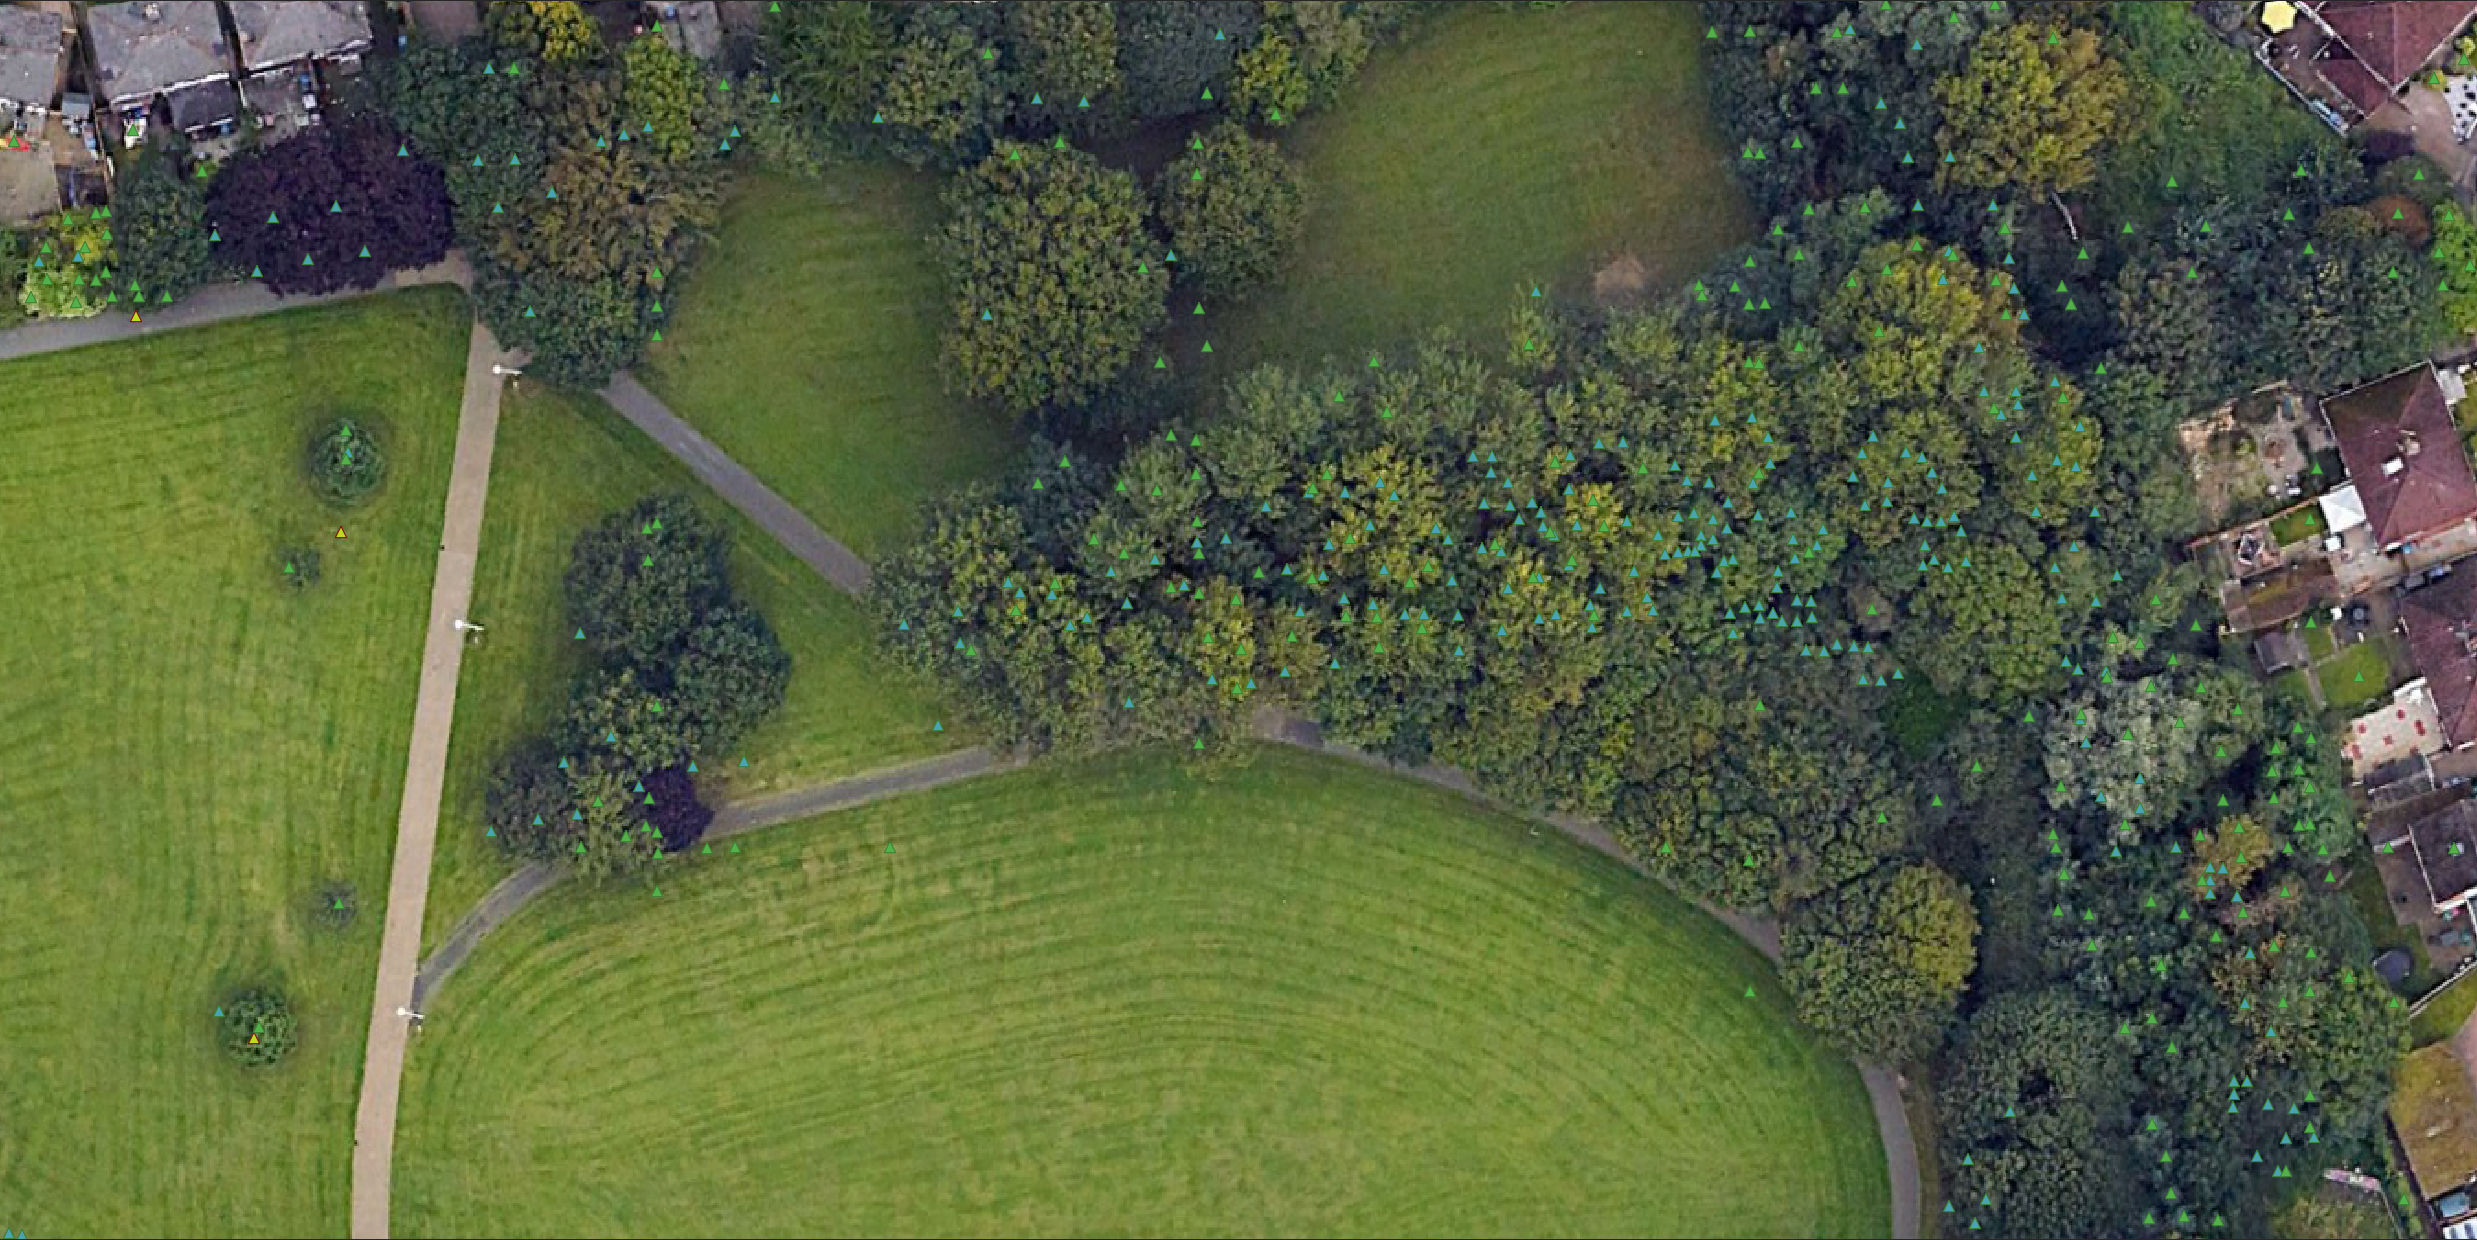
A close-up view Greenville Park. Trees identified by all three datasets. Similarity between our model’s detections & council's dataset
-

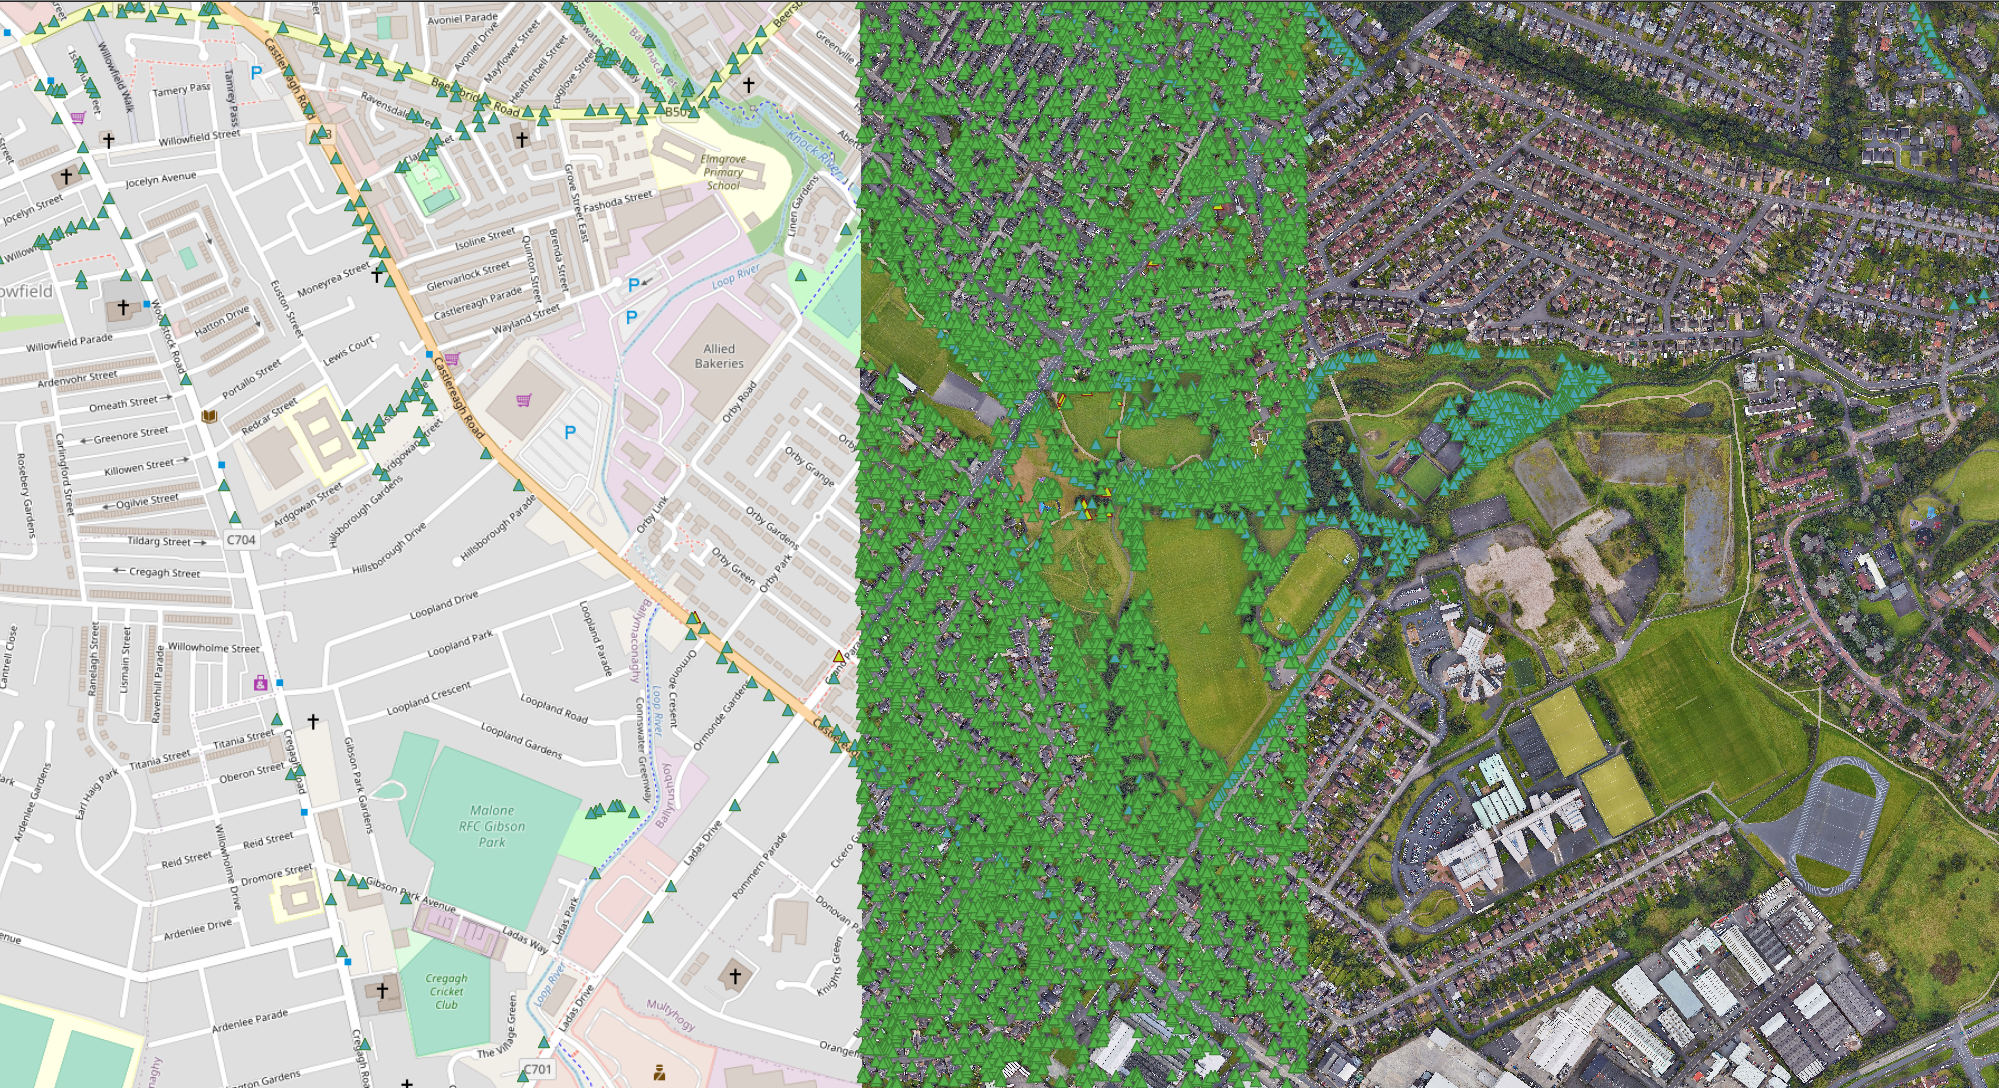
Shows a wider view of the East Belfast area and gives an overview of where we applied the ML model


OpenTreeMap
Effecting change within communities and within broader society represents a significant component of overcoming the current climate emergency – how do we thus make climate action and its co-benefits, more accessible to local communities? Whilst often discussed at a macro level today, climate activism often lacks this community centric approach. The idea behind OpenTreeMap is to take one aspect of climate action (tree replanting) and use this to foster grassroots community engagement through talking about the co-benefits of actions.
As a pilot for OpenTreeMap, we targeted identifying tree coverage in East Belfast, in Northern Ireland which is one of the local communities in which we operate. This pilot was challenged with identifying high potential publicly owned land for replanting trees and speaking to the improved climate, social and economic benefits this would lead to. With a published Belfast Net-Zero Roadmap, the intention was for OpenTreeMap to then facilitate the bridging of city council policy and local community action within East Belfast.
Through this engagement with the OpenTreeMap pilot we have engaged with local government, universities, charities and community groups to generate a backlog of ideas beyond tree replanting. The consequence is to have catalysed a broader, longer-term engagement with those same organisations to help the city tangible progress against its net-zero targets and to a more sustainable future.
Who we are
We’re a team from Kainos; we have used the UN Sustainability Development Goals as a framework to assess and guide our efforts as a responsible company. We are proud of our track record of being a responsible business, achieved carbon neutrality in 2021 and commit to continuing that in 2022, through offsetting and removal projects, and we are on track to achieve net zero by 2025.
Our focus is to ensure that we understand, manage and reduce the harmful environmental impact of our business activities. In addition to our own operations, we aim to make a wider impact by helping our customers, employees, and suppliers to achieve their own low carbon futures.
Inspiration
The hackathon allowed us to explore problems related to sustainable development areas, explore available data sets and run an idea generation session with our colleagues working on environmentally focused customer accounts. After discussing several ideas internally and voting on those that interested us most, we engaged a local university which has a research centre for Sustainability, Equality and Climate Action to discuss our ideas and challenge our thinking. We spoke with Professor John Barry at Queens University Belfast who teaches Earth, Energy, Ethics and Economy modules, Leadership in Sustainable Development and co-chairs the Belfast Climate Commission (BCC). Prof Barry provided great insights of how we can make the best possible impact and the types of measures and areas to focus on. Furthermore, he identified local charities and community action groups for whom it would be beneficial to engage including the EastSide Partnership, a scheme targeting East Belfast Regeneration and Climate targets.
The EastSide Partnership is a local charity leading the regeneration of east Belfast. They work alongside other community-based organisations, elected representatives, statutory agencies and local businesses, to deliver a wide variety of projects with a clear mission to ‘make east Belfast a better place’ for residents, businesses and visitors.
Through this engagement, we came to learn that the BCC and the EastSide Partnership were planning to run a local study targeting climate action in East Belfast and we decided that our pilot for our tool should focus on that city region. The desire was to develop a tool and through the pilot demonstrate a real, tangible impact rather than just creating suggestions. We also knew future opportunities for collaboration would include exploring a range of additional data such as demographics, home energy efficiency, property types and value and estimated carbon impact of homes/businesses in the area.
With the potential areas of collaboration being so vast, we decided to start with a single challenge as a pilot which would become OpenTreeMap. This was to focus on tree replanting and using the hackathon to show existing tree cover within the local community paired with the potential replanting opportunity.
The technical challenge was then to develop a method of detecting and capturing all the trees in the area and plotting them for easy access while researching how to best target engagements with citizens.
We plan to share the results of the hackathon (existing tree cover) and contribute back to Belfast City Council’s Open Data register for trees to ensure its ongoing accuracy.
What it does
Our solution leverages open data, satellite imagery and a machine learning (ML) model to identify trees and coverage in the East Belfast area; to determine the best locations for replanting to maximise the social, economic and environmental impact of the new trees.
We built up a data set of trees from open data and ran a computer vision detection model on satellite tile squares of the region we’re investigating. The data is then plotted on an interactive map, allowing users to see existing tree cover and in future identify areas where additional trees could be planted that’d lead to the greatest impacts when combined with additional data such as local population, demographic and commercial statistics. Users can determine the best location to have to most impact on the local community while also identifying areas that could be easily replanted, such as brownfield sites.
The map view and satellite tiles are overlayed making it easier to identify existing greenspaces and the portion currently labelled as forested by our dataset. The goal is to make the dataset and user interface as simple as possible to highlight the spaces where communities and individuals can plant more trees
The solution incorporates open data from City Council, logging every publicly owned tree in the city and is used to compare against our model’s detections for assessing accuracy and reliability. This data will also be used to help tune the model to function better with given native trees in the area.
How we built it
After framing our problem statement, we began exploring potential solutions, but we wanted to start with a solid base, like with projects for our customers, we wanted to ensure we best managed the carbon footprint of work we were about to undertake.
As such we leveraged the AWS Well Architected Framework (paying specific reference to the sustainability pillar) to ensure we designed and implemented OpenTreeMap in way to minimise environmental impact e.g. adoption of event-driven architectures and optimising for efficiency.
Next, we investigated the available ASDI datasets and Open Data sources that we knew about in the region. We knew we’d need access to satellite and map data for Belfast, both of which we thought we could get from ASDI Data Exchange. We then began exploring how we could get access to the data and it in a format we could use.
Generating the Satellite Data
There were several challenges when we tried to use the ASDI Sentinel-2 dataset, as the image resolution was not high enough – which is discussed in greater detail in the “Challenges” section. Instead, we decided to use satellite data from Google Earth Pro. This ensured we had high quality imagery in a few days and were not delayed through engaging with third-party satellite providers and signing contracts etc.
Since there is no easy way to export satellite images from Google Earth Pro, our option was to manually create the dataset. The first step was to create a grid for the area we wanted to capture imagery. This grid was generated using a third party tool, with each square being 0.3km in size. The generated GeoJSON file was then converted to a KML file and imported into Google Earth Pro, where it could be displayed on a map. We then needed to create a KML file for each square – which was done by searching for the coordinates of each corner, grouping them into a folder and exporting them from Google Earth Pro into the KML format.
Once that was complete, we then zoomed into each individual square and captured a 4K JPEG image in order to save the satellite imagery. This file would be given the name of that square’s unique ID, as this ensured we knew which one that image refers to. The KML files for each square were then imported into QGIS, as they’re important in the georeferencing process. QGIS’ georeferencer tool was then used to match up the four corners of the JPEG image with a specific coordinate on the map, which generated a GeoTIFF file from that satellite image. As a result, we now have a collection of high quality satellite images that can be used by the machine learning model.
Tree Detection Model
Initially, we looked at developing our own model for detecting trees, but upon investigation we discovered there was a few pre-trained models we could leverage, after some further research we chose one to take forward that allowed for fine tuning. The DeepForest pre-built model was used to identify trees within our satellite images, with Amazon SageMaker used to host and run the Python notebook. Our solution will retrieve the DeepForest model as a Python package, crop the satellite imagery into smaller pieces for better detection and then run it over our GeoTIFF files. Once it has finished processing, the model will return a list of trees it has detected, which are then saved within a CSV file.
We decided to initially focus on a small area in East Belfast and can expand the project’s scope in the future. We ran the ML model over 7 grid squares, with each measuring 0.3km in height and width, and it detected 13,736 trees & bushes within a 0.63km2 area.
When trying to evaluate our model, we used the Belfast City Council dataset for public trees to compare against our results. Our model was able to detect substantially more trees & bushes (18,818 per km2) than those recorded in the council dataset (327 per km2). There are several reasons for this, such as the fact that the council data only records trees that are on public land – it does not extend to private properties. Additionally, the Belfast dataset is based on an area of about 115km2, which contains a lot more variation compared to our area of 0.63km2. It is also worth noting that our model has not been optimised and does contain false positives – this is something we aim to address down the line. Overall, these results are a good foundational step for how we take the project forward and can be improved further.
Creating the Interactive Map
We decided to use the QGIS tool for interacting with our satellite data. Now that we had the satellite images and a list of detected trees, we could then display them on a map.
First, we imported the OpenStreetMap world map into our project file – this provides us with a solid baseline and allows us to check if our GeoTIFF files are showing in the correct place. This was easily achieved using the QuickMapServices plugin.
The GeoTIFF files were imported using QGIS’ built-in tools and were displayed in the correct position. The CSV file of our tree detection results was then exported to a KML file using Google Earth Pro, as this allows us to quickly draw pins for each coordinate. The KML file was then imported into QGIS and changed to a Shapefile, as this gives us greater control over how the pin looks and is styled on the map.
The map was then exported into a Leaflet map using the QGIS2web plugin, which generates the HTML and other elements for us. Finally, we used AWS Amplify to serve this HTML page and an S3 bucket to store all the necessary files. As a result, we can now display our tree detections on a map for the public to view and interact with.
ASDI datasets
Since we could not use the Sentinel-2 Cloud Optimised GeoTIFFs, we decided to use the ADSI OpenStreetMap dataset instead. This was used to display the trees already identified on the OpenStreetMap platform and compare their results with ours & the Belfast City Council dataset. Additionally, this meant our project met the ASDI dataset requirement for the competition.
There was a well-written blog post on the AWS website that detailed exactly how you could query the dataset using Amazon Athena. We followed some of the tutorials and created the Planet table using Athena’s console editor. This table was then queried to find all the trees listed on OpenStreetMap, with it being limited to the Belfast area. These results were saved as a CSV file and imported into Google Earth Pro, which automatically plotted them as pins on the map. They could then be saved as a KML file and imported into QGIS, before being converted into a Shapefile. Similar to the results from the ML model, a Shapefile was used to give us greater control over how the pins are styled on a map. This meant that we could now display the results from the ASDI dataset and Athena query on our map.
These tree results from the OpenStreetMap platform are helpful as they provide insight into how detailed the community-driven map actually is. By including their list of trees, we can compare them against our results and those of the Belfast City Council.
Challenges we ran into
Data
One of the biggest challenges we faced was trying to find high quality satellite images for the machine learning model to detect trees effectively. Initially, we attempted to use the ASDI Sentinel-2 dataset as it contained cloud-optimised GeoTIFF files. However, this data was not of good enough quality, and we were not satisfied that our chosen model would be able to accurately detect trees using it. We then decided to use other data sources instead.
We reached out to our contacts at Planet Labs, who are able to supply this high-quality satellite imagery, but they could not meet with us and deliver it in time. This was a similar situation with other providers, so we decided to use the imagery provided by Google Earth Pro and could manually georeferenced it. This met our requirements, as high-quality satellite data could be used by our ML model.
Machine Learning Model
There were some constraints with the ML model we used to detect trees. One issue is that it has only been trained on tree species in the United States. We believe this can be improved in the future by supplying it with additional data from the Belfast City Council tree dataset, which should fine tune the model and enhance its performance.
Another issue is the fact that the model does not perform as well in urban environments. The developers have warned of this in their documentation, but we can reduce the number of false positives detected by training it with other datasets. For example, we could supply the model with a range of labelled car and building images, which it will then recognise are not trees – therefore, reducing the rate of false positives occurring.
Timing out
With the time delays caused in pivoting to overcome the challenges with satellite image resolution, we had to prioritise work on identifying existing tree cover rather than focusing on the areas where replanting would be of most benefit. Work on this will continue beyond the hackathon we continue engagement our partners.
Accomplishments that we're proud of
- Not starting with a technology solution but taking the time to form opinions through open ideation and using design thinking, external partners and industry experts to validate our hypothesis before committing a line of code.
- Not creating a thought experiment but something with a tangible local impact on the communities within which we operate.
- Collaborative and ongoing third-party relationships formed with Belfast Climate Commission (BCC), Queen’s University Centre for Sustainability, Equality and Climate Action, Ulster University and EastSide Partnership.
- Establishing a roadmap of ideas beyond OpenTreeMap to help Belfast Net-Zero roadmap.
- Future opportunity [beyond the pilot] to obtain a seat on the Belfast Climate Commission panel as we help identify practical climate interventions and their co-benefits with the use of ASDI datasets and AWS technologies.
- Tackling one of the more overlooked but essential components of addressing climate change, community engagement, and change.
- Training a model which is known not to perform well in urban environments and using it within an urban environment.
What we learned
Through engagement with our partners and leveraging existing research we learnt that there are many direct and indirect co-benefits of tree planting. Through OpenTreeMap we aim to socialise these co-benefits at a community level to encourage positive climate action.
Source: ‘Economic Benefits of Local Climate Action’, Placebased Climate Action Network (PCAN). Link to report
Economic benefits of tree planting
- A conservative estimate of the economic benefit of a tree ranges from £1,200 to £8,000 per tree
- The cost of an urban street tree starts at around £6 (excluding maintenance)
- Using this model, planting 6,000 trees strategically located across a large English town would provide benefits of £48m over 50 years or nearly £1m per year
- Based on this figure, the Government’s £40m investment has the potential to reap a return of £320 billion over the next half-century
Job creation
- Planting trees could create 36,000 green jobs during the woodland restoration phase, generating £366 million in added value to the economy.
- For every £710,000 invested in woodland restoration a total of 40 direct and indirect jobs are created
- 25 jobs are created for every 100 hectares of woodland
- Increasing the amount of woodland in the Greater Manchester area could generate 2,300 new jobs in the city region
In retail
- Retail and hospitality businesses can benefit from such interventions: Shoppers are willing to go shopping more frequently, travel further and visit for longer times in shopping areas with pleasant tree cover. Consumers in an academic study said they were willing to pay up to 12% more for goods and services in shopping areas with large, well cared for trees.
Residential
- Trees and greenery visually improve a street/area
- Poorer areas often have lower canopy cover and are also disproportionately affected by other environmental issues such as air pollution.
- A US study found that lower-income neighbourhoods and minorities were significantly more likely to live in heat-prone neighbourhoods.
In health
- Air pollution is ‘likely’ to raise dementia risk
- There is no scientific consensus that urban trees reduce asthma by improving air quality. In some circumstances, urban trees can degrade air quality and increase asthma. Link to study
Technical
- Techniques and tools needed to feed satellite imagery into ML models
- Methods to georeference satellite imagery, such as those provided by QGIS
Other
- A useful way to remove carbon emissions from the atmosphere
- There is a dip in UK woodland’s ability to capture CO2 as felled trees are not replaced
- Prevent flooding
- Improve air quality
- Falling crime: for every 10% increase in tree canopy cover there is a 15% decrease in violent crime and a 14% decrease in property crime, even when controlling for other socio-economic factors
What's next for OpenTreeMap
Continuing to collaborate with our local partners and using our roadmap, we will explore how ASDI datasets and the AWS Cloud Platform can facilitate community engagement and encourage broader climate action. We foresee OpenTreeMap becoming a broader community engagement platform providing the climate action link between local communities and local authorities.
Building on the pilot activities in East Belfast and learning from what works and doesn’t, we will extend the platform's reach to encompass further communities aspiring for a global reach.
Improved data and data quality
- Train deepforest model to identify tree species/types/age/size
- Understand what native tree species to increase
- Carbon absorption rate for their age
- Improve tree detection, size and estimates using ASDI LiDAR datasets
- Cross-reference data and create a learning model to identify unused industrial sites and brownfield locations to target replanting opportunities.
- Improve the viability of replanting recommendations by cross-referencing with existing services placement e.g. water/sewage pipes and electrical lines.
- Investigate the access and value of soil data to determine average tree health and carbon absorption level.
- Expand the data model to include:
- All Belfast
- All Northern Ireland
- All UK
Expand the scope of the tool
Having recently gained access to additional datasets, we will look at expanding the existing tool into a platform supporting climate action across many facets including:
- Applying home efficiency (EPC) data and house sale prices to estimate the impact of nearby housing stock and encourage smart interventions.
- Using LiDAR data to help estimate tree size/age
- Bringing in Land and Property Service data and location data to help determine property type and distance to parks, commercial premises and brownfield sites to best determine the best place to target resolutions.
- Nominate properties for improved insulation
- Existing placement and optimal locations for microgeneration/renewable energy
- Planning of neighbourhood routes/charging stations for electric vehicles
Educate and drive policy
- We want to work with the East Belfast Partnership to educate the community of East Belfast to understand the co-benefits of climate action and understand how this activity can change behaviours. Initially, this is about encouraging tree replanting but looking forward we want to encourage further changes e.g. altering perspectives toward public transport, and encouraging plant-based diets.
- Prove: Increasing trees + decreasing CO2 levels in a street/area = Increase in EPC ratings and property price?
- Work closer with the University of Ulster on EPC and property data
- Can we educate homeowners/landlords to be more responsible for insulating their homes and properties?
- Can this data encourage possible renters to consider EPC ratings before signing a rental agreement?
- Can we use the tool to create a platform to help drive policy decisions on home insulation by targeting and prioritising
- Building on the work of the drawdown project, demonstrate the co-benefits of climate action in terms which resonate at a community level.
Contribute Back
- Creating an automatic way of extending the Belfast Tree open data register to account for all public and private trees in the city. Using this method as-is tree coverage and change in the same can be reasoned about over time.
- Having applied the DeepForest learning model in an urban environment we wish to contribute back our learnings from doing this in addition to using it to identify non-American tree species.
Description of Attached Images
- Grid_generator.png – shows the tool used to generate a grid for East Belfast, which was necessary for georeferencing the satellite images
- Map_key.png – describes the different map icons and what they represent. These include the trees detected by the ML model, those provided in the Belfast City Council dataset, and the trees plotted on OpenStreetMap
- Park_view.jpg – outlines the Greenville Park area of East Belfast, with our satellite imagery overlayed on top of the OpenStreetMap data. Trees from all three datasets are shown on the map, which is particularly visible in the lower half of the image
- Park_view_belfast_council_trees_only.jpg – the same view of Greenville Park. However, only trees identified in the Belfast City Council dataset are shown
- Park_view_model_trees_only.jpg – the same view of Greenville Park. However, it only shows the trees detected by the ML model
- Park_view_osm_trees_only.jpg – the same view of Greenville Park. However, it only shows the trees plotted on the OpenStreetMap platform
- Park_zoomed_in_view.png – provides a close-up view of a section in Greenville Park. You can clearly see the trees identified by all three datasets. There is a lot of similarity between our model’s dections and those in the council dataset. Additionally, you can see some of the trees plotted on OpenStreetMap (visible on the left hand side)
- Wide_view.png – shows a wider view of the East Belfast area and gives an overview of where we applied the ML model
Built With
- amazon-athena
- amazon-web-services
- aws-amplify
- aws-codecommit
- deepforest-ml-model
- google-earth-pro
- jupyter-notebook
- python
- qgis
- sagemaker


Log in or sign up for Devpost to join the conversation.