-

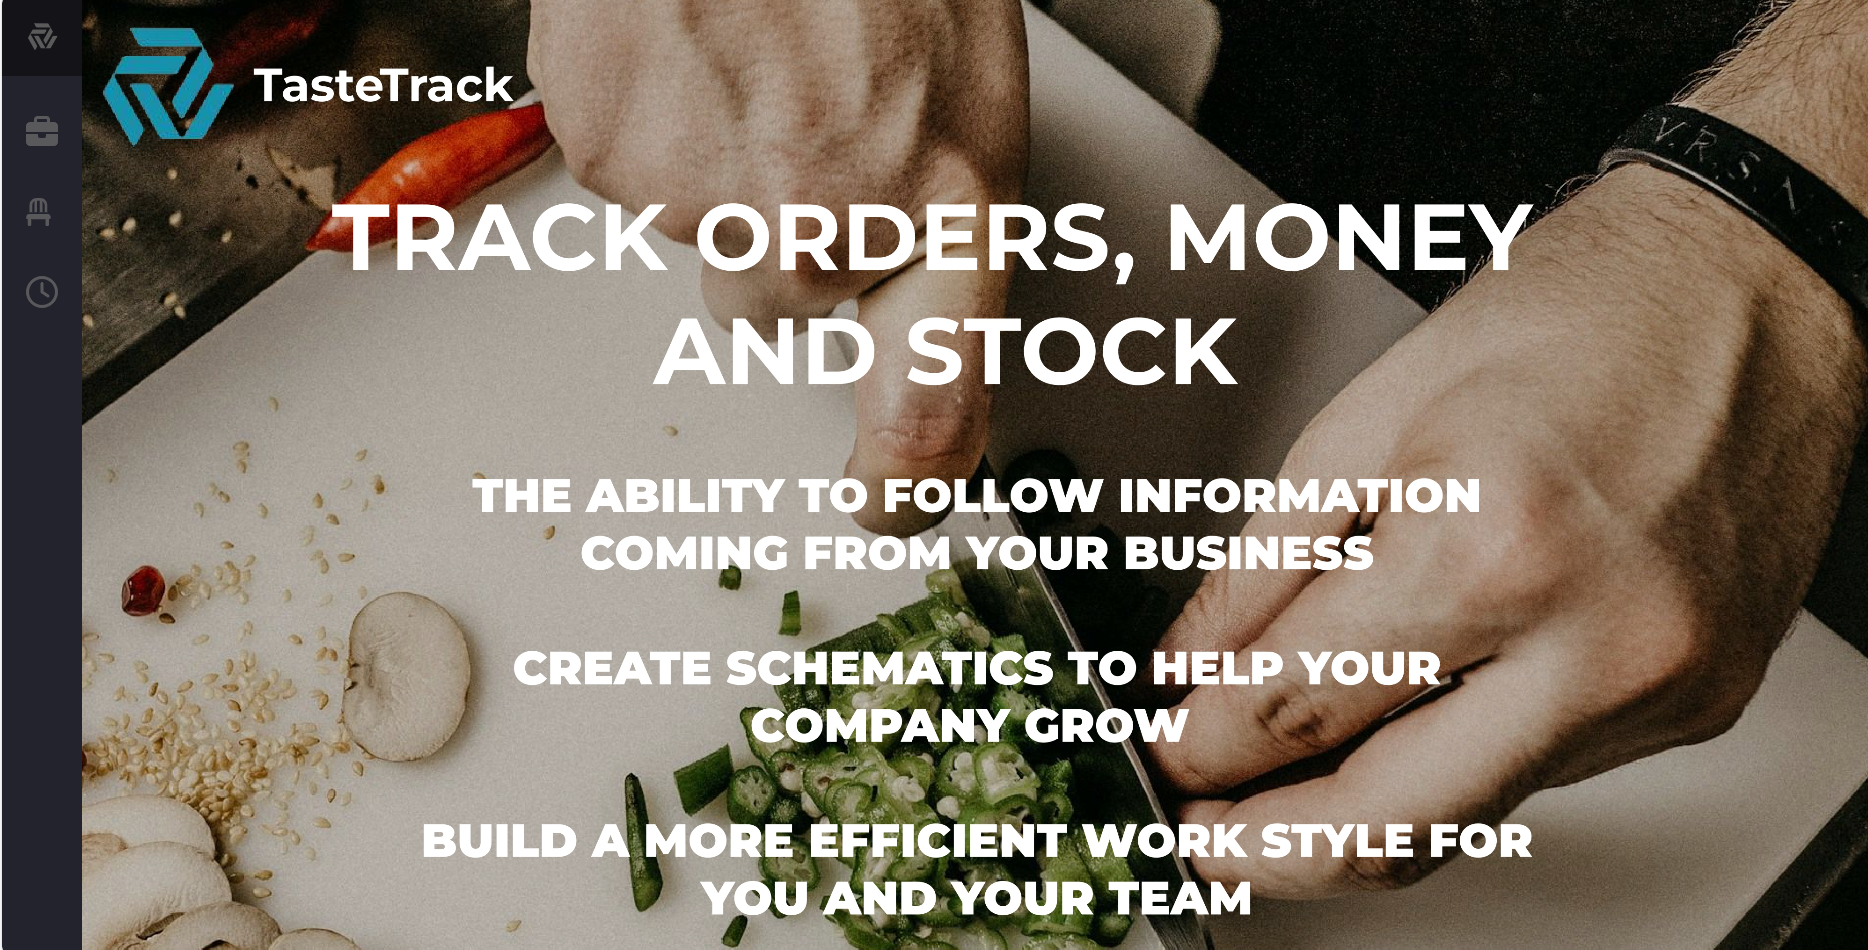
front page
-
code
Inspiration
When we heard about the two available topics our minds immediately thought of ways that we can make the lives of workers easy. After we brainstormed many of our ideas, we decided to write a program that would aid managers or owners of restaurants.
What it does
This program takes in and analyzes the data of orders and then proceeds to create graphs of stock and most popular orders to help find trends within the store.
How we built it
We used HTML and CSS to create the front end of our program and then used JavaScript and python to create the back end and more complex parts of our program.
Challenges we ran into
We ran into many challenges when we were trying to store the data we received from our website. This problem was also correlated to the creation of our graphs.
Accomplishments that we're proud of
We are very proud of the product we've been able to create within this short amount of time. We are also proud of our organization and ability to create a helpful product.
What we learned
We learned how to proficiently use HTML and CSS, how to create graphs using Chart.js and how to graphically design the front end of our website.
What's next for TasteTrack
After this hackathon we would like to continue this project and add more functions to the website and hopefully turn this into a product that can have real life or later uses.

Log in or sign up for Devpost to join the conversation.