Inspiration
A small brand that opens a store or a pop-up bets a lease on one neighbourhood. Big chains buy foot-traffic and demographic data. A roaster with three cafes, a streetwear label with one pop-up budget, or an indie bookshop picks on gut feel, a broker's pitch, or a chatbot.
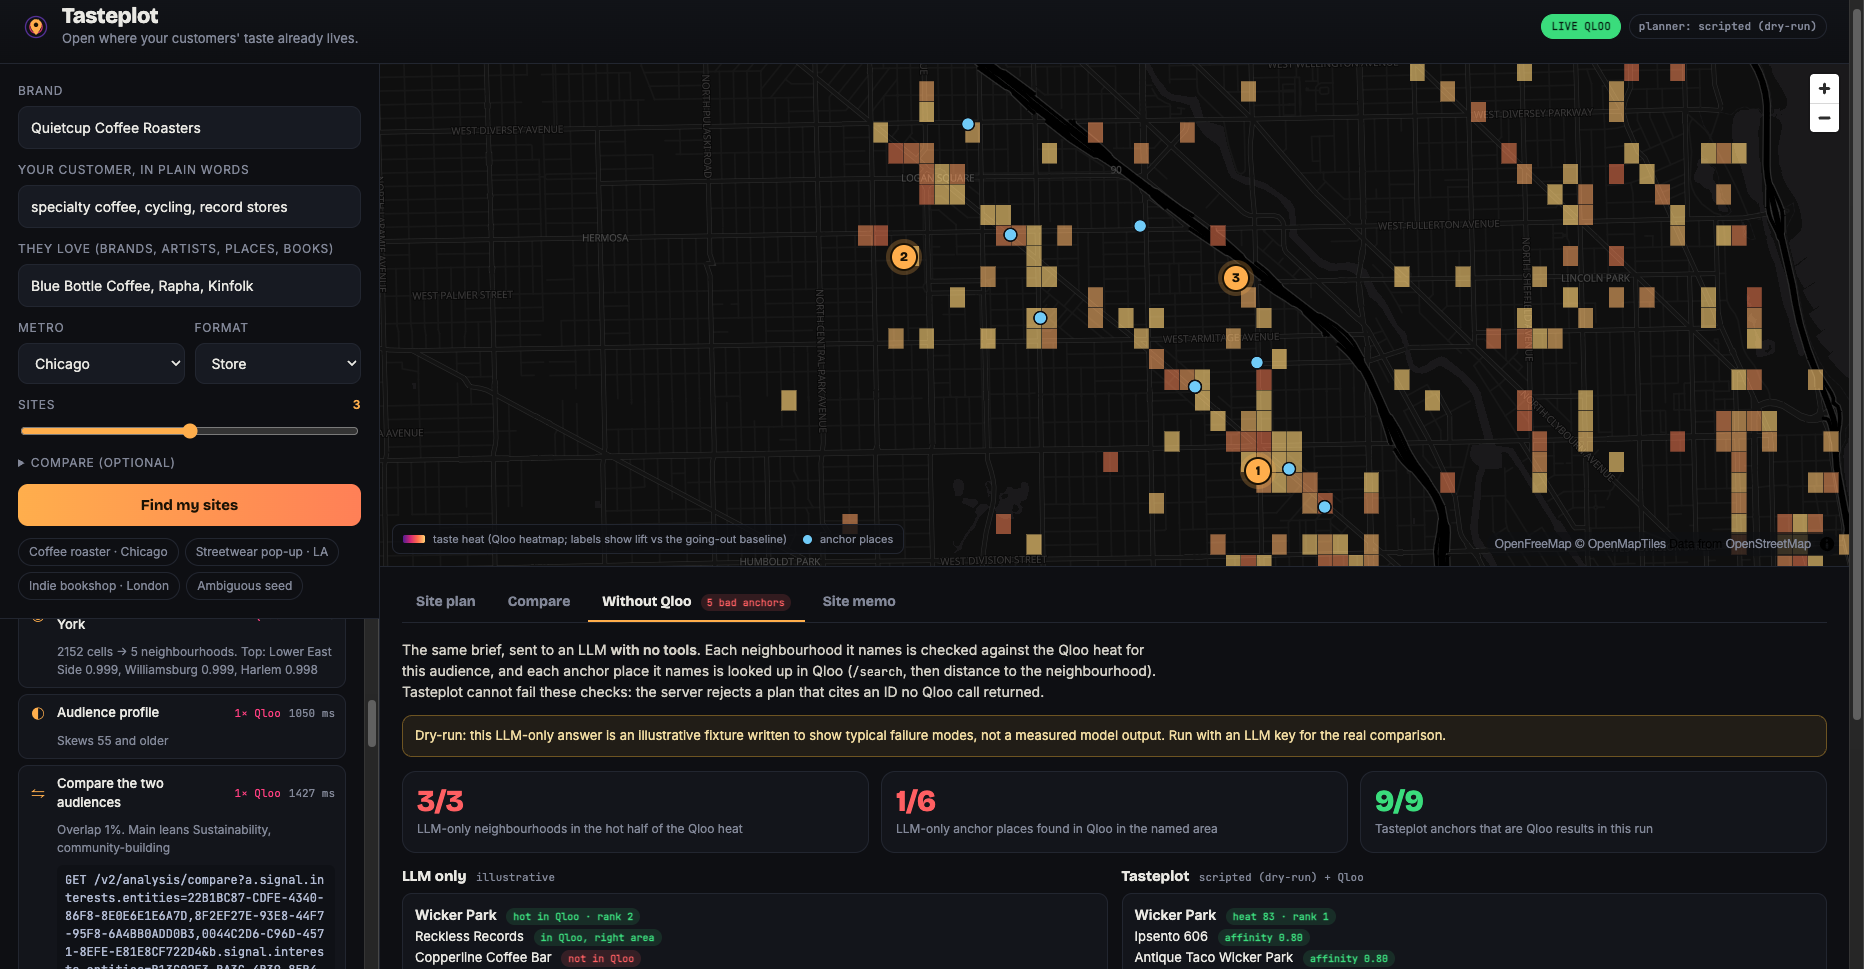
We asked a chatbot. It picked neighbourhoods by reputation, invented cafes, and put real shops in the wrong part of town. Qloo's taste graph knows something a chatbot does not: where the people who love what your customers love actually cluster, and which places and brands nearby they already love.
What it does
A brand describes its customer in plain words ("specialty coffee, cycling, record stores") and names a few things those customers love (Blue Bottle Coffee, Rapha, Kinfolk). It picks a metro. An agent then:
- Resolves the audience into Qloo entities (search) and Qloo tags (it turns the plain words into taste keywords). On an ambiguous seed (try "Patagonia": a brand and a region), it stops and asks.
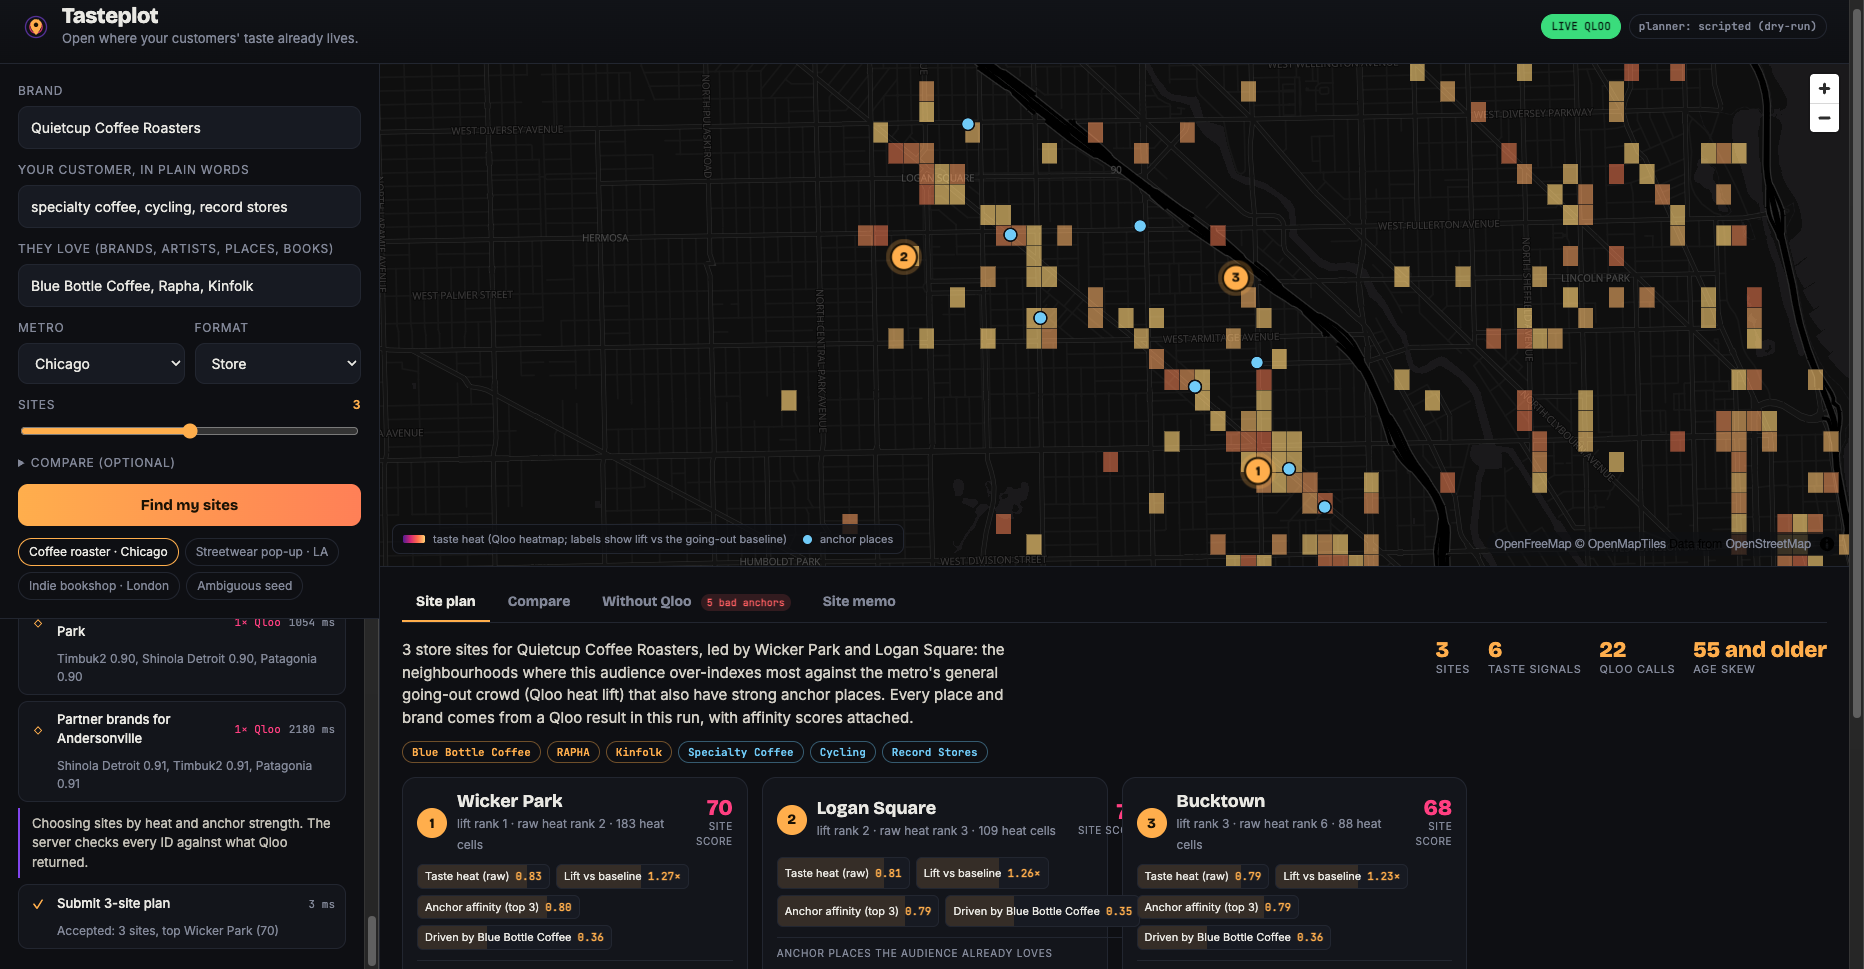
- Maps the taste with the Qloo heatmap for the metro and snaps the heat cells to named neighbourhoods. Raw heat follows general activity, so busy downtowns win for everyone. A second heatmap for a generic going-out audience (fans of restaurants) is the baseline, and neighbourhoods rank by lift: where this audience over-indexes. In Chicago, coffee people now land in Wicker Park and Logan Square and outdoor people in Bucktown and Lincoln Park; before, both got River North.
- Profiles the audience (aggregate age and gender skew) for the marketing angle.
- Scouts the hottest neighbourhoods in parallel: places inside each one that the audience already loves (anchor tenants, co-marketing partners), with explainability.
- Finds partner brands loved by the audience and by the fans of each neighbourhood's top anchor.
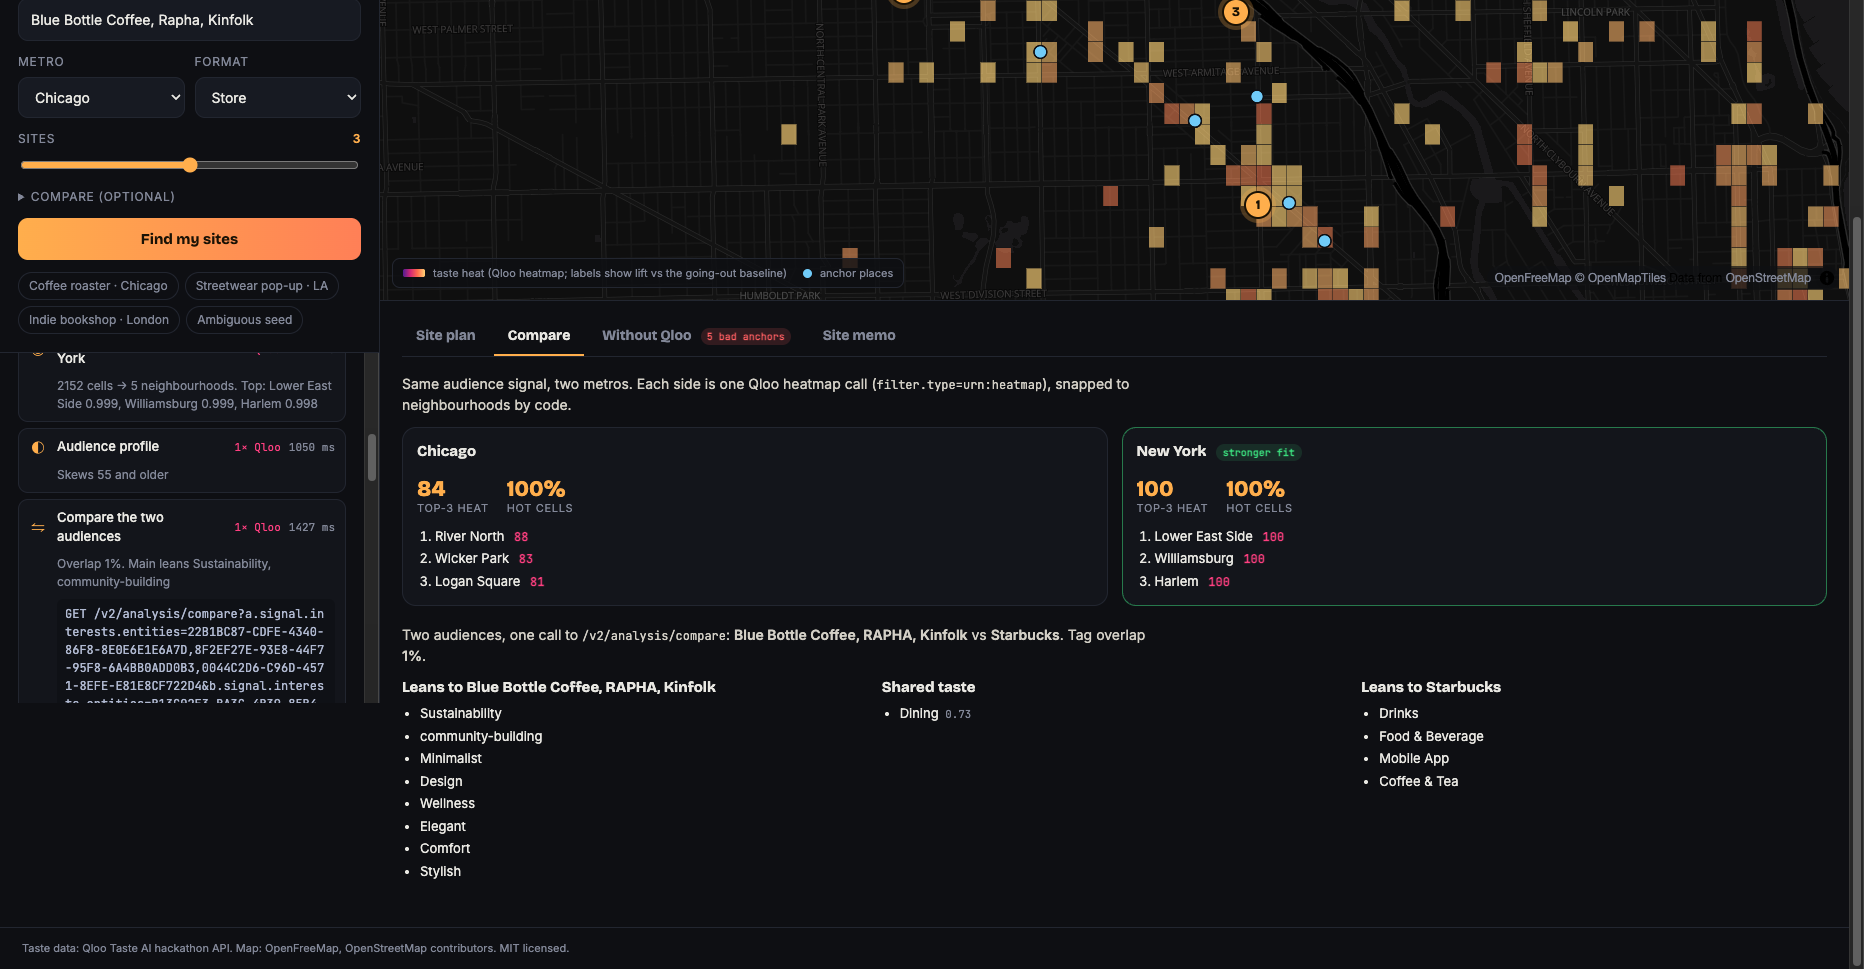
- Compares (optional): the same audience in a second metro, or a second audience (Starbucks fans vs yours) with Qloo's compare analysis.
- Submits the site plan. The server rejects any plan that cites an ID no Qloo call returned in this run. Code scores and orders the sites.
- Shows the why on every site: raw taste heat, lift vs the baseline, anchor affinity, and which of your seeds drove each pick.
- Compares with an LLM that has no tools ("Without Qloo" tab) and checks each of its neighbourhoods and places against Qloo. The comparison answers for the sample briefs are illustrative examples of typical LLM mistakes, written by hand and labelled as such; for other briefs the $0 demo says that it has no LLM to ask. The eval script that measures the real rate with an LLM key ships in the repo.
- Exports a one-page site memo for a real-estate or expansion meeting.
Qloo-powered: why it needs Qloo
Without Qloo, Tasteplot has no input. Every decision is a Qloo signal:
| Decision | Qloo call |
|---|---|
| Who the audience is, as signals | /search (seeds) and /v2/tags (plain words) |
| Which neighbourhoods | /v2/insights with filter.type=urn:heatmap, filter.location.query=<metro>, divided by a baseline heatmap (signal.interests.tags=urn:tag:genre:place:restaurant) for lift |
| Which places to anchor on | urn:entity:place with filter.location (WKT point), radius, audience signals, feature.explainability=true |
| Which brands to partner with | urn:entity:brand with the audience plus the top anchor as signal, and signal.location at the neighbourhood |
| Marketing angle | urn:demographics |
| This audience vs another | /v2/analysis/compare |
| This metro vs another | a second heatmap call |
22 Qloo calls per 3-site brief with both comparisons (measured live on 2026-10-06; the baseline call is cached per metro for 7 days). Every call shows in the live trace panel; click a step to see the request.
How we built it
- Agent loop (TypeScript): provider-agnostic. 7 typed tools defined with zod and sent to the model as JSON Schema. Parallel tool calls per turn, turn and call budgets, and a grounding check on
submit_site_plan. - Planner. For the public demo, a scripted policy drives the same tools in the same order, at $0. The loop also runs Claude or any OpenAI-compatible model with one setting. The UI labels which planner made each plan.
- Qloo client: one method per workflow, a parameter check per
filter.typebuilt from Qloo's per-type tables (Qloo ignores invalid parameters silently), retry with backoff, a call budget, and a KV cache. One adapter file is the only code that reads Qloo JSON. - Fixture world: a synthetic taste graph for Chicago, New York, Los Angeles and London (43 neighbourhoods) in the documented wire shapes. It made the whole app and its tests run before the API key arrived.
- Web app: React and MapLibre (OpenFreeMap tiles). Geohash heat cells, anchor pins, live trace, site cards, compare, side-by-side, memo download. Works on a phone.
- Hosting: one Cloudflare Worker (Hono) serves the API and the app. Sample plans ship as recorded static files (0 Qloo calls). Qloo responses are cached in KV for 7 days and finished plans for 30 days. A daily cap on fresh Qloo calls (250) and a per-IP limit (10 new plans an hour) protect the monthly quota; the trace panel shows what is left.
- AI tools: we built Tasteplot with AI coding tools (Claude Code), which wrote most of the code and tests under our direction. We chose the idea, reviewed the code, and are responsible for it.
Challenges we ran into
- No API key for the first days. We built a fixture world in the documented wire format and listed every response-shape assumption in
docs/QLOO_API_ASSUMPTIONS.md. When the key came, we checked each one live: place coordinates and explainability were right; the compare response, demographics (one item per signal) and seed lookup were different, and only the adapter and the lookup changed. - Chains and namesakes. Searching "Starbucks" or "Blue Bottle Coffee" returns single stores before the brand, and "Haruki Murakami" is an author, an artist and a person. Tasteplot looks up taste entities only, keeps one per type, and asks only when a name is truly two things (a region and a brand).
- Silent parameter failures. Qloo returns 200 OK and ignores a parameter that does not fit the
filter.type. We encoded the docs' per-type parameter tables, so a wrong parameter fails loudly in tests. - Popularity bias. Raw heat ranked River North, Downtown LA and Marylebone first for every audience. An all-ages baseline did not fix Chicago; a going-out baseline (fans of restaurants) did. Details:
docs/LIFT.md. - Heat cells have no names. The heatmap returns geohash cells. We snap them to a neighbourhood gazetteer so a brand reads "Wicker Park", not "dp3wq".
- Grounding. A model likes to "improve" a plan with a famous shop it remembers. The server-side ID check makes that impossible, not just discouraged.
Accomplishments that we're proud of
- Every neighbourhood, place and brand in a plan traces back to a Qloo call in the same run.
- The "Without Qloo" tab makes Qloo's value visible in one click.
- The agent asks instead of guessing when a seed name is ambiguous.
- One brief gives a memo a founder can take into a broker meeting.
What we learned
- Taste data is most useful for supply-side decisions (where to open, with whom), not only for consumer recommendations.
- Let the model choose and explain. Let code snap, score and verify. The split keeps the output honest.
- Explainability turns a recommendation into an argument: "Driven by Blue Bottle Coffee 0.76" is something a founder can repeat to an investor.
What's next
- Rent, vacancy and foot-traffic layers next to taste, so the shortlist meets the budget.
- Any metro: build neighbourhood shapes from Qloo localities instead of a fixed gazetteer.
- Portfolio mode for chains: score existing stores, then find the next site that looks like the best one.
- Pop-up calendars: the same audience, scored by week with Qloo trends.
Built With
- anthropic-claude
- claude-code
- cloudflare-kv
- cloudflare-workers
- hono
- maplibre-gl
- openfreemap
- qloo
- react
- typescript
- vite
- vitest
- zod
