Inspiration
I know that whenever venues try to cater to tourists, they almost always fall into lazy clichés. If Berliners visit Lisbon, typical advice suggests playing techno and serving currywurst. In reality, travelers visit Lisbon for sunlit tiled courtyards, natural pet-nats, and batch brews not tired clichés from back home. When you ask standard LLMs for advice, they double down on these tourist tropes because they don't have real cultural context. I wanted to give independent hospitality owners a practical tool backed by real cultural data, so they can adapt their service, playlist, and drinks menu to who is actually visiting without losing what makes their spot special.
What it does
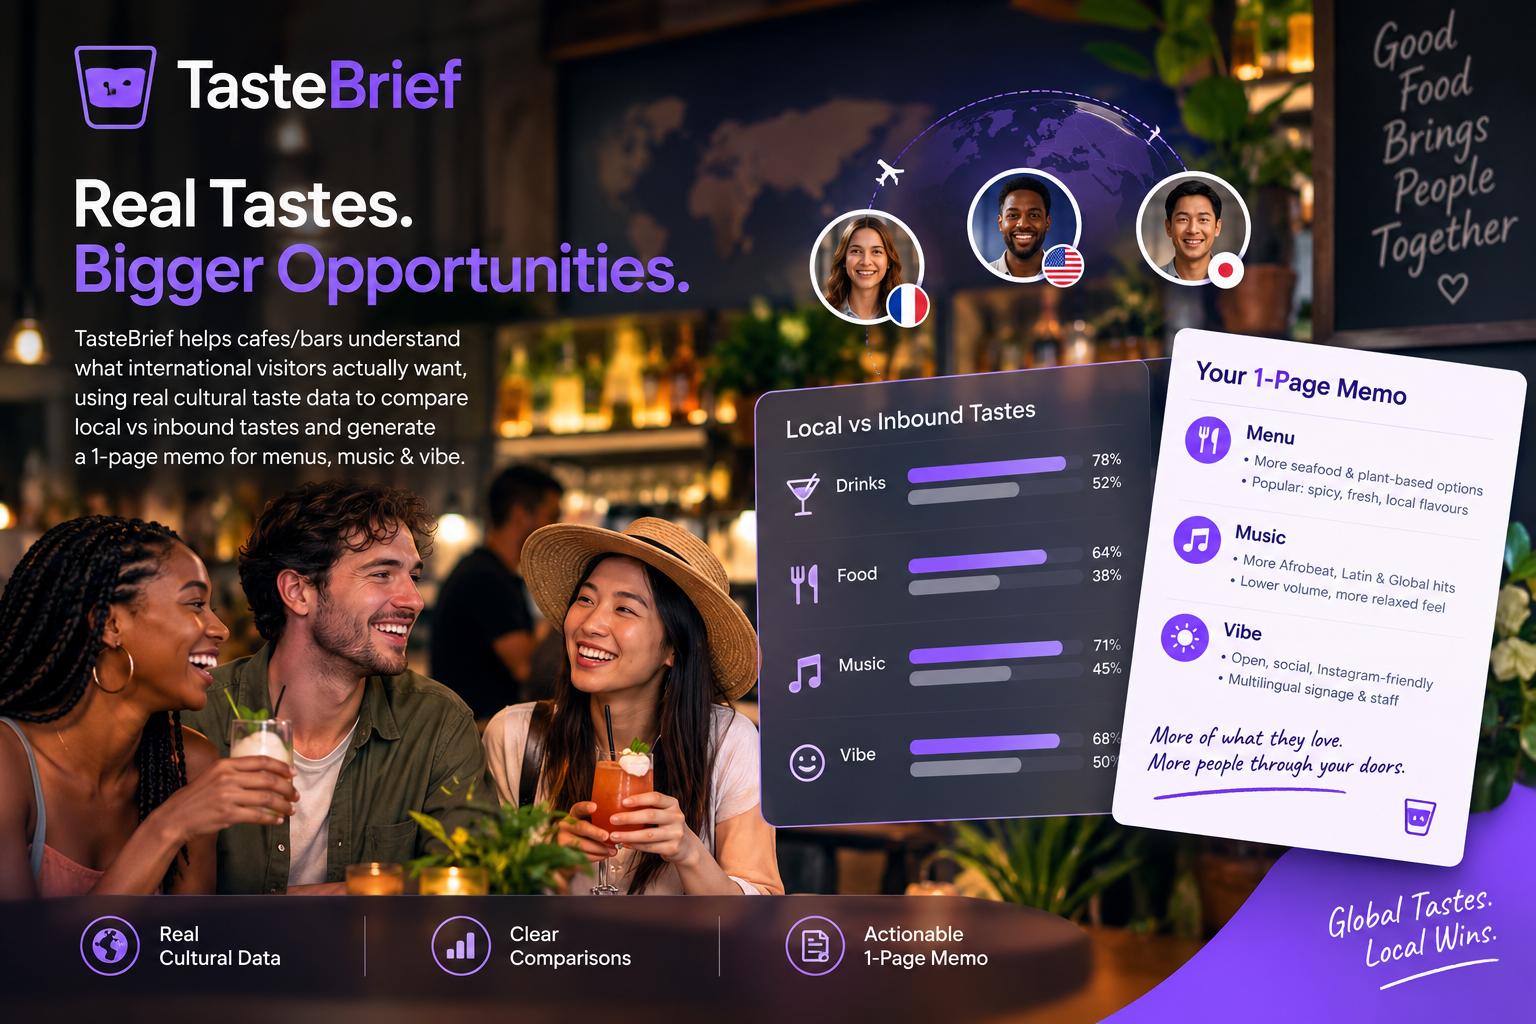
TasteBrief takes a destination city (where your venue is) and an origin city (where your guests are traveling from) and runs a direct comparison:
- Identifies which local spots and sub-categories (like natural wine, filter coffee, or vinyl listening spaces) over-index or surge among incoming visitors compared to local baselines.
- Uses harmonic overlap to pick artists and sounds that resonate with both the local scene and incoming travelers, organized by time of day (daytime, aperitivo, late night).
- Puts ungrounded AI stereotypes side-by-side with real taste graph data so owners can see exactly why standard assumptions fail.
- Generates an operational brief ready to print and hand straight to the bar or kitchen team, covering beverage adjustments, spatial vibe, sound curation, and local partnership ideas.
- Features a built-in network inspector so users can see the exact API queries, response times, and payloads behind the recommendations
How we built it
Built with Next.js App Router, React 19, TypeScript, and Tailwind CSS. I designed the UI with warm editorial hospitality tones and clean print stylesheets (@media print) so the 1-page action memos look sharp on paper. Integrated Qloo's /v2/insights endpoint. The server orchestrates dual-query comparisons (destination domestic baseline vs. inbound visitor signal) across places (urn:entity:place) and artists (urn:entity:artist). Built a custom math layer (lib/affinity-engine.ts) that calculates true percentage lift, computes tag divergence across venue types, and uses the harmonic mean across listening graphs to find crossover artists without arbitrary offsets. Integrated Google Gemini via the @google/genai SDK (gemini-3.5-flash-lite). I constrained it strictly with JSON schemas to turn the math and entity graphs into concise, operational venue memos and side-by-side benchmark proof tests.
Challenges we ran into
When an inbound cohort strongly prefers a venue or artist that isn't in the top domestic ranking, there's no baseline score to calculate a simple ratio against. I had to build a floor-threshold fallback mechanism based on the lowest observed scores to calculate realistic lift percentages without breaking the math. Real-world API responses can sometimes shift between nested arrays like results.entities, direct arrays, or variations in tag structures. I had to write defensive parsing to normalize place and artist data cleanly before passing it to the math engine.
Accomplishments that we're proud of
- Every insight, venue lift score, and crossover artist comes directly from live Qloo API calls and real math.
- It bridges digital data intelligence with the physical hospitality floor. An owner or manager can hit "Print" and hand a clean, styled brief straight to their staff.
- The built-in network inspector modal, which makes debugging and verifying live API round trips and parameters completely transparent.
What we learned
Working with cultural taste graph data taught me that cross-market preferences are subtle and counter-intuitive. Inbound travelers don't want their home country replicated abroad; they gravitate toward local spots that match their specific lifestyle habits (like pet-nat bars or specialty roasters). Grounding an LLM in structural graph data completely transforms its output from generic stereotype into genuine operational intelligence.
What's next for TasteBreif
- Adding seasonal and event-based filtering (e.g., tailoring recommendations for major local festivals, conferences, or seasonal travel waves).
- Direct Spotify playlist generation based on the Music Bridge recommendations.
- Multi-origin blending, allowing a venue to analyze mixed crowds (e.g., visitors from Paris and London in the same week).
