-
-
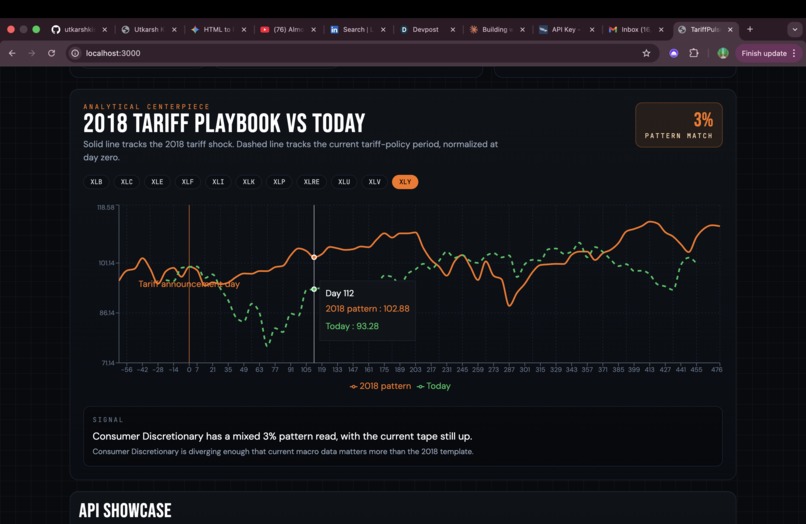
Comparison with 2018 Tariff Depression and Similarity
-
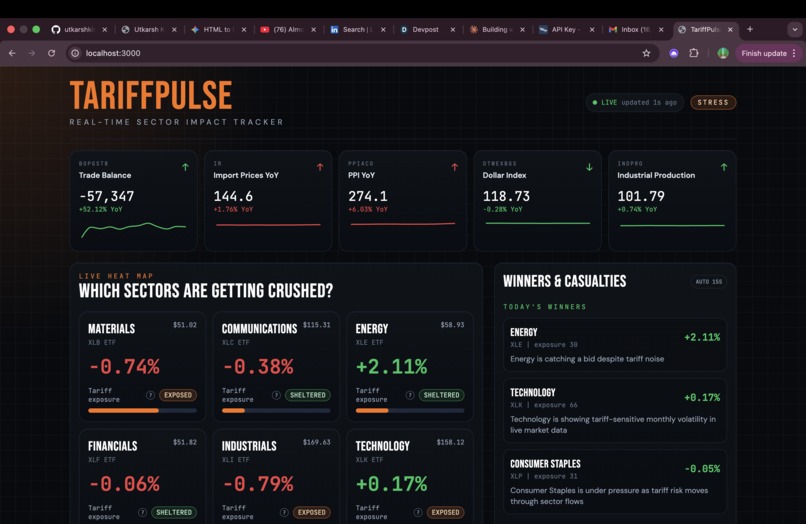
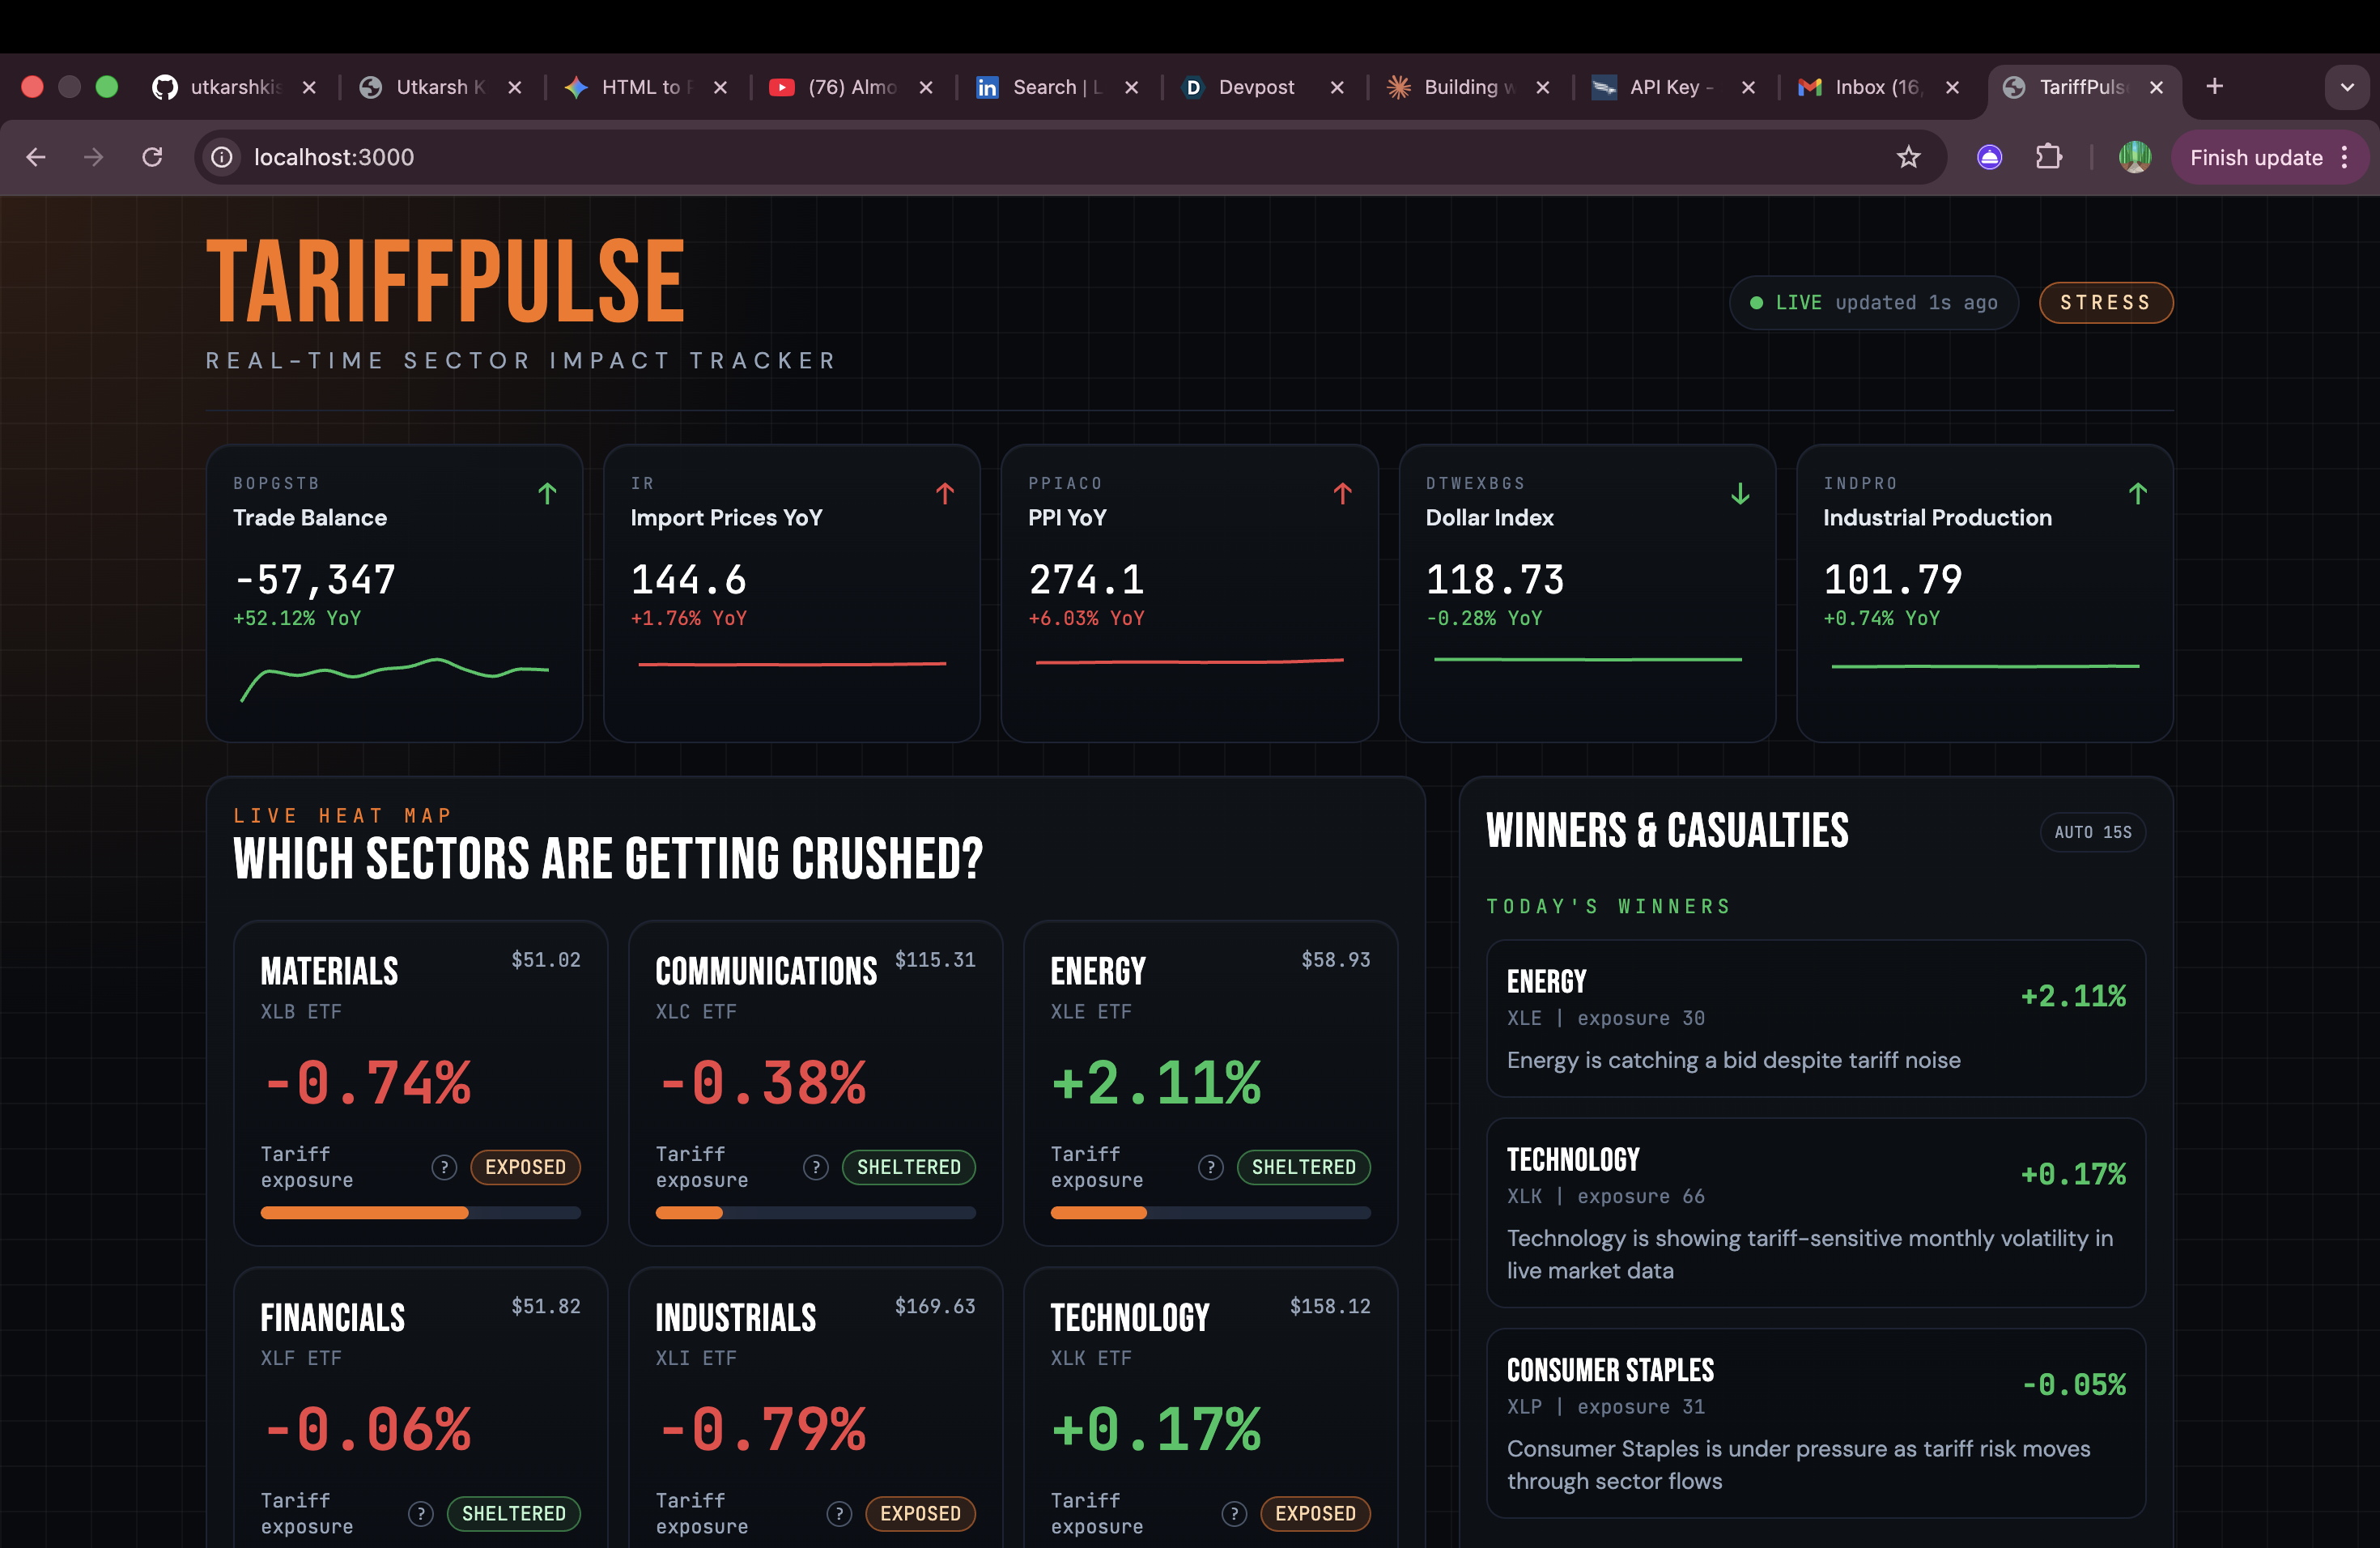
Economic Indicators
-
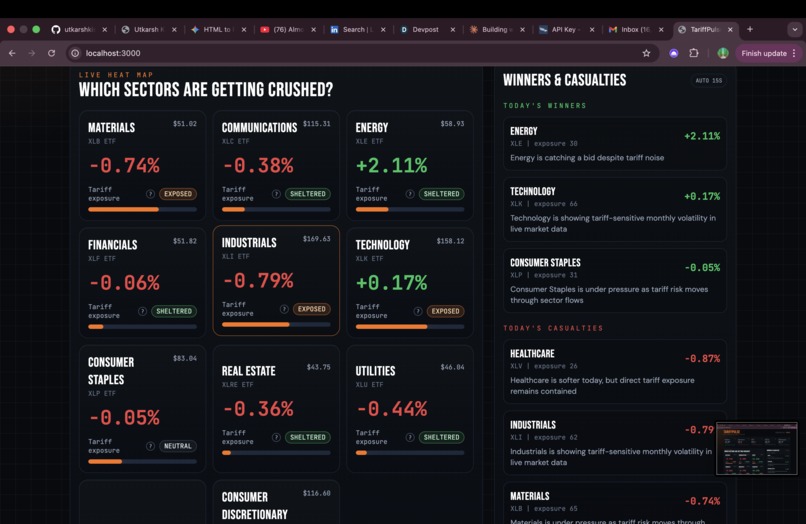
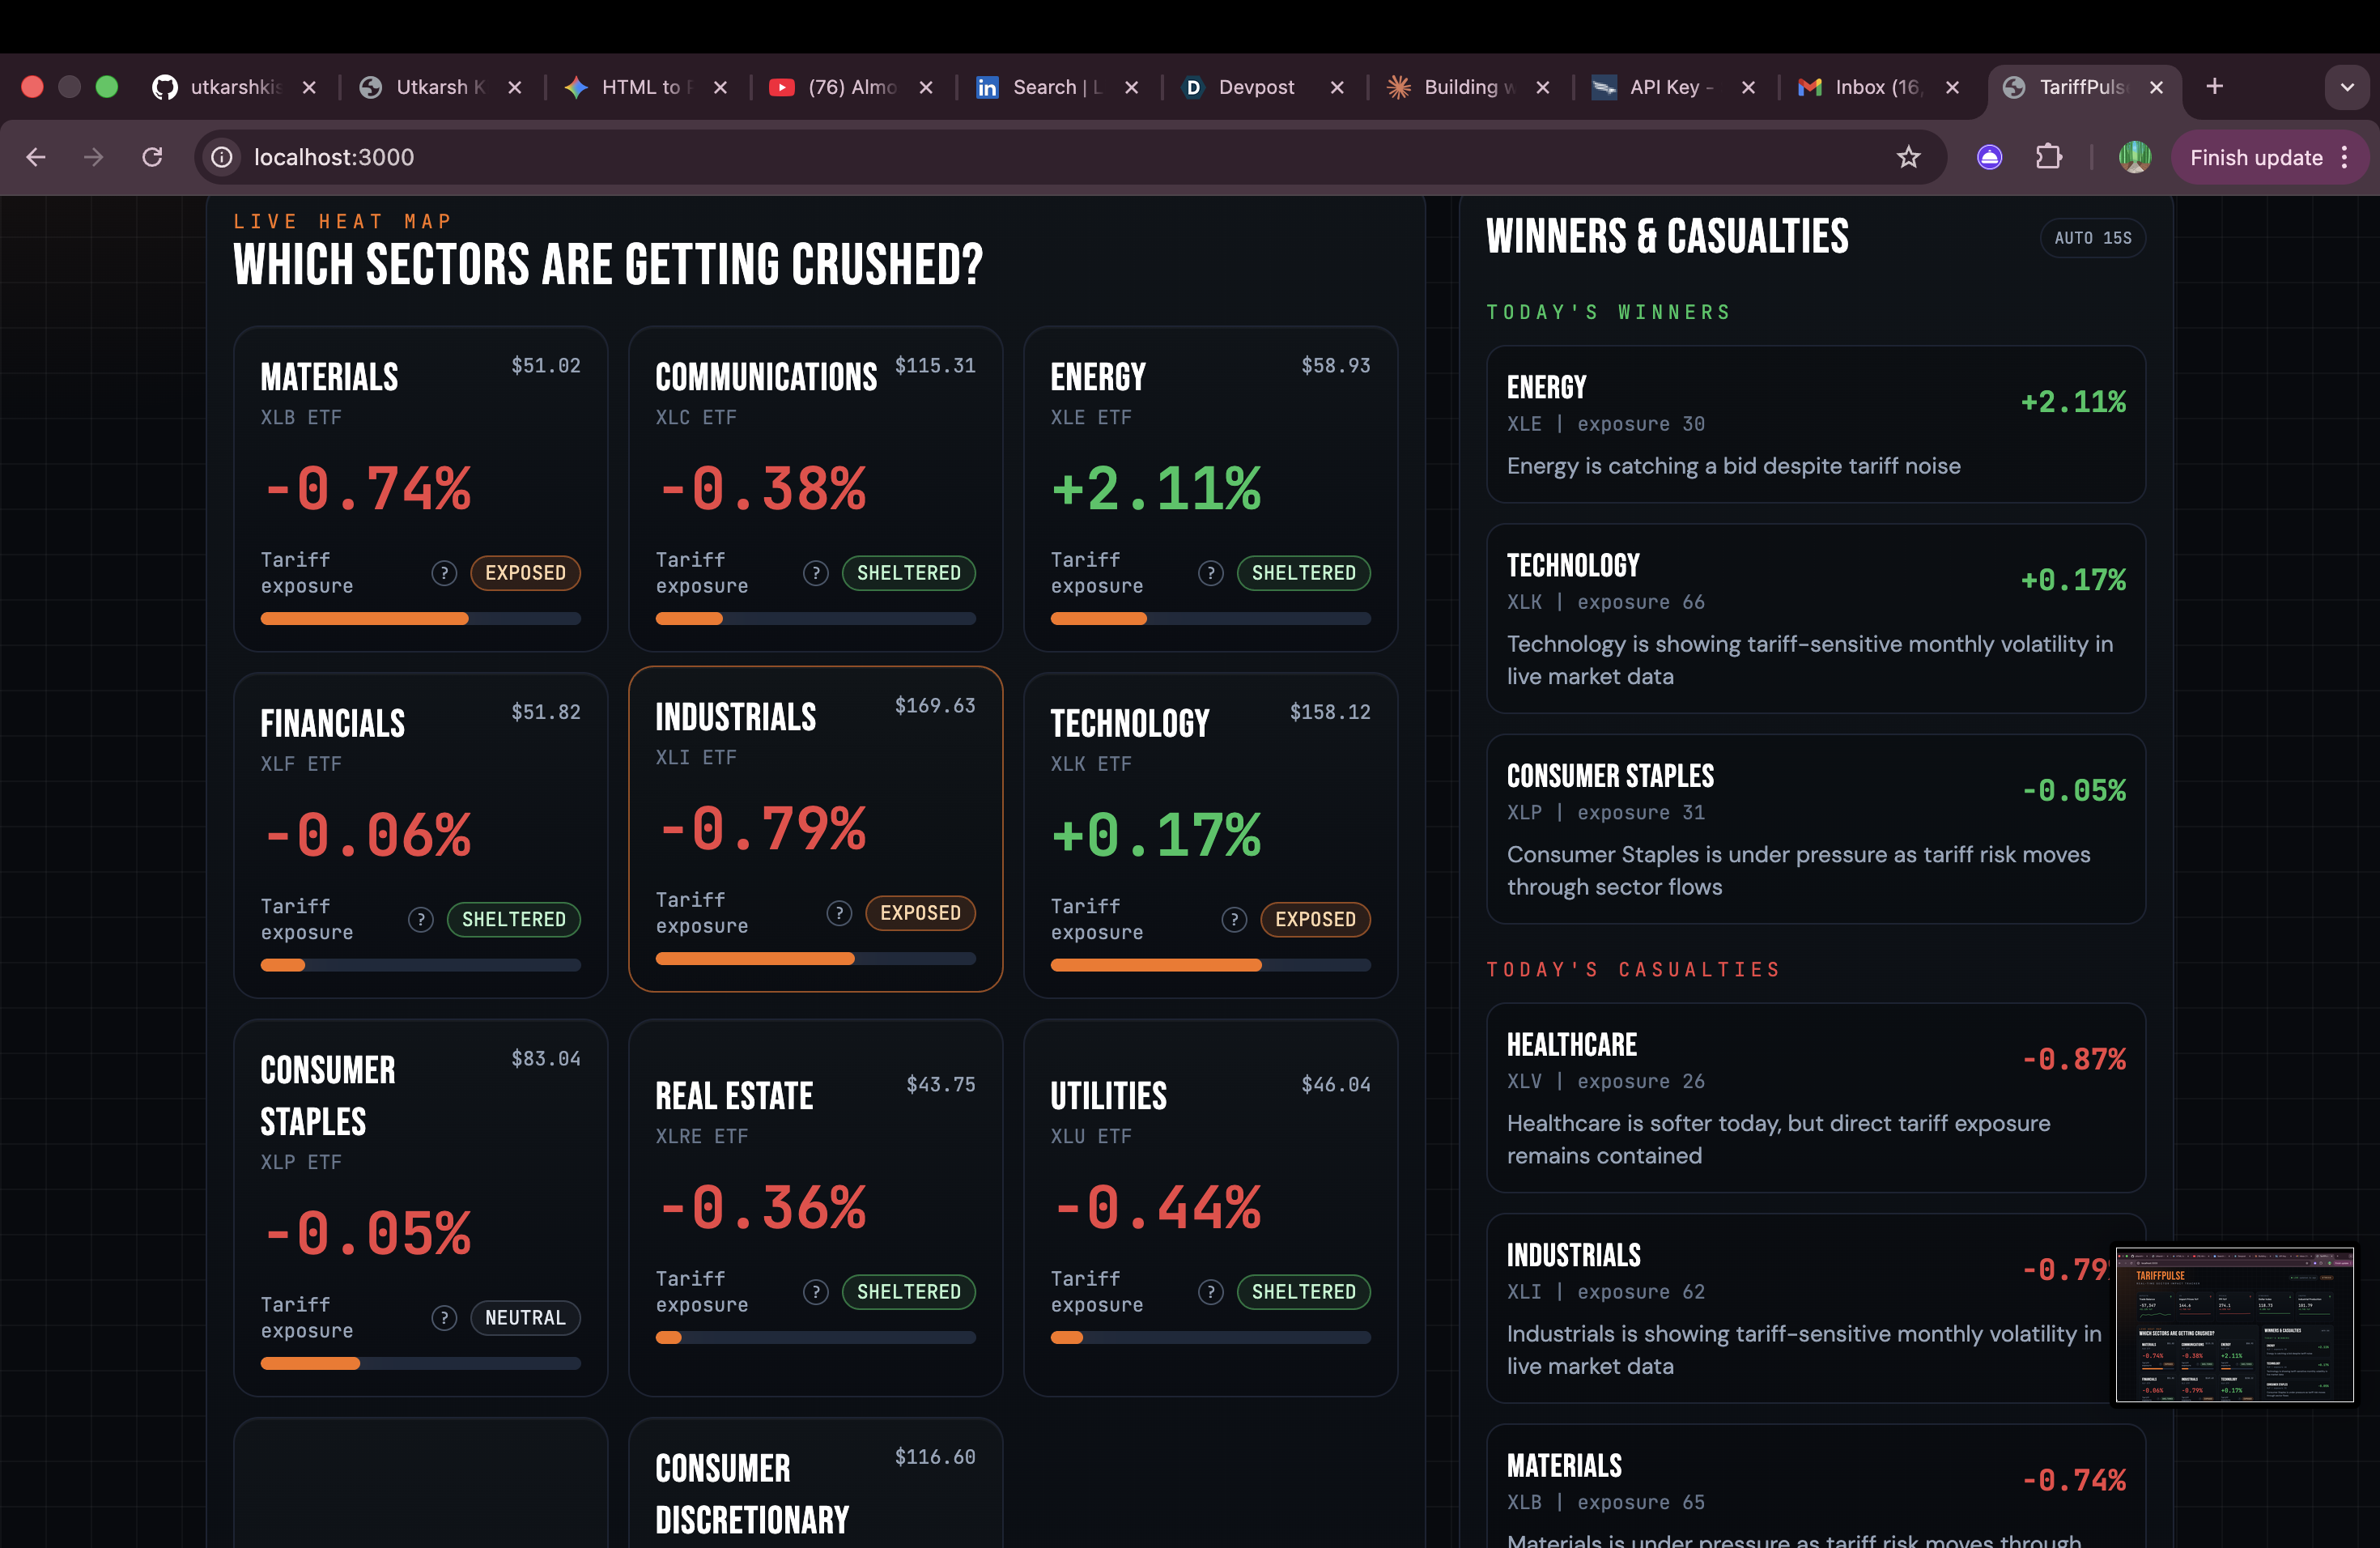
Market Trading Price for each sector
Inspiration
- Tariffs can move markets quickly, but the impact is hard to see sector by sector.
- We wanted a live dashboard that explains which industries are most exposed to trade-war risk.
What it does
- Tracks live sector ETF prices and percent changes.
- Shows which sectors are winning or getting hit today.
- Adds a tariff exposure score for each sector.
- Compares today’s market pattern with the 2018 tariff period.
- Uses macro indicators to show whether the economy is calm, stressed, or shocked.
How we built it
- Built the frontend with Next.js and React.
- Used Tailwind CSS for the Bloomberg-style dashboard UI.
- Used FastAPI with yfinance for live and historical market data.
- Used FRED data for macroeconomic indicators.
- Stored cached snapshots in SQLite.
Challenges we ran into
- Getting live market data to refresh during market hours.
- Making dense financial cards readable without text overflow.
- Combining real market data with a simple tariff-risk scoring model.
- Keeping the dashboard fast while calling multiple live data sources.
Accomplishments that we're proud of
- Built a real-time sector heat map using live market data.
- Created a clear tariff exposure model that beginners can understand.
- Added historical comparison against the 2018 tariff shock.
- Made the dashboard demo-friendly and visually polished.
What we learned
- Financial data needs careful caching and refresh logic.
- Daily market candles are not enough for live dashboards.
- Good visual design matters when explaining complex market signals.
- Combining macro data with market data makes the story much stronger.
What's next for TariffPulse
- Add news sentiment from tariff-related headlines.
- Add alerts when a sector’s tariff risk spikes.
- Improve the scoring model with more data sources.
- Add company-level analysis inside each sector.
- Deploy the app publicly with production data pipelines.
Built With
- fastapi
- fastapi-market-data-api:-yahoo-finance-via-yfinance-macro-data-api:-fred-api-database:-sqlite-charts/data-viz:-recharts-state-management:-zustand-runtime/tooling:-node.js
- fred-api
- javascript
- next.js
- node.js
- npm
- python
- python-frontend:-next.js
- react
- recharts
- sqlite
- tailwind-css
- tailwind-css-backend/api:-next.js-api-routes
- typescript
- uvicorn
- uvicorn-development-platform:-cursor
- yahoo-finance
- yfinance
- zustand

Log in or sign up for Devpost to join the conversation.