Inspiration
Looking at today's market, when the US Government introduced the tariff rate on Indian goods
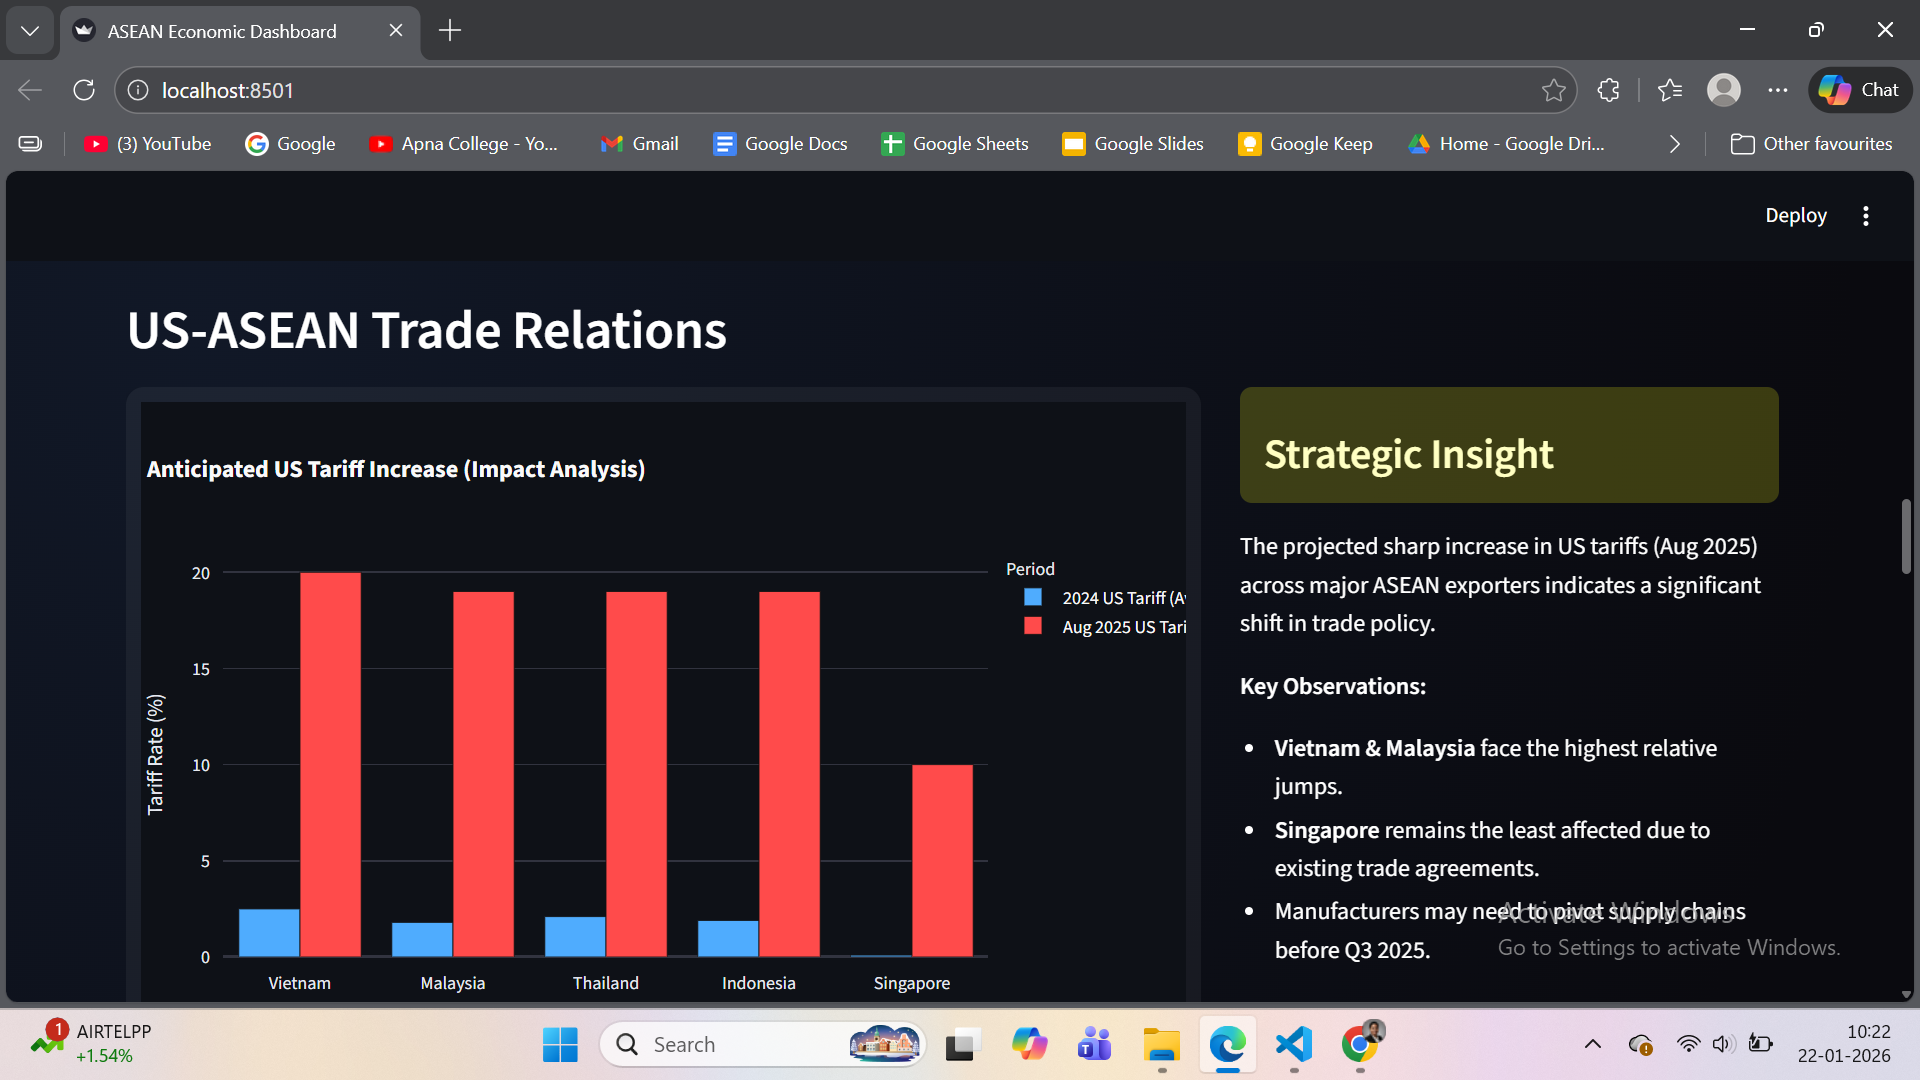
What it does
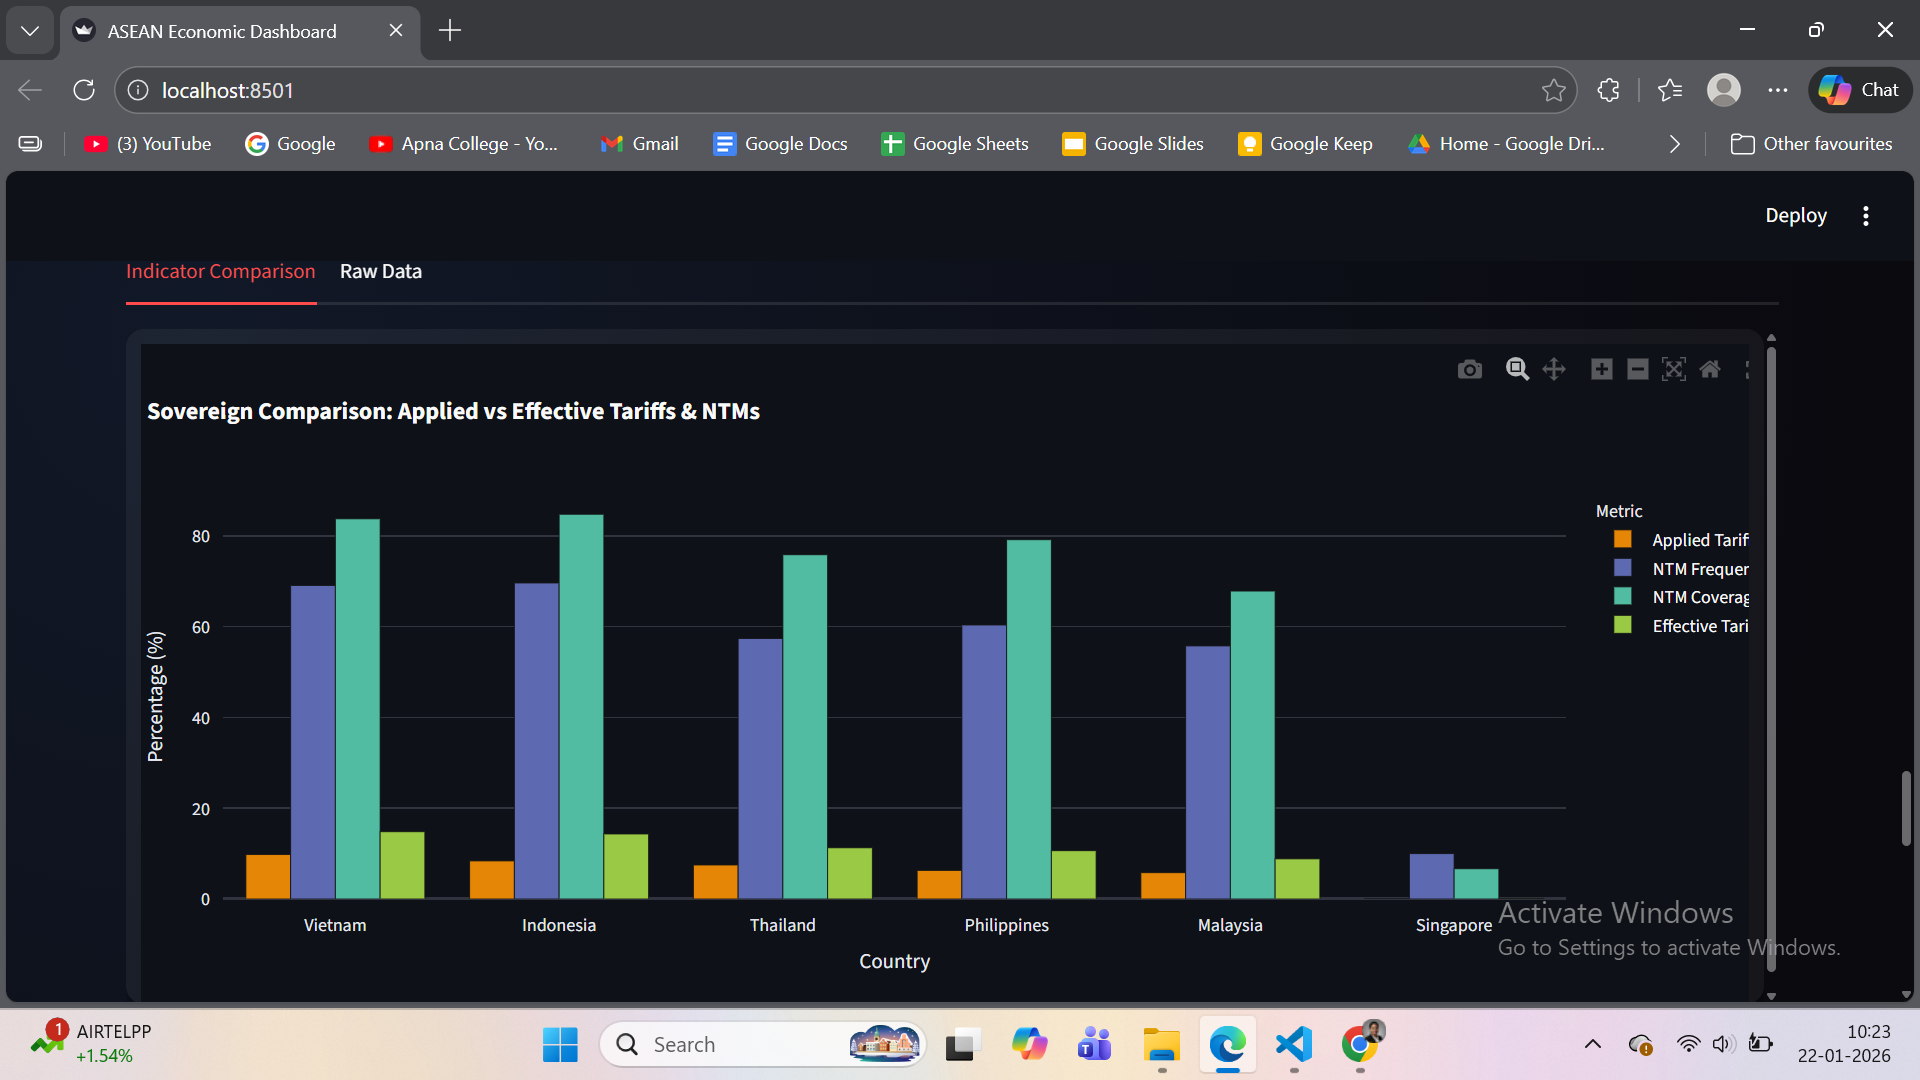
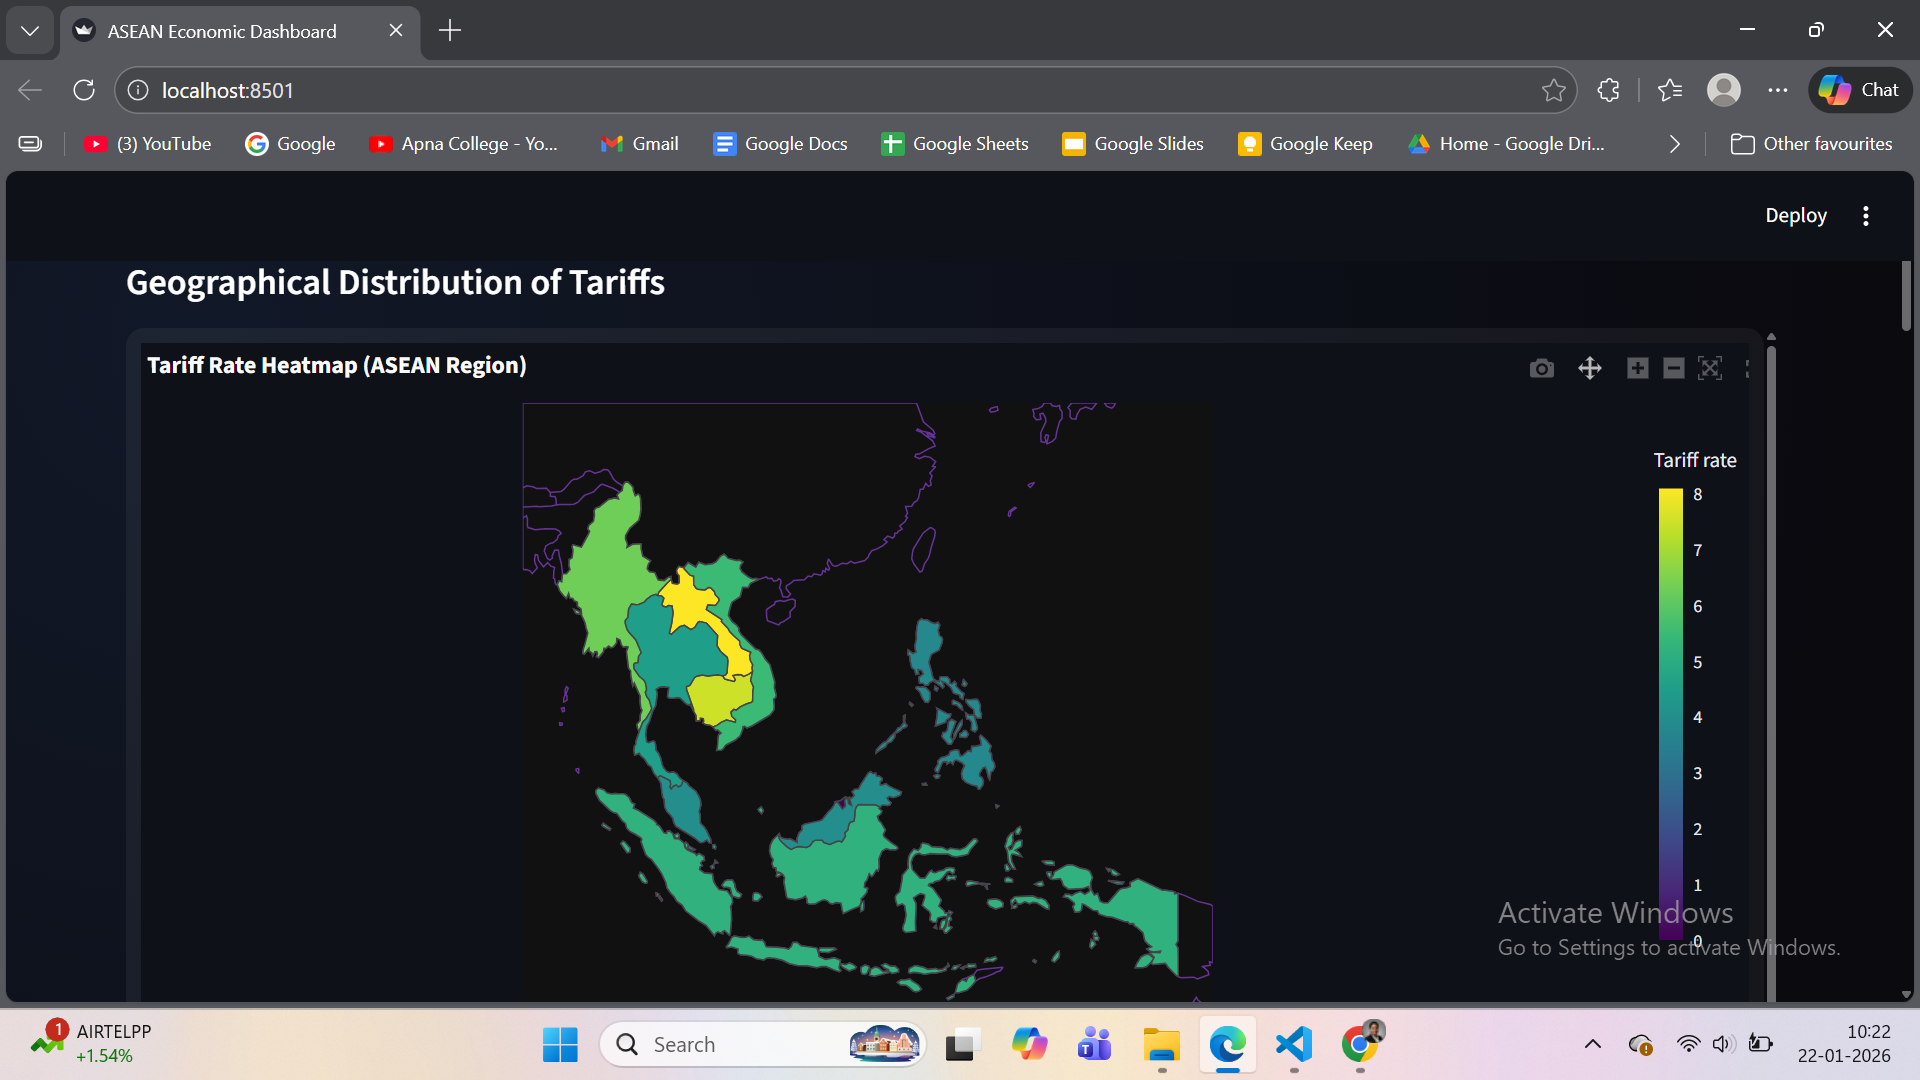
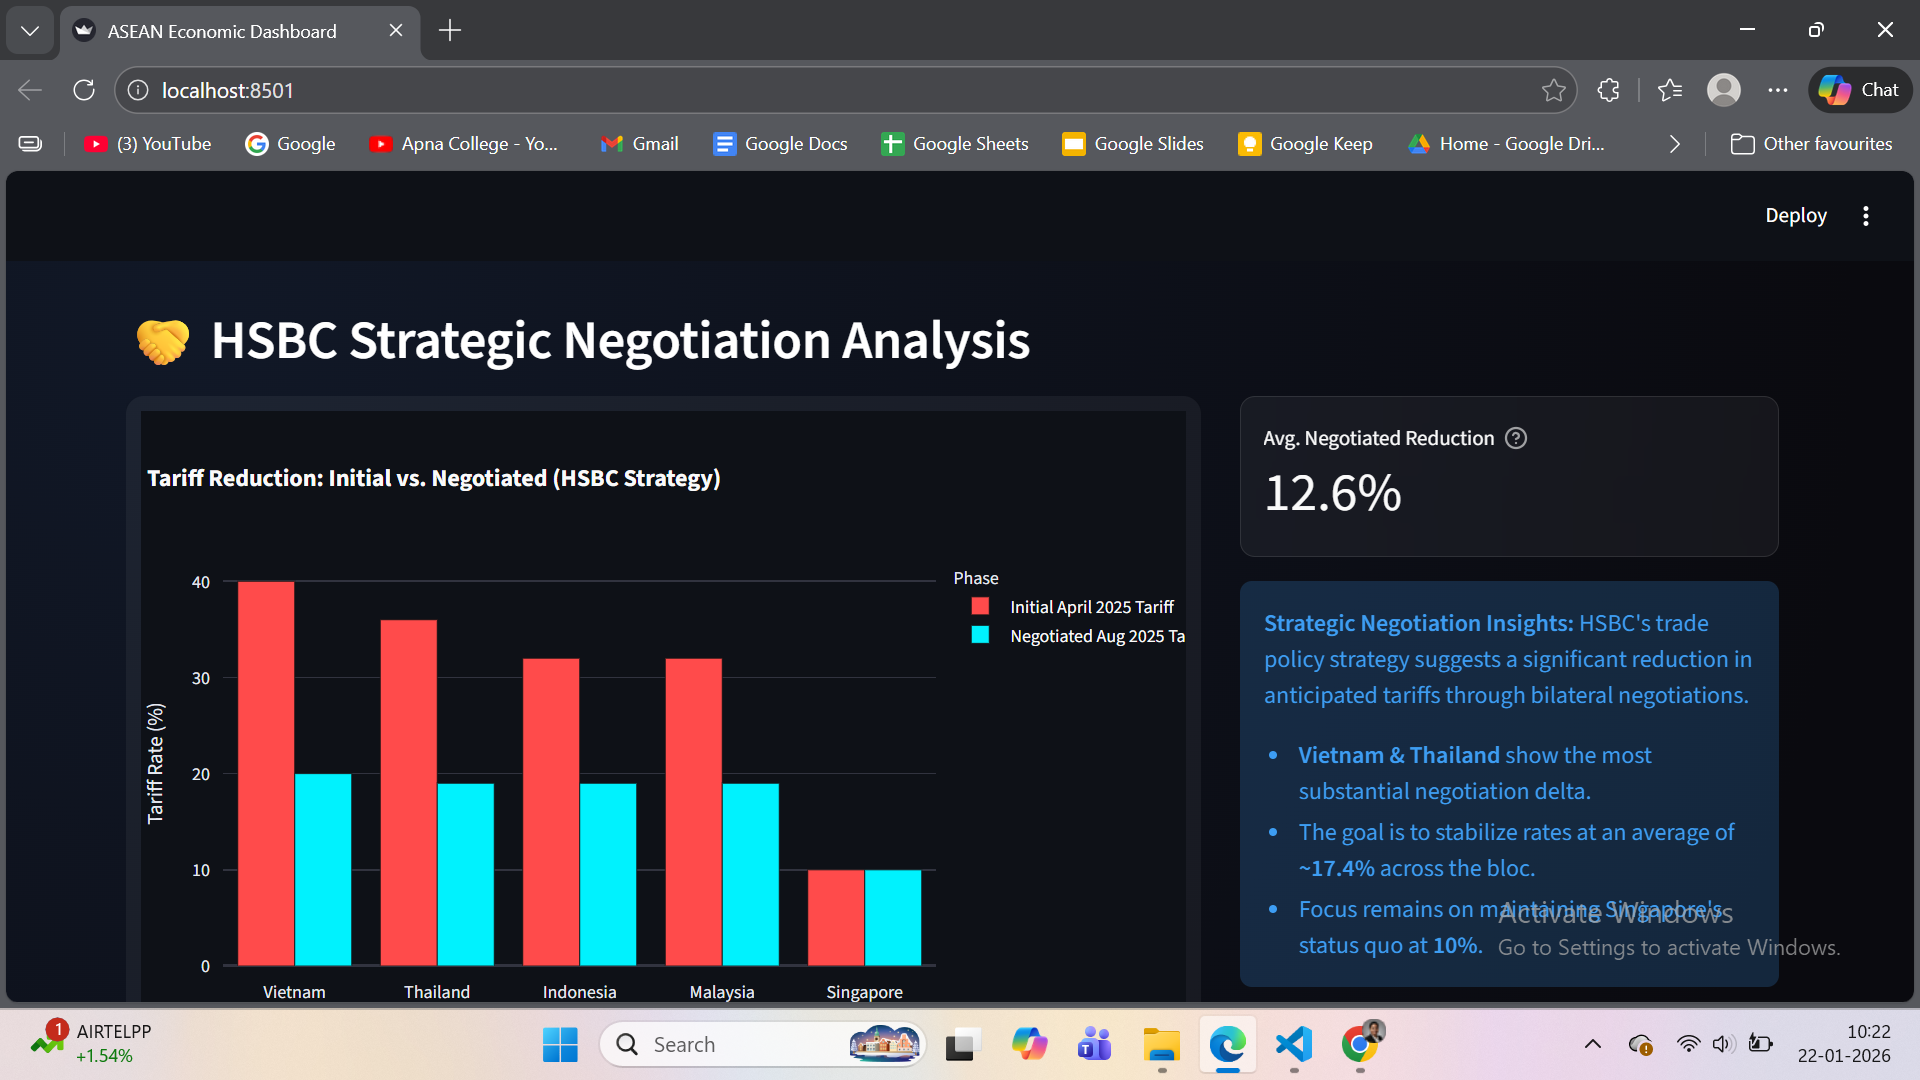
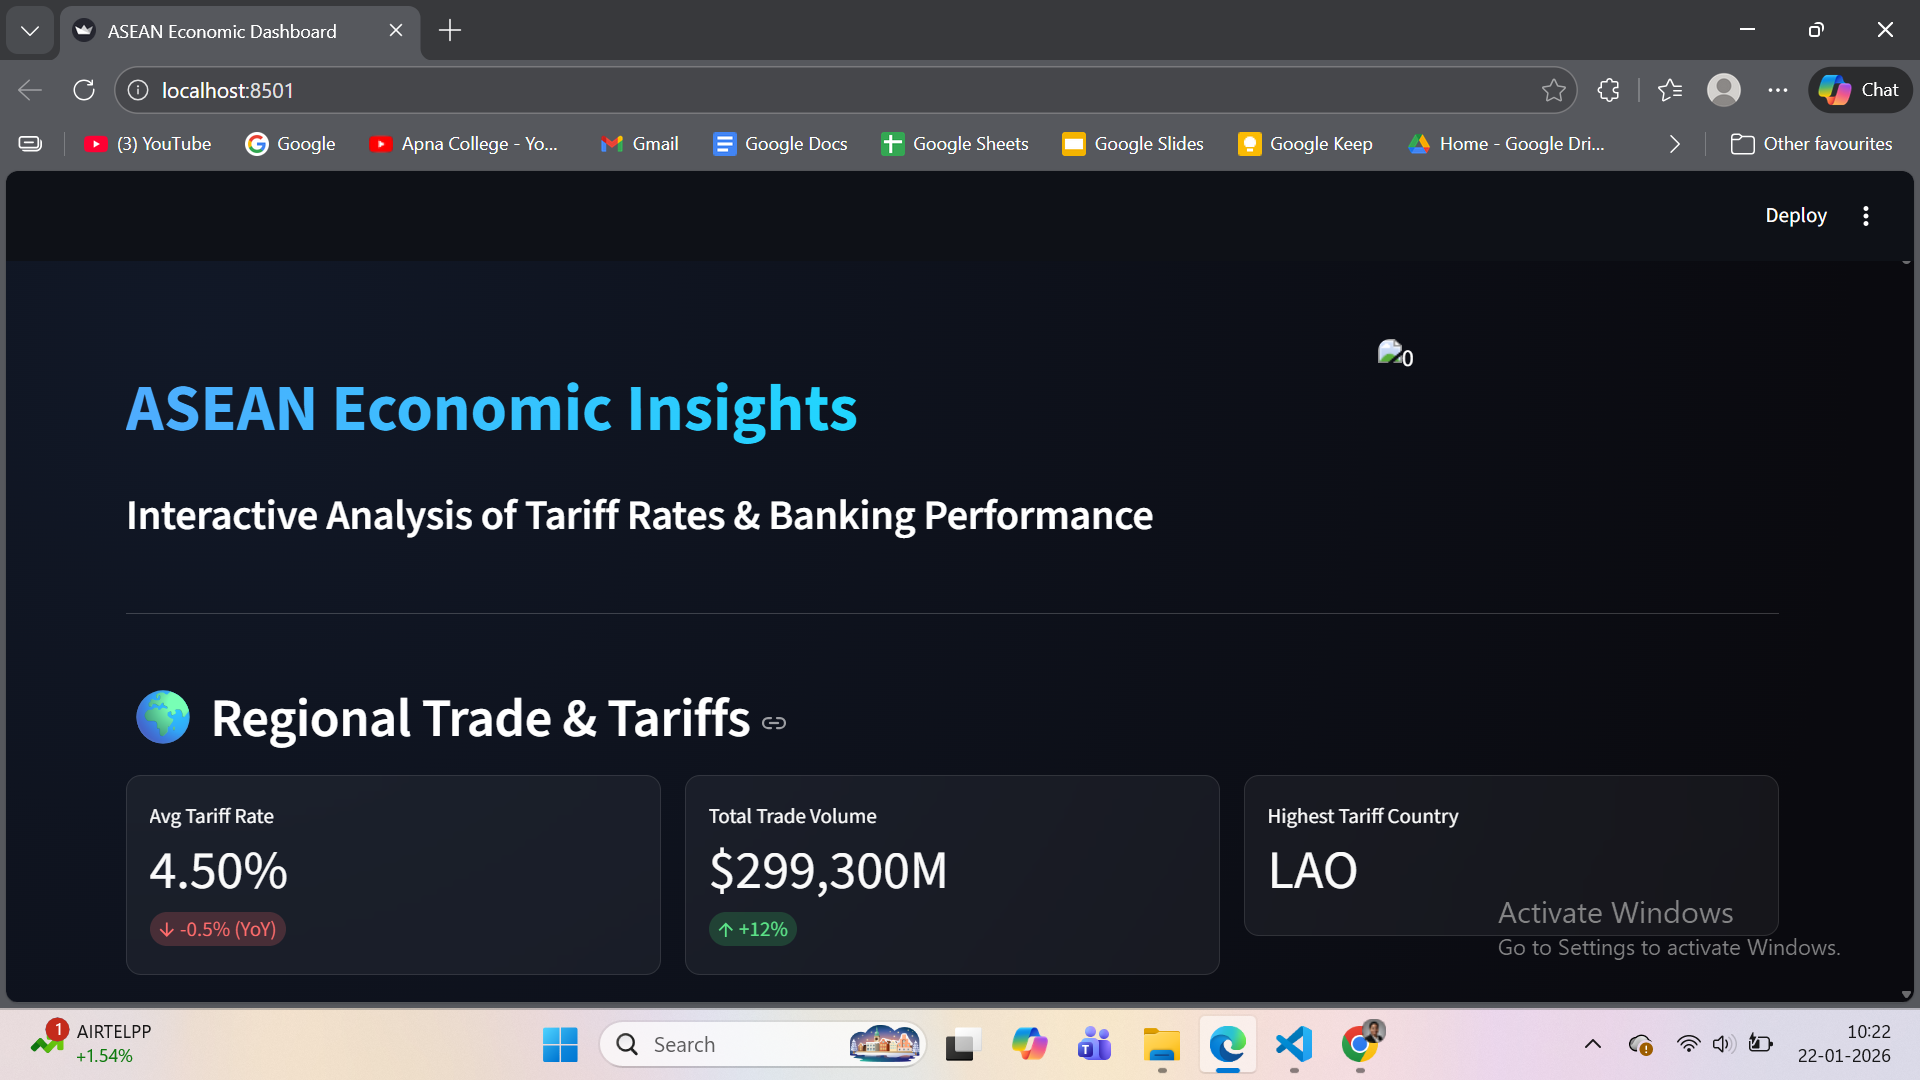
It is just a Dashboard of the previous raw data into an interactive graphical representation
How we built it
By using a Python library (matplotlib, seaborn) for analysis and creating a dataframe, for a dashboard(streamlit library)
Challenges we ran into
The most challenging was to implement the analysis data into a dashboard
Accomplishments that we're proud of
Accomplishments are that in the dashboard, I can interactively perform it
What we learned
We learn about how to analyze data and take out insights, predict the data
What's next for the tariff rate analysis of Southeast Asia Countries(ASEAN)
I need to implement this project with real-time analysis

Log in or sign up for Devpost to join the conversation.