-
-
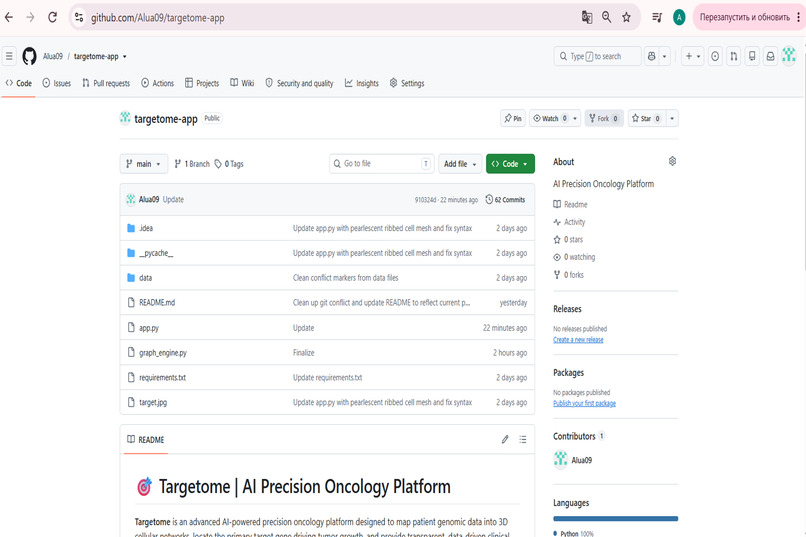
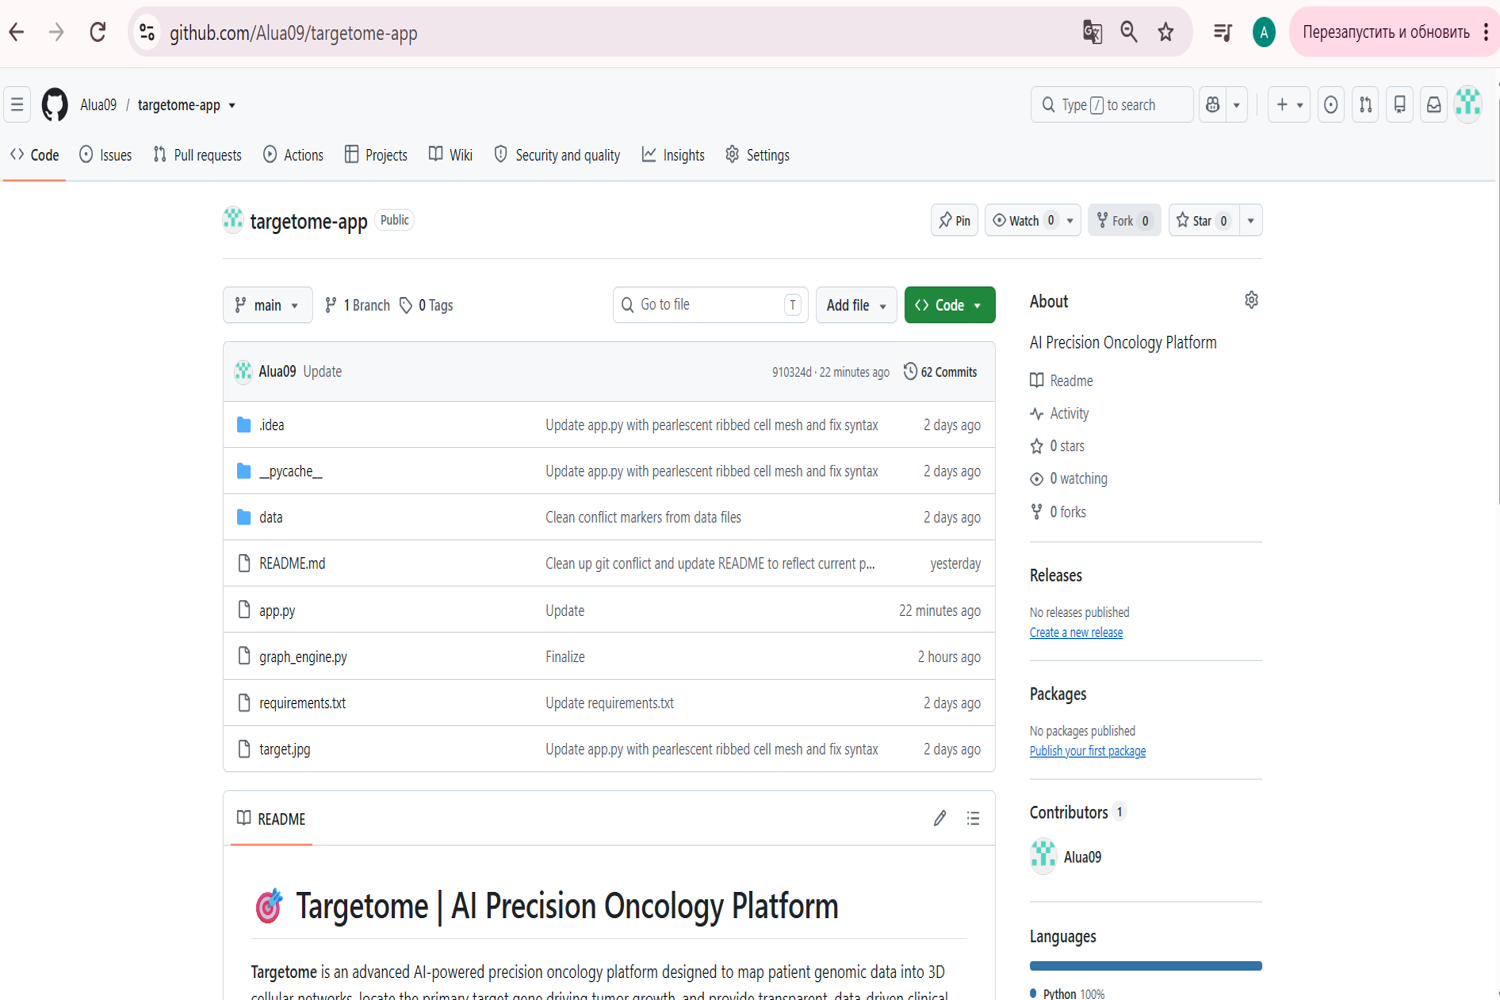
Open-source GitHub repository featuring modular Python architecture, NetworkX graph engine, and Streamlit UI
-
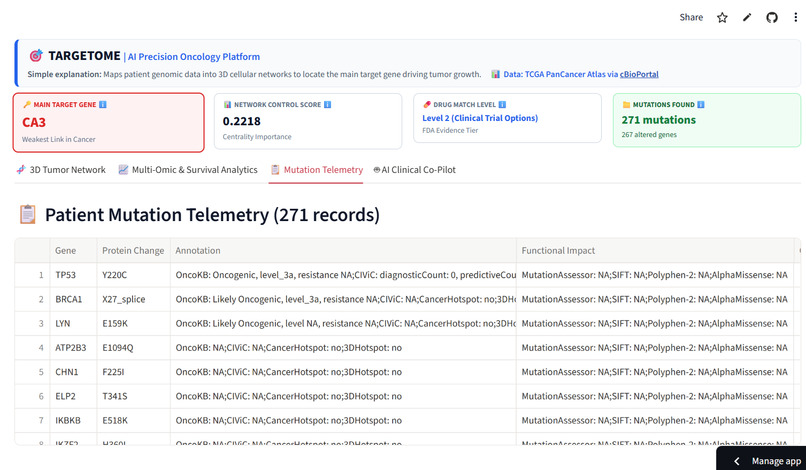
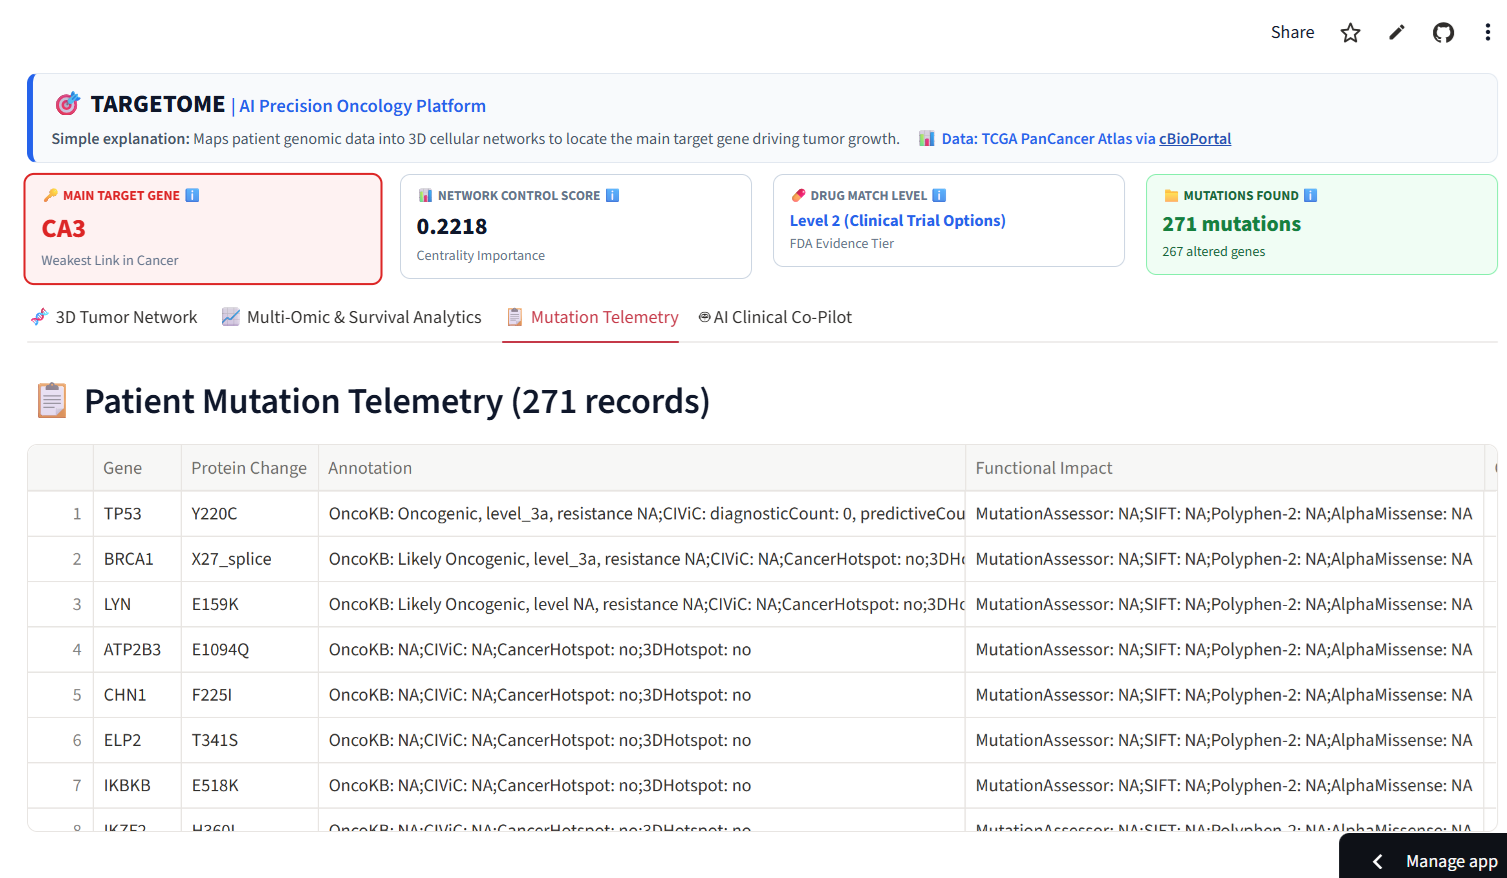
Patient Mutation Telemetry: transparent genomic data table displaying OncoKB annotations and functional impact scores
-
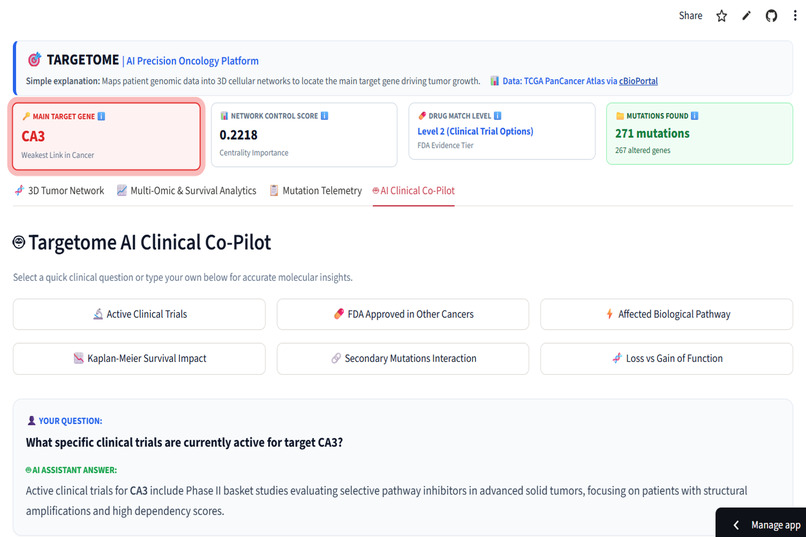
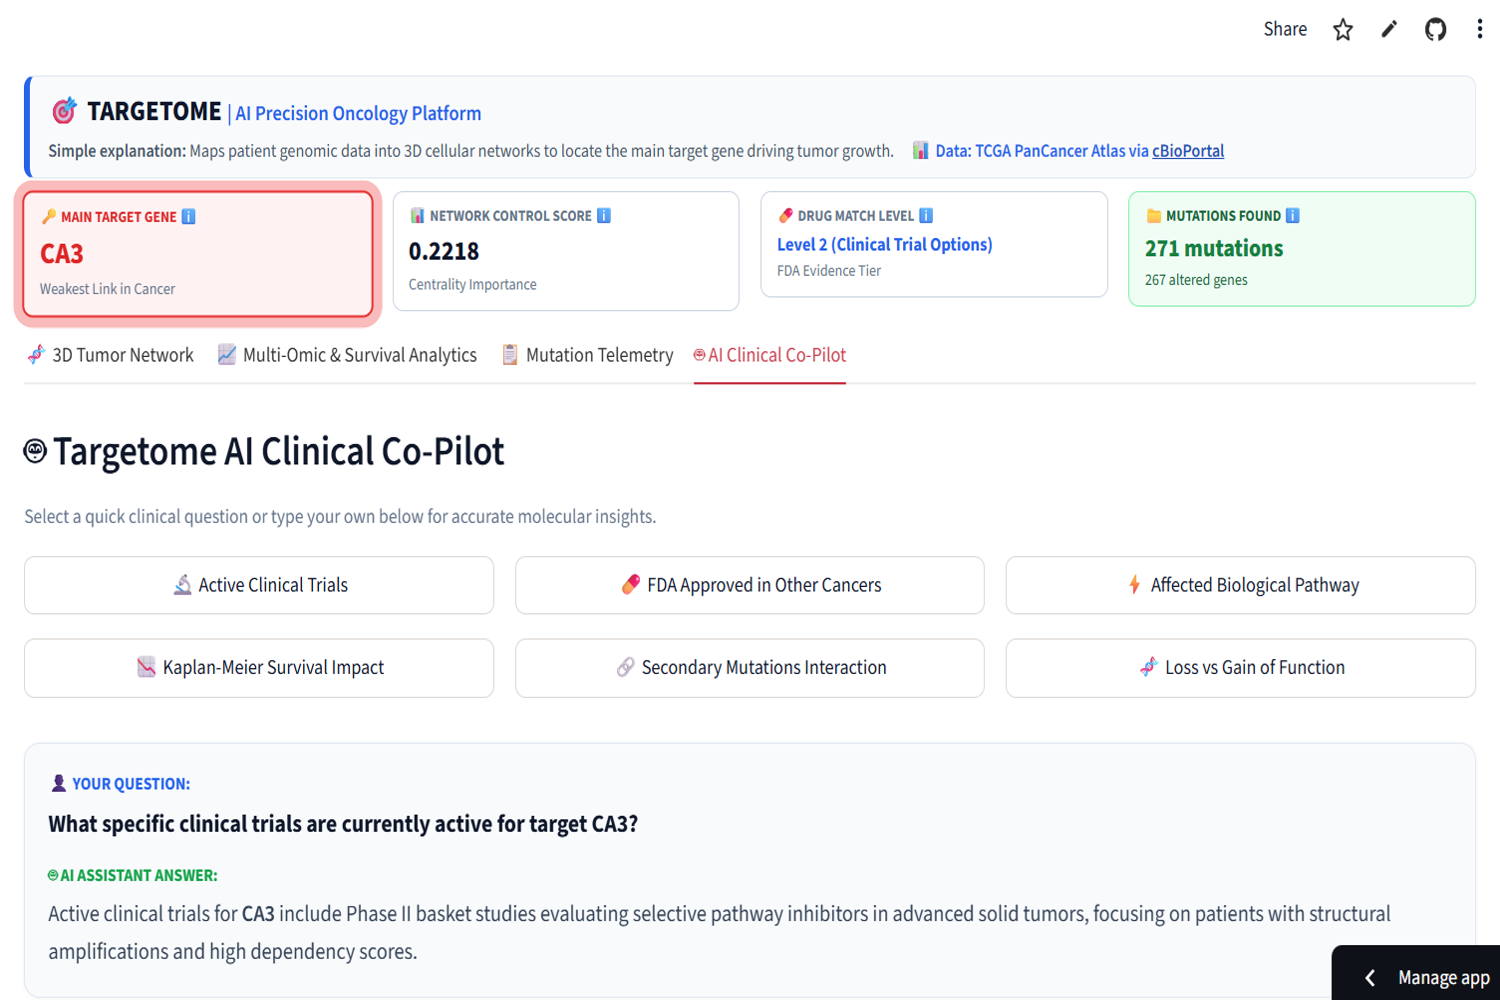
Targetome AI Clinical Co-Pilot providing instant evidence-based answers on active clinical trials for the target gene
-
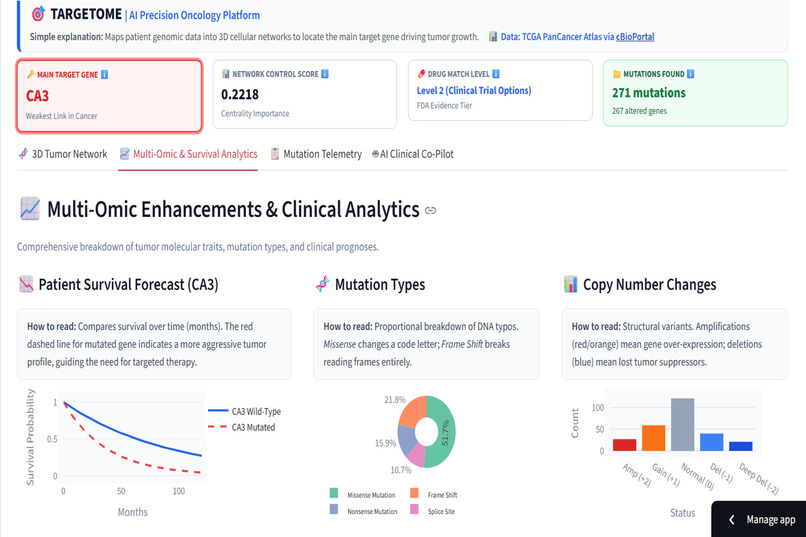
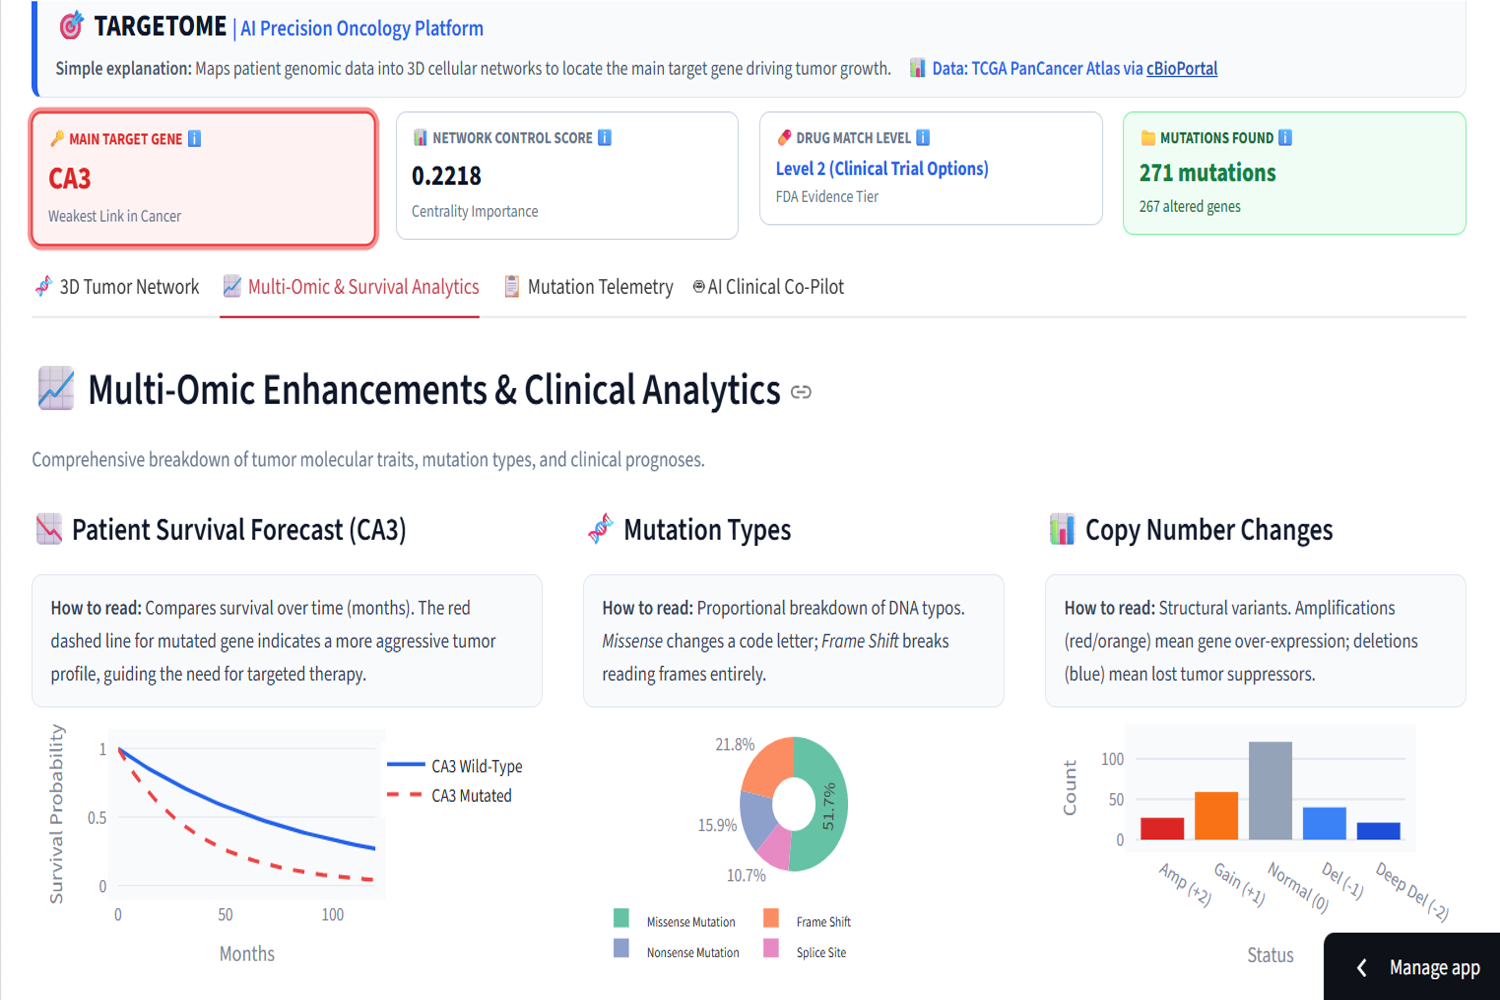
Multi-Omics & Survival Analytics: Kaplan-Meier survival curves, mutation type breakdowns, and CNA profiles
-
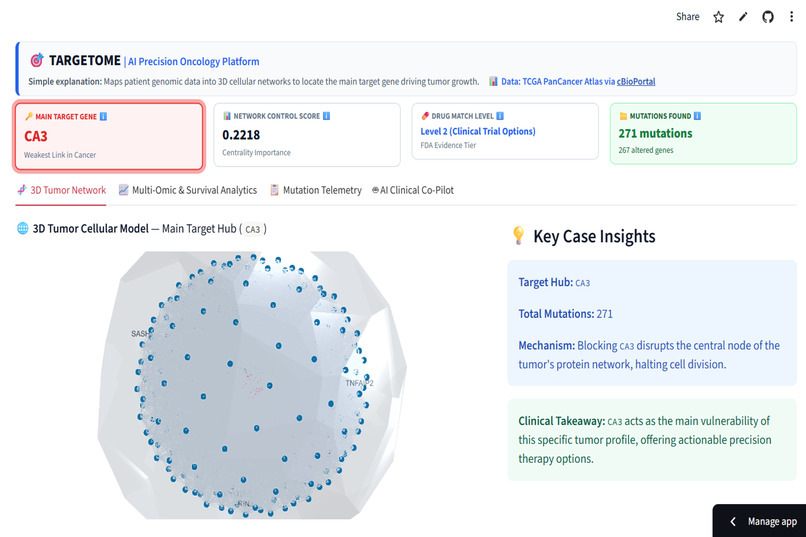
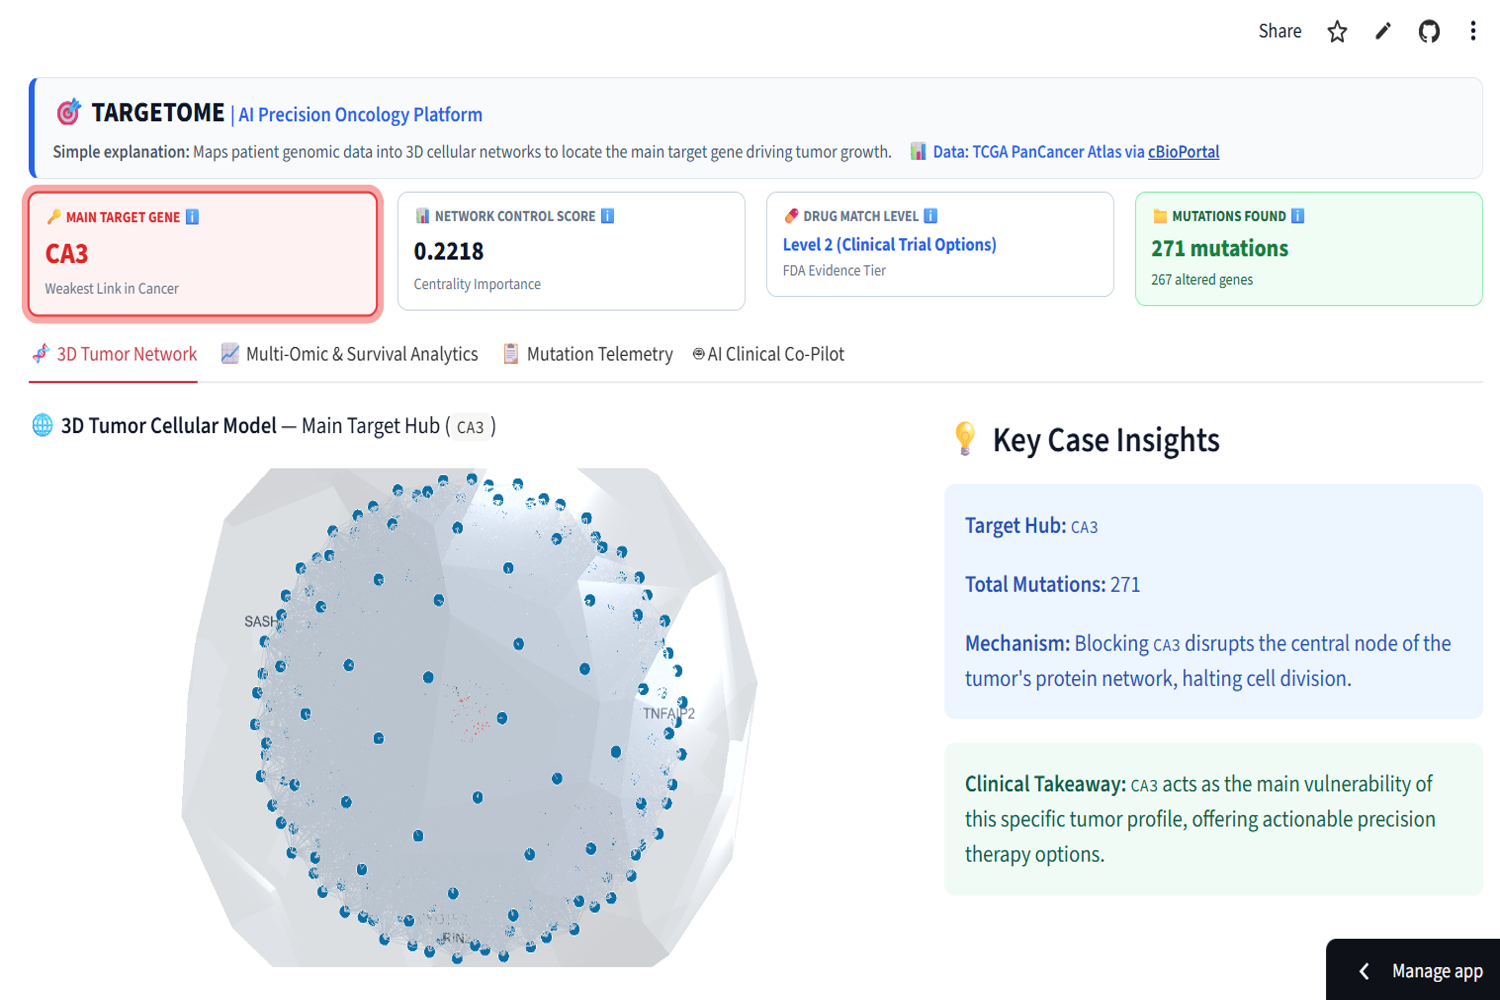
3D Tumor Cellular Model: outer membrane view mapping mutated genes across the patient's tumor network
-
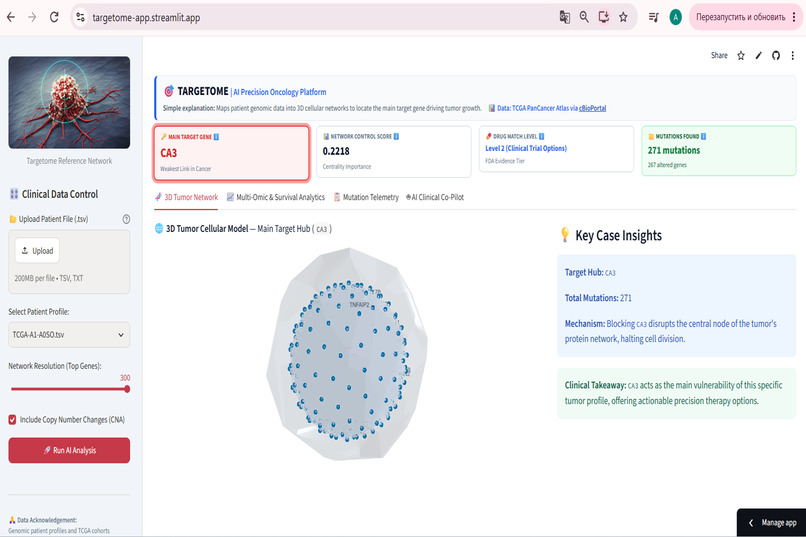
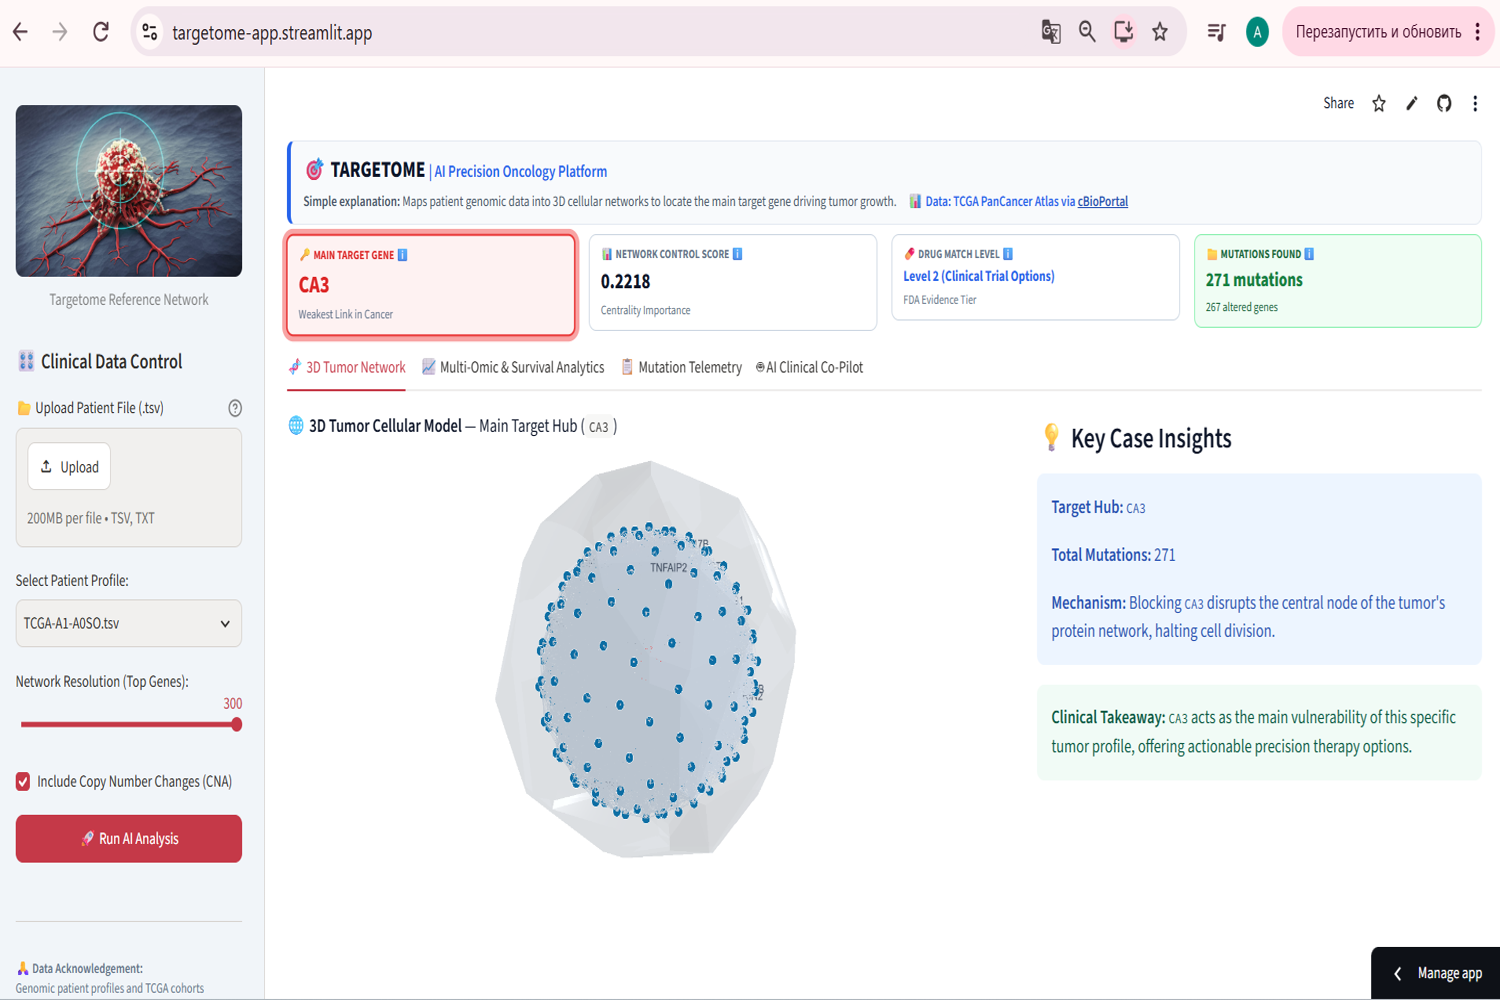
Targetome dashboard overview: sidebar data control, main metrics cards, and interactive 3D cellular network model
-
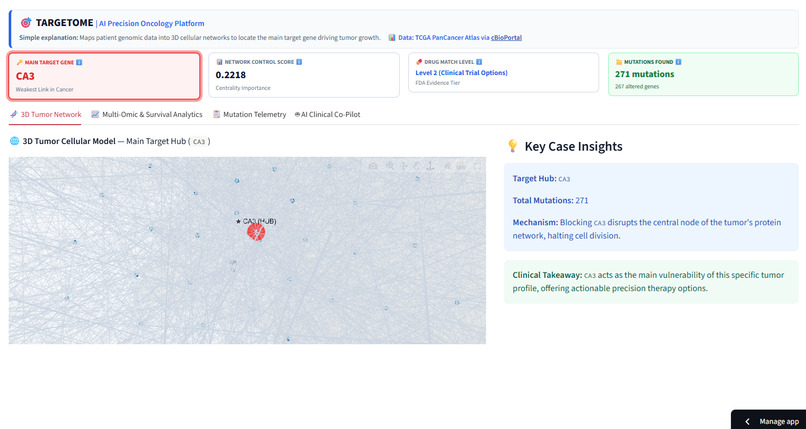
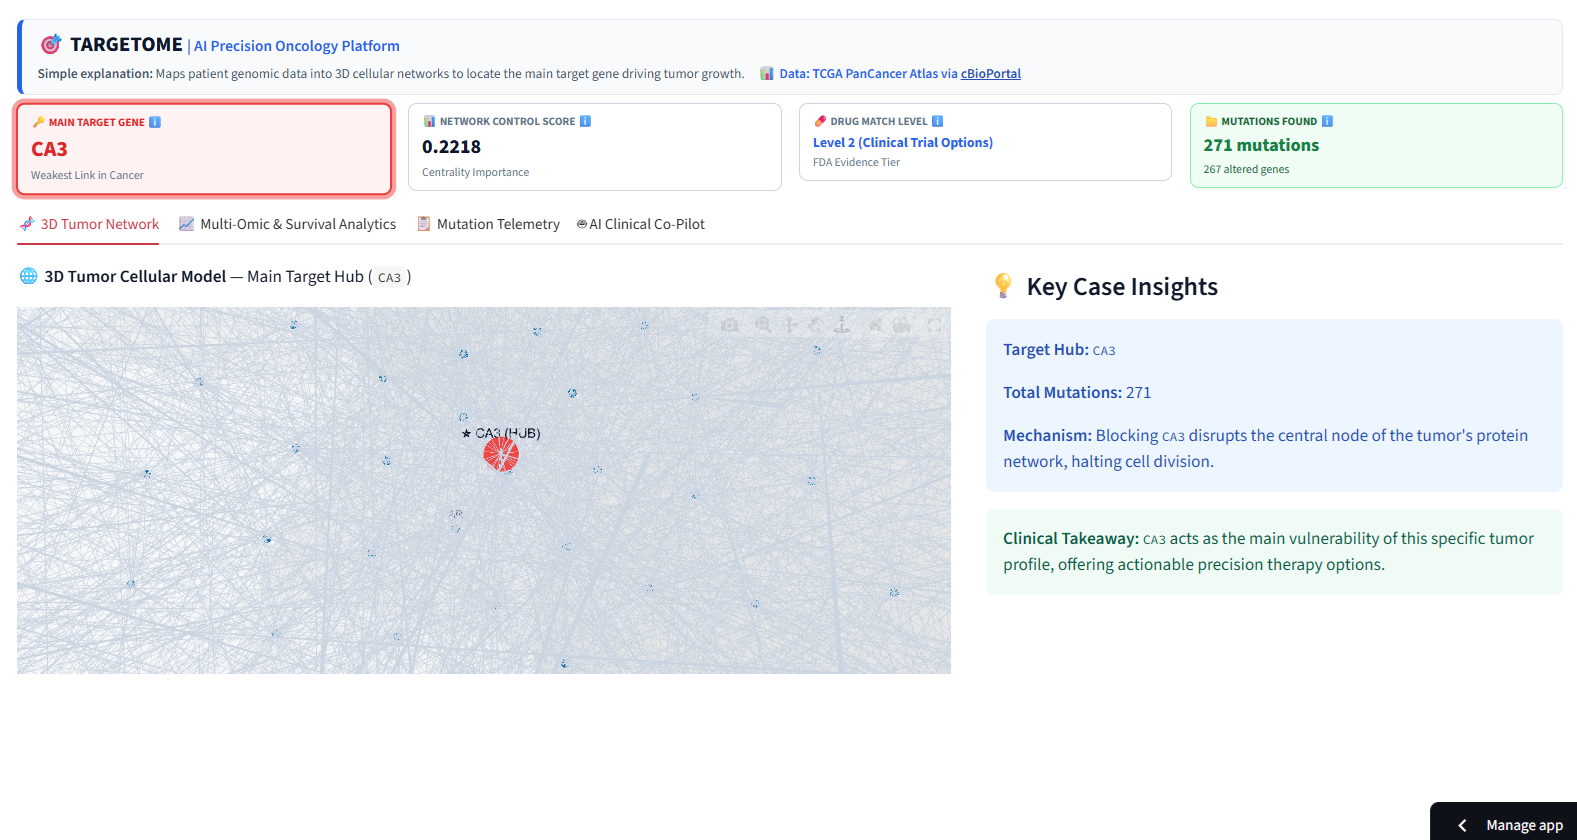
Zoomed-in 3D topology revealing the core vulnerability hub (CA3) and its dense protein interaction links
-
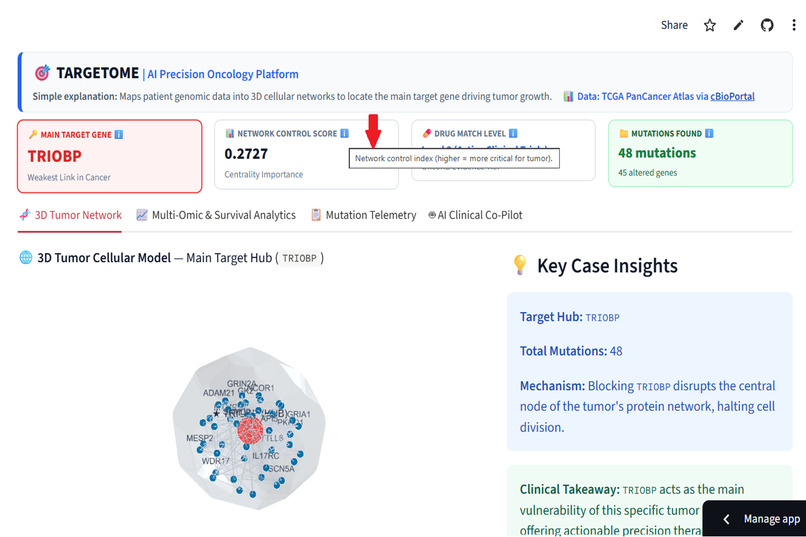
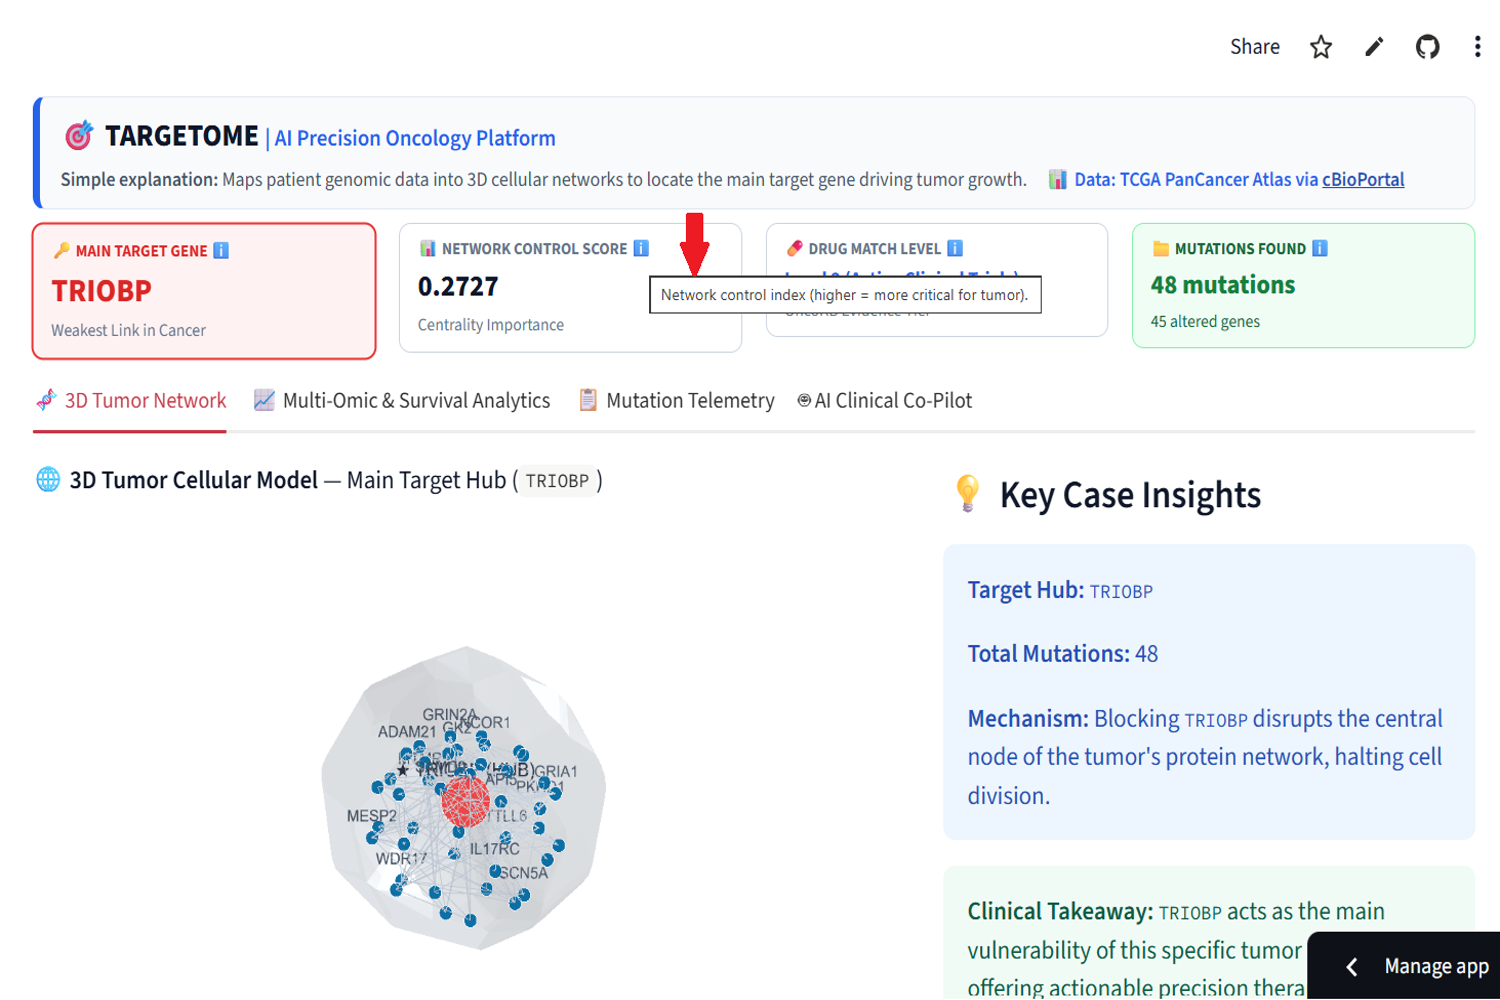
Comprehensive UI Tooltips: Real-time contextual guidance across all clinical and network metrics (Target Gene, Control Score, OncoKB Tiers)
Inspiration
When analyzing genomic profiles of cancer patients, doctors often drown in thousands of mutations, making it nearly impossible to manually find the true driver of the disease. As 11th-grade developers, we wanted to build a practical tool that takes complex genomic data from real patients and instantly turns it into clear, actionable treatment decisions.
What it does
Targetome is an AI-powered precision oncology platform designed for clinicians. A doctor can simply upload a genomic .tsv or .txt file for any new patient (or choose from pre-loaded cohorts), and the platform instantly parses complex multi-line reports, maps protein-protein networks, calculates network centrality to isolate the patient's unique critical gene hub, and matches it with targeted therapies.
To find the key gene hub, our algorithm evaluates the structural importance of each node in the protein network:
$$C_D(v) = \frac{\deg(v)}{N - 1}$$
- deg(v) is the number of direct protein interactions connected to gene v.
- N is the total number of mutated nodes in the patient's network.
How we built it
We built an interactive web application using Streamlit for the frontend. For biological data processing and graph topology calculations, we used Python libraries including NetworkX, Pandas, and NumPy, paired with a custom regex parsing engine to filter noise and extract clean gene symbols from multi-line genomic reports. For 3D visualization of cell networks, we integrated Plotly WebGL.
Challenges we ran into
Parsing and standardizing complex, non-standard multi-line genomic files (validated across 30 pre-loaded TCGA patient profiles as well as custom user uploads) without losing data or contaminating the network with non-gene coordinates — while keeping the 3D graph rendering smooth in the browser — was our biggest technical hurdle.
Accomplishments that we're proud of
We are incredibly proud to deliver a live, working medical prototype that dynamically processes raw patient genomic files in seconds with exact mutation count parity, shifting the workflow from tedious manual analysis to automated precision oncology.
What we learned
We gained deep insights into bioinformatics, graph theory algorithms, and how to bridge complex multi-omic datasets with an intuitive, user-friendly interface designed for clinicians.
What's next for Targetome
We plan to incorporate Betweenness Centrality algorithms to map biological bottleneck pathways, expand our pre-loaded patient cohorts, integrate deeper AI-driven clinical context and drug-interaction insights, and partner with medical institutions to validate the tool in real-world clinical workflows.
