-
-
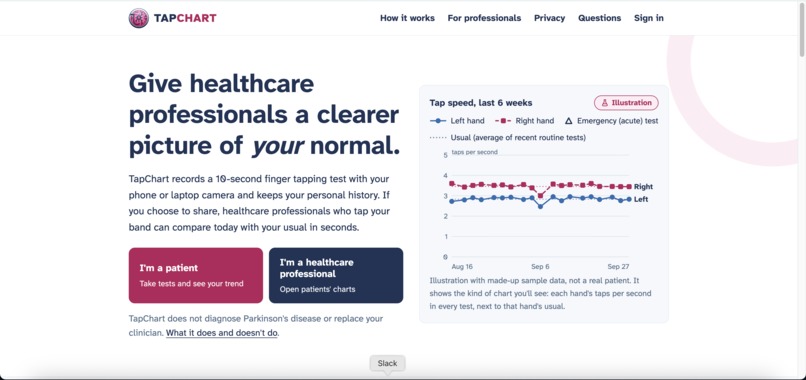
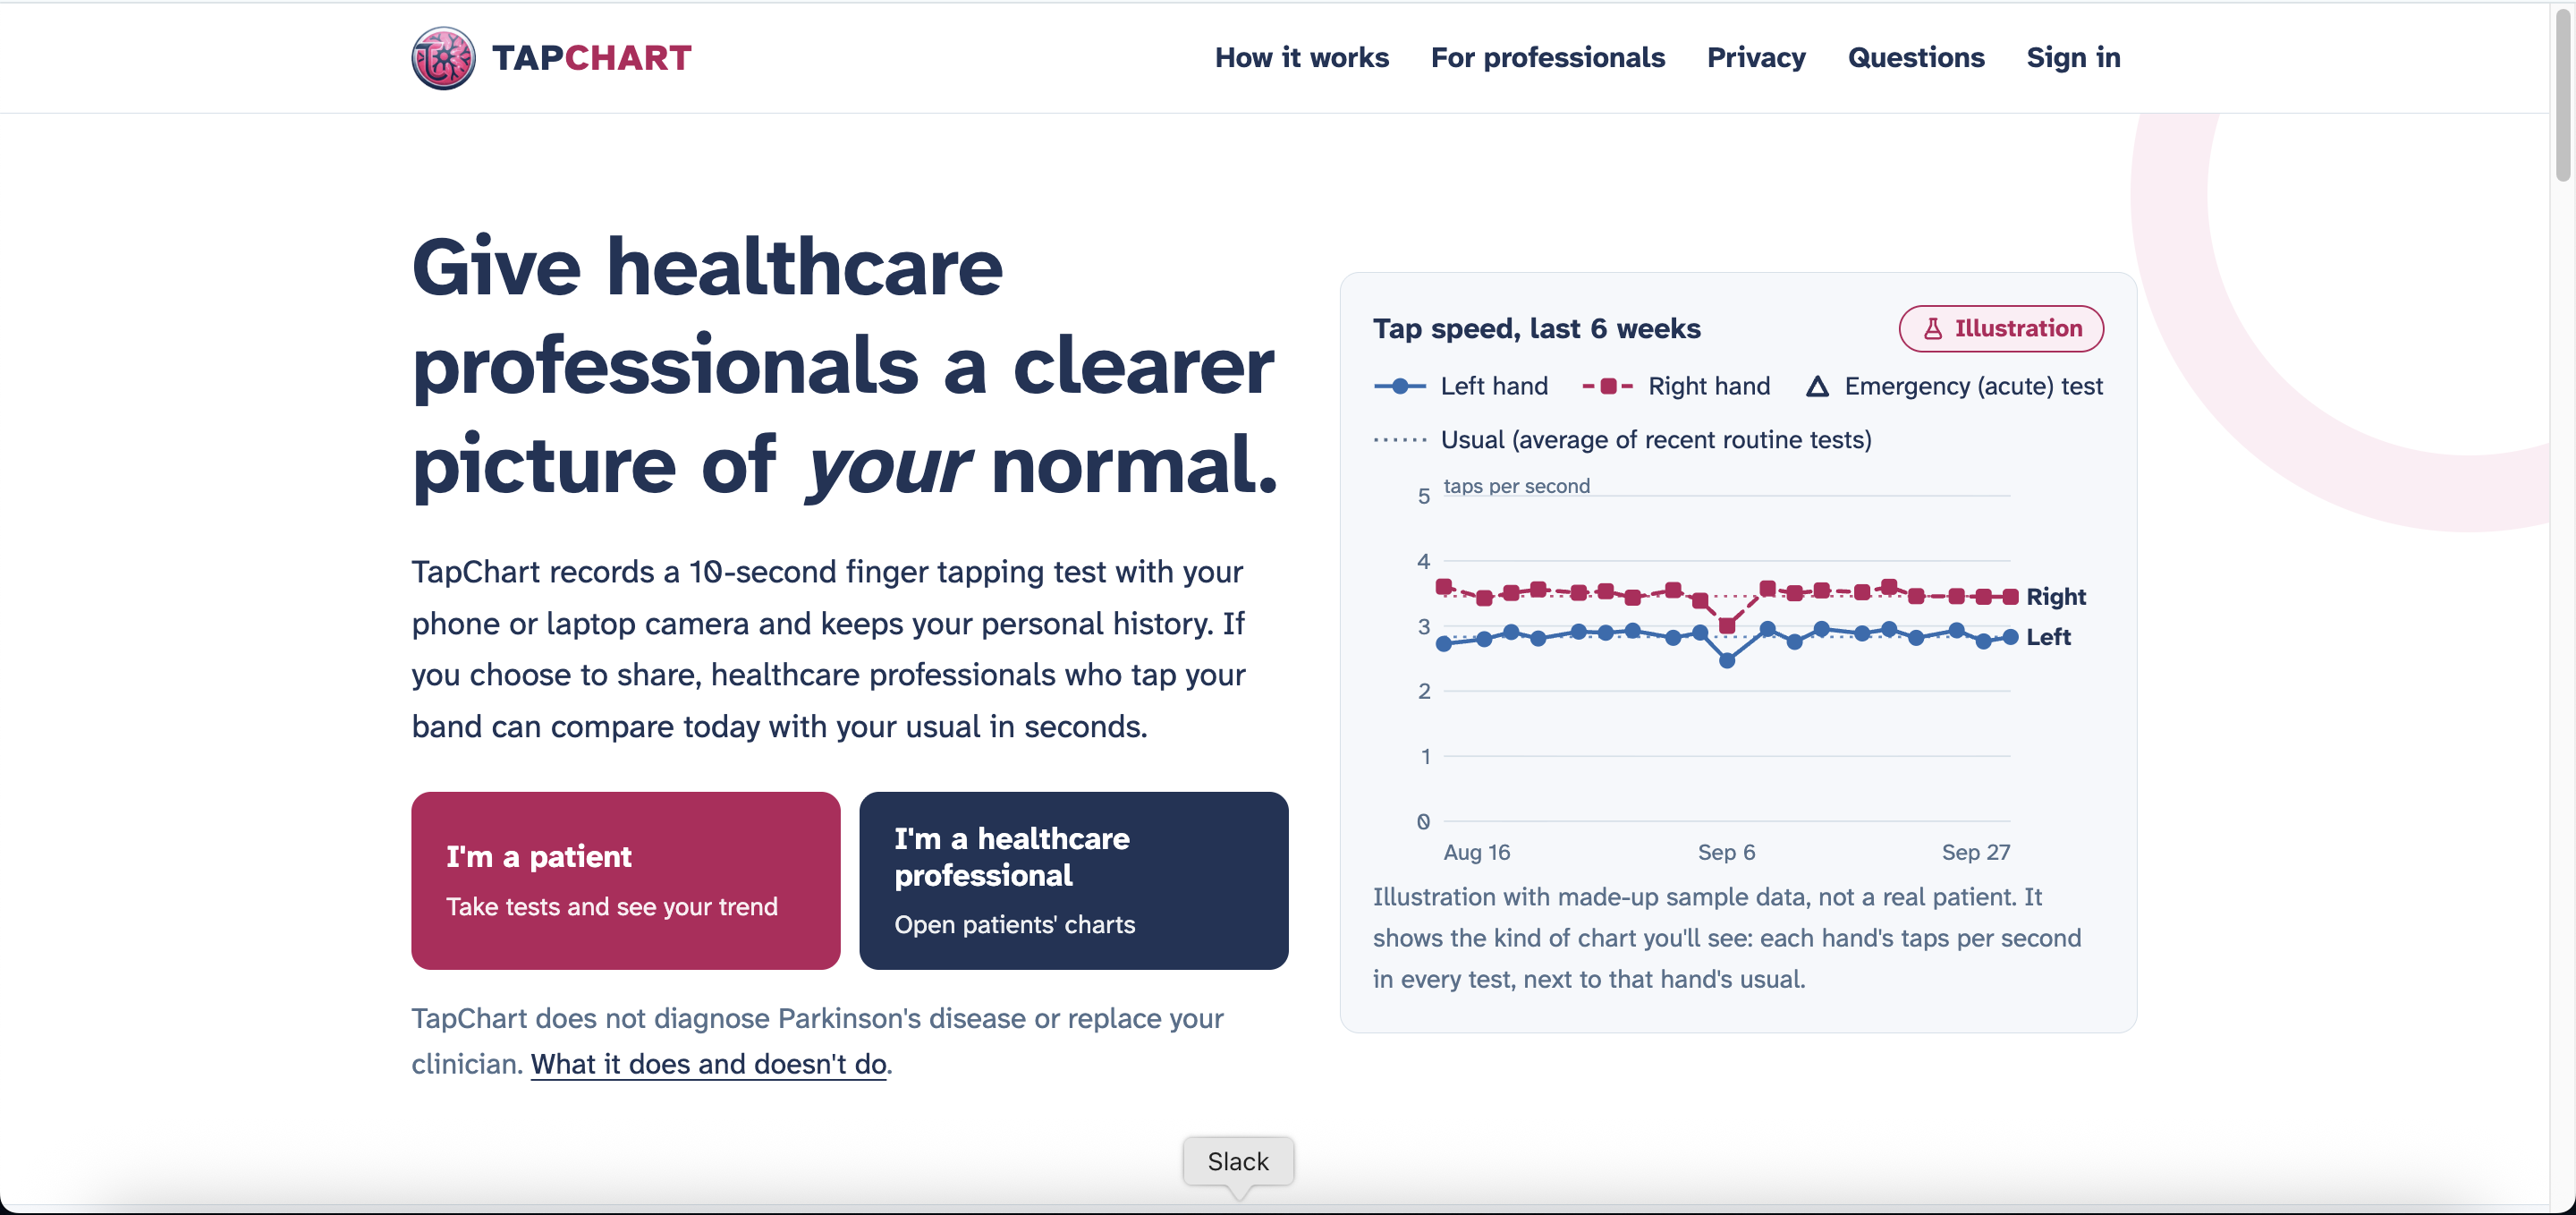
Home Page
-
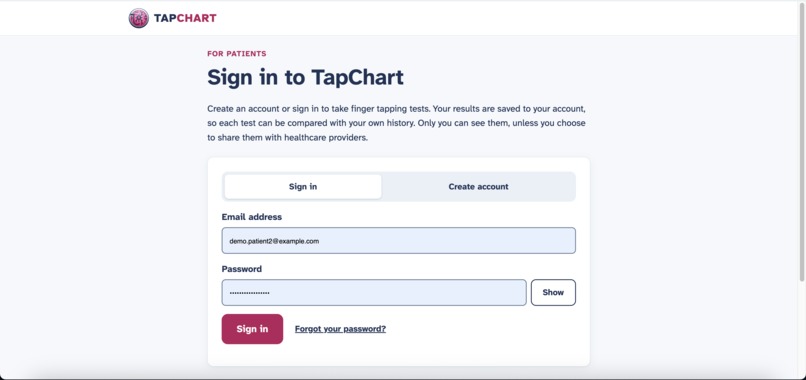
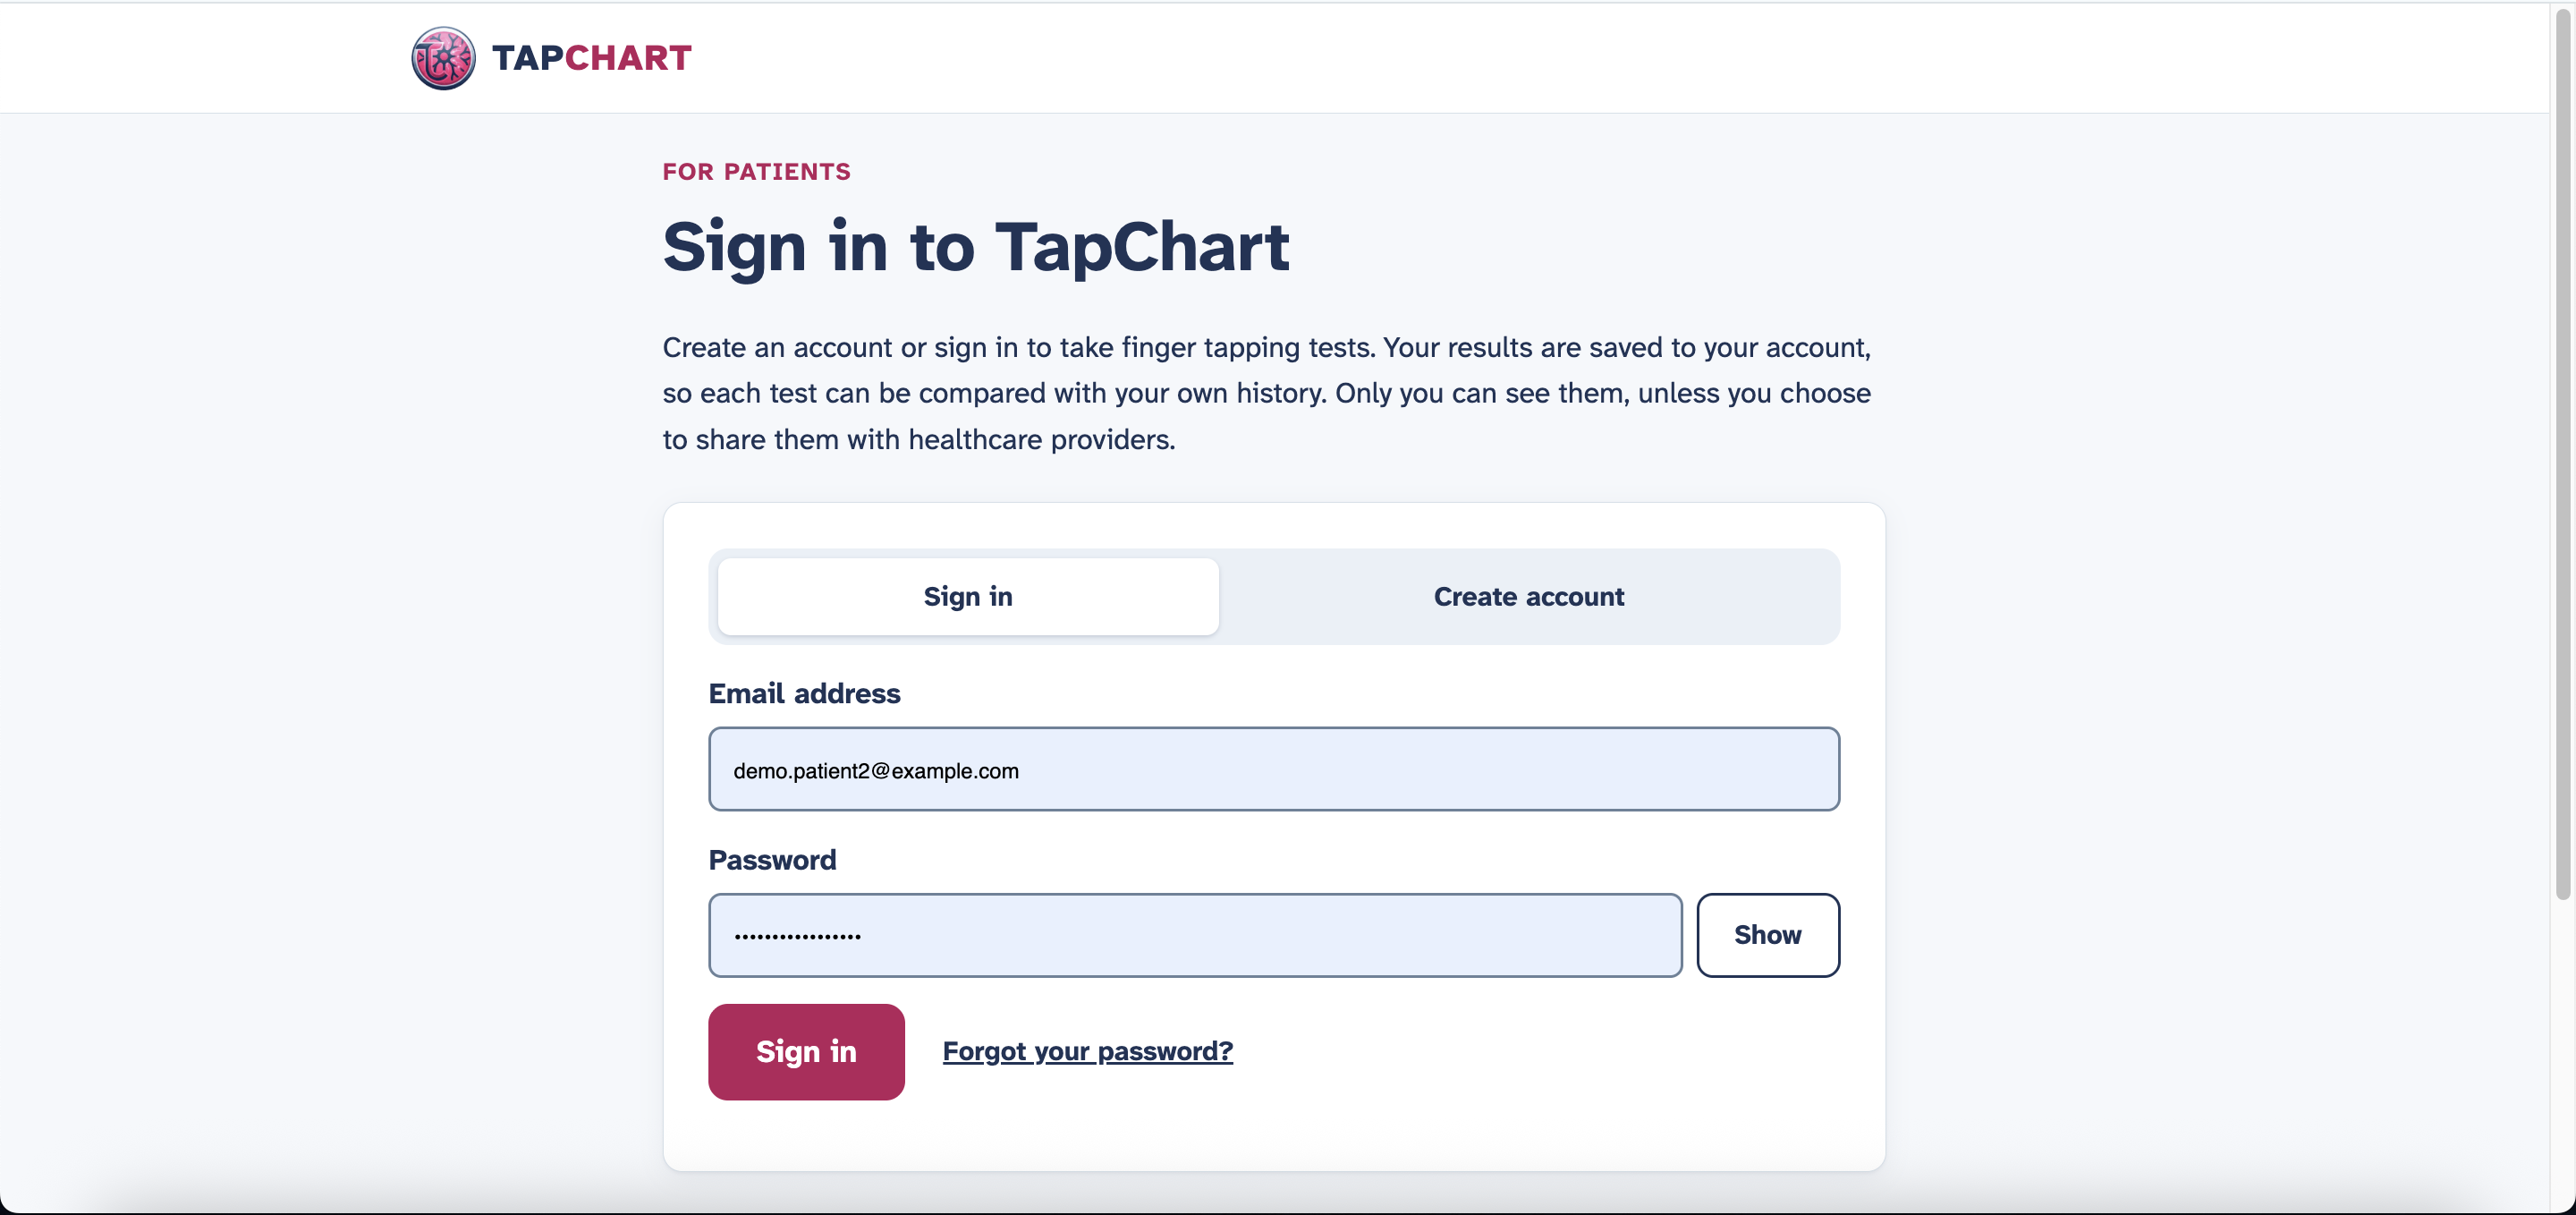
Sign In Patient
-
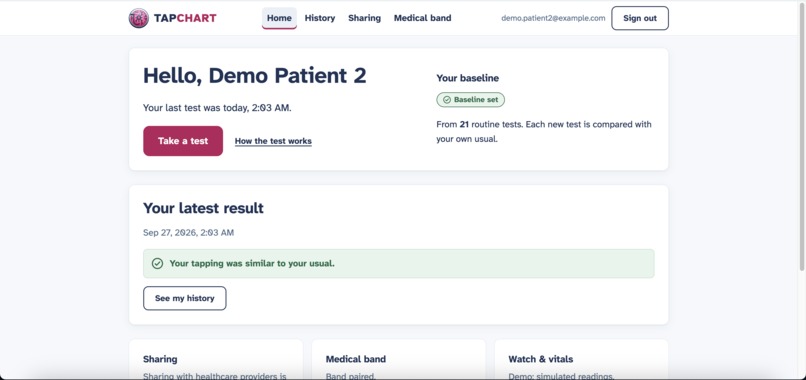
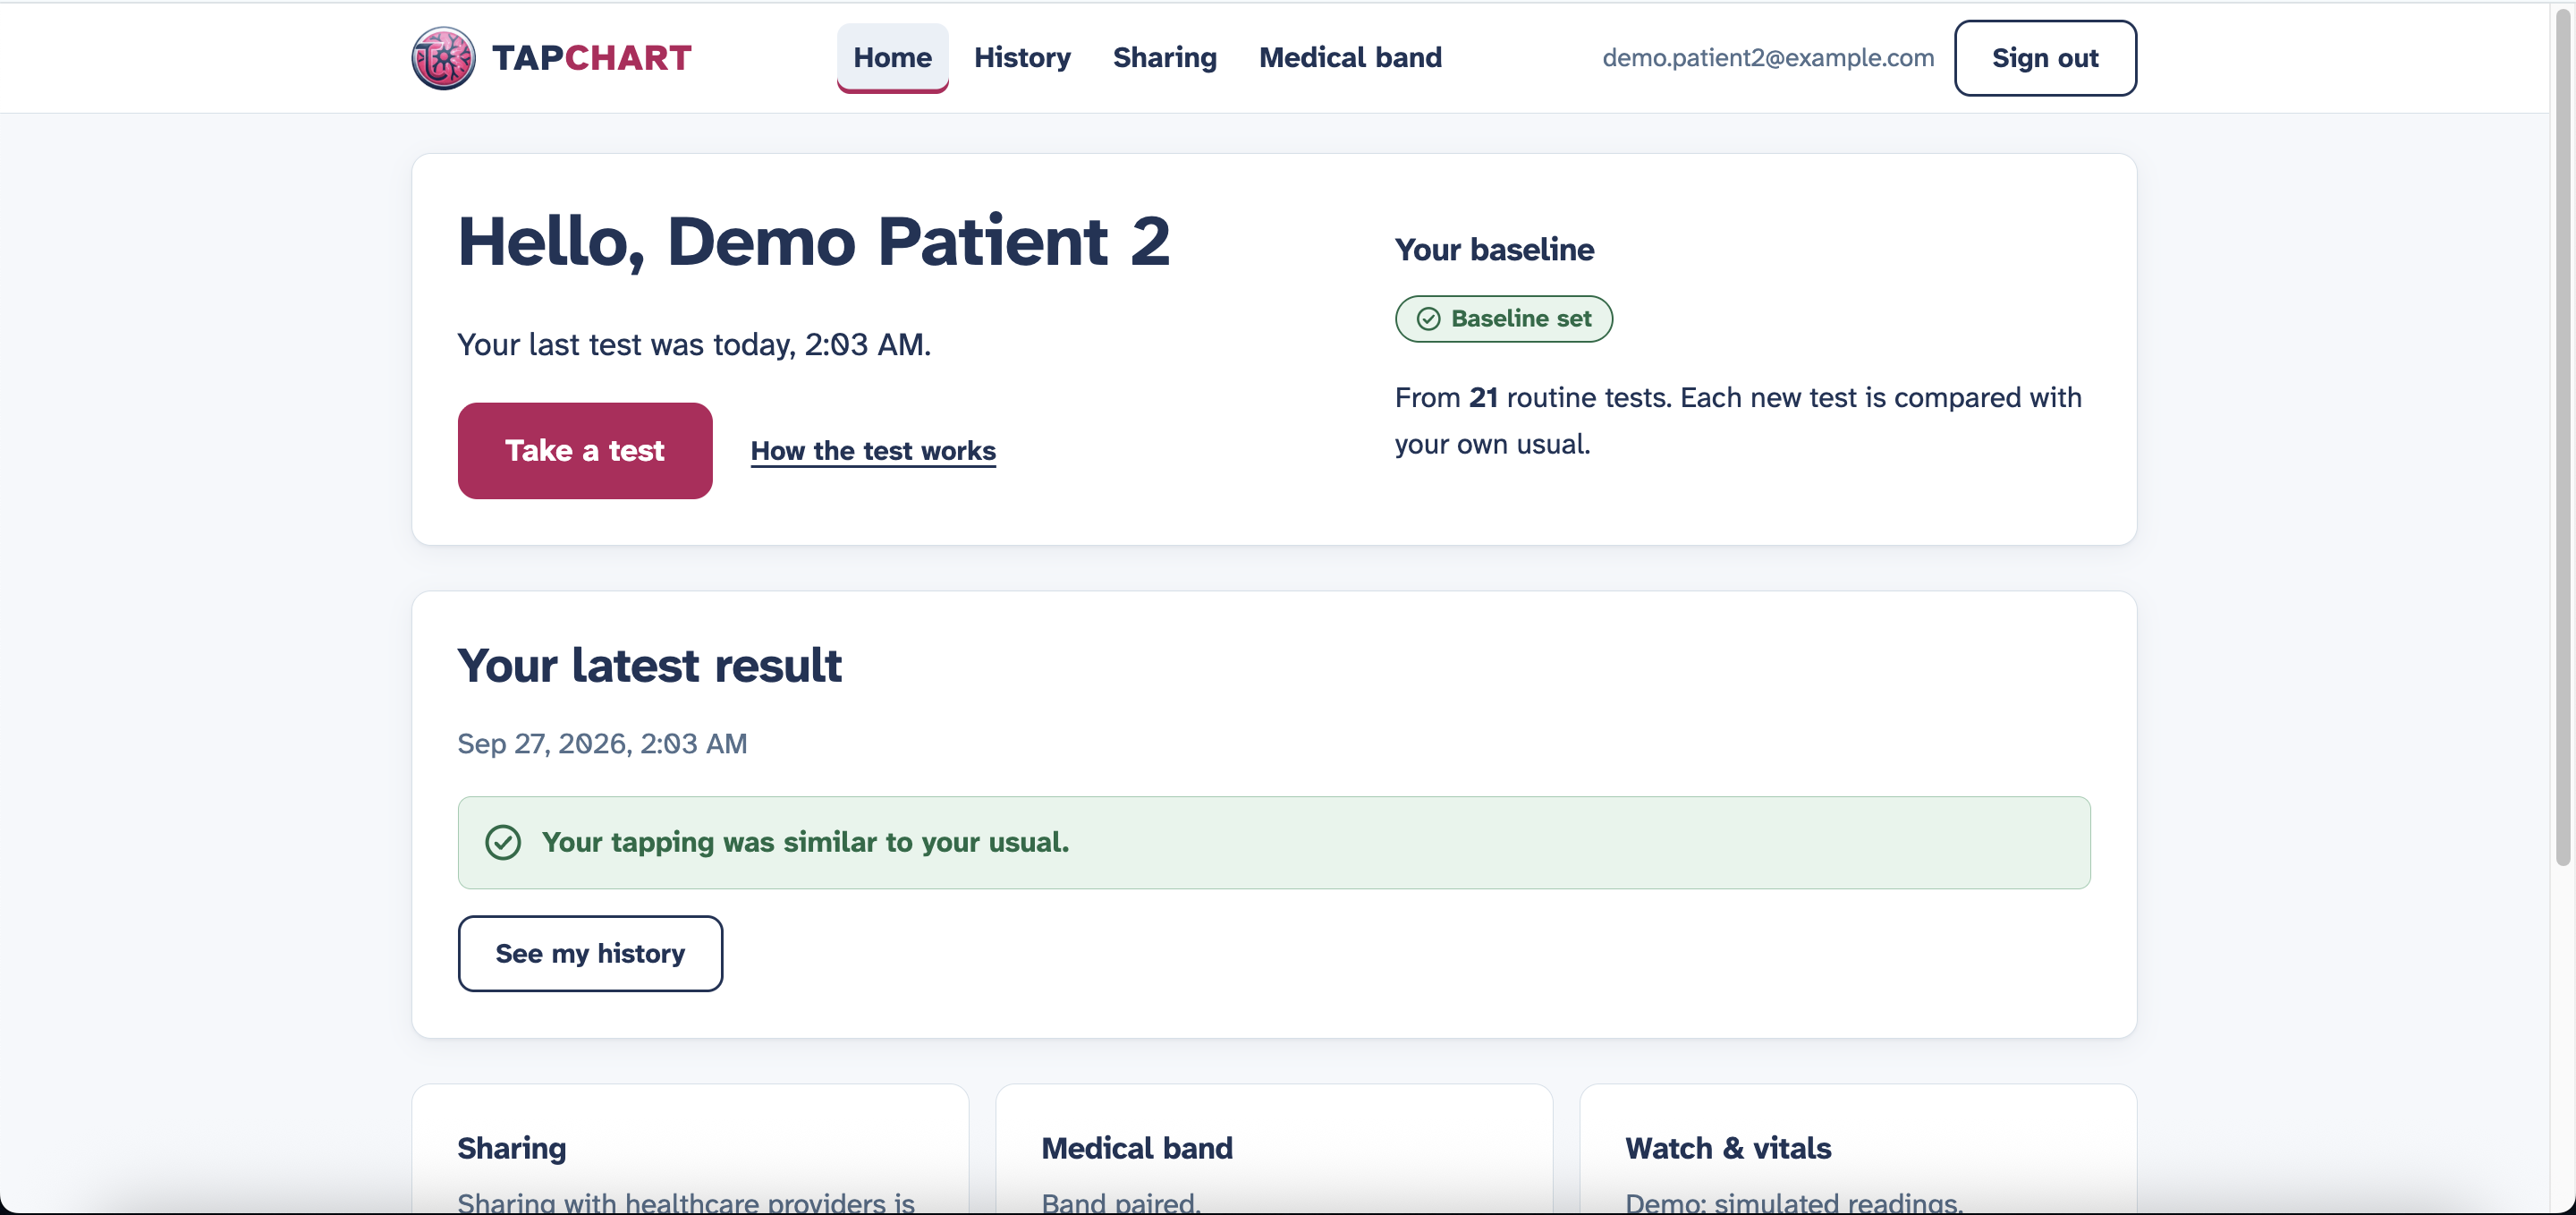
Patient Portal
-
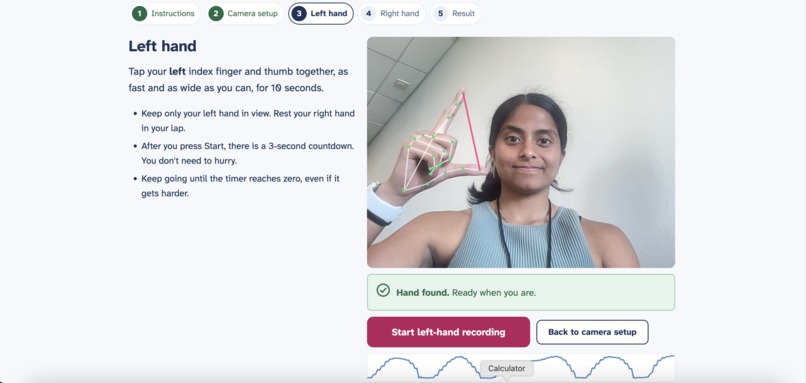
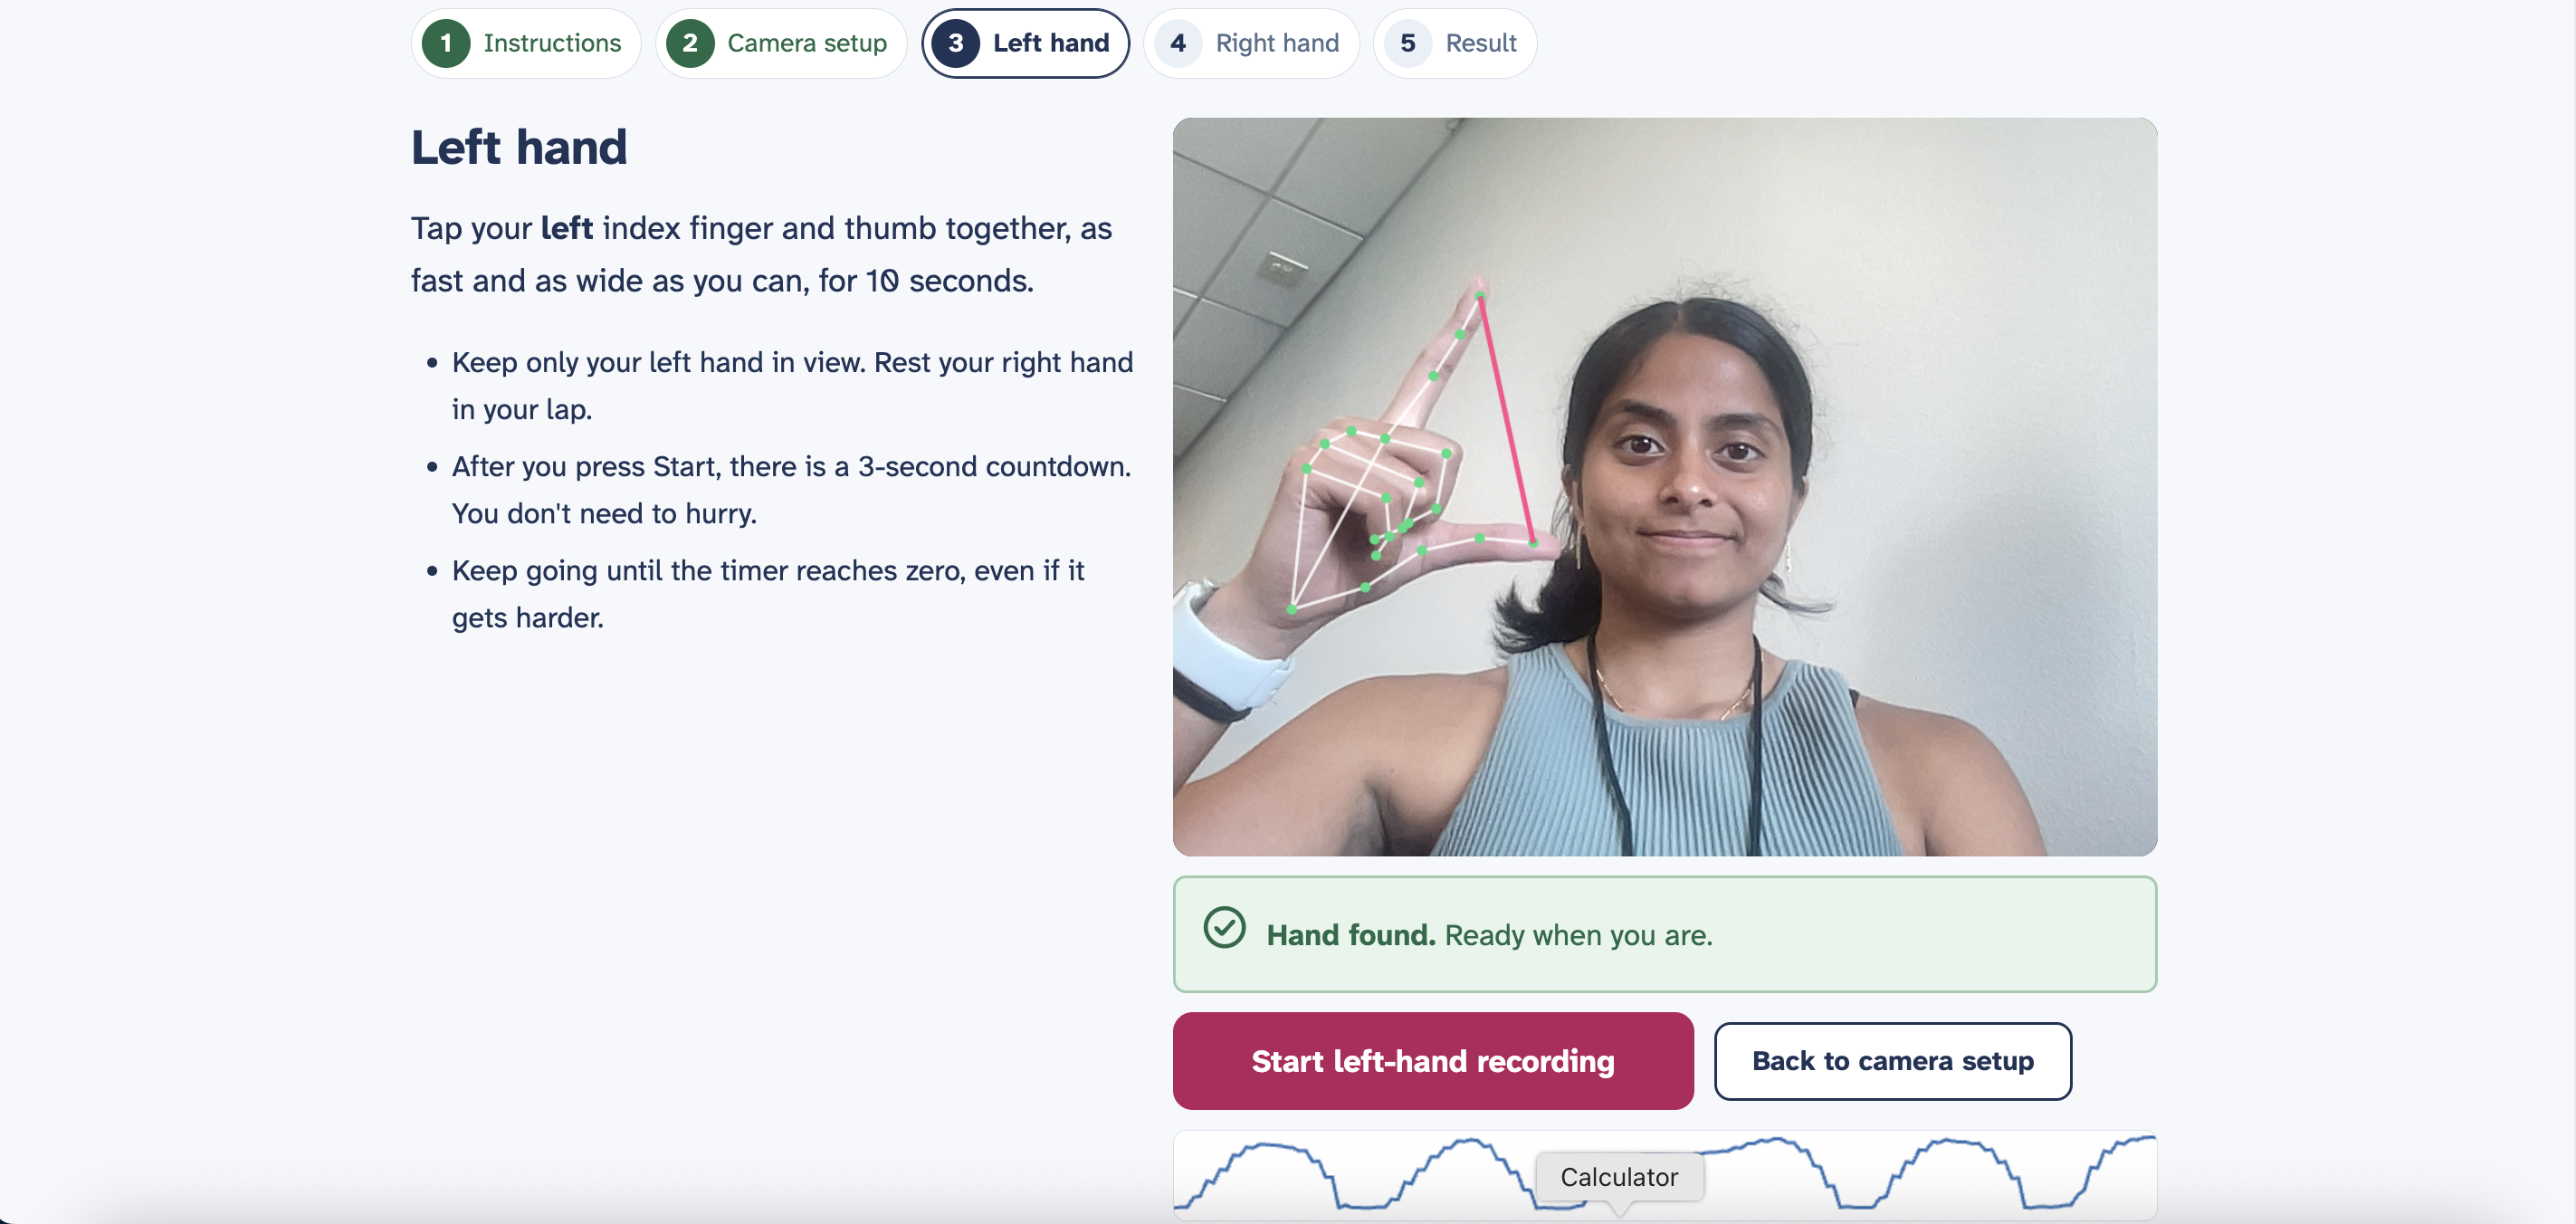
MediaPipes Vision Tracking for Tapping Test
-
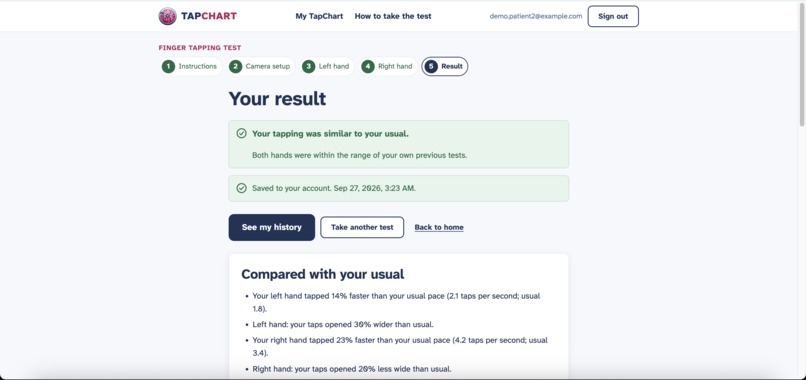
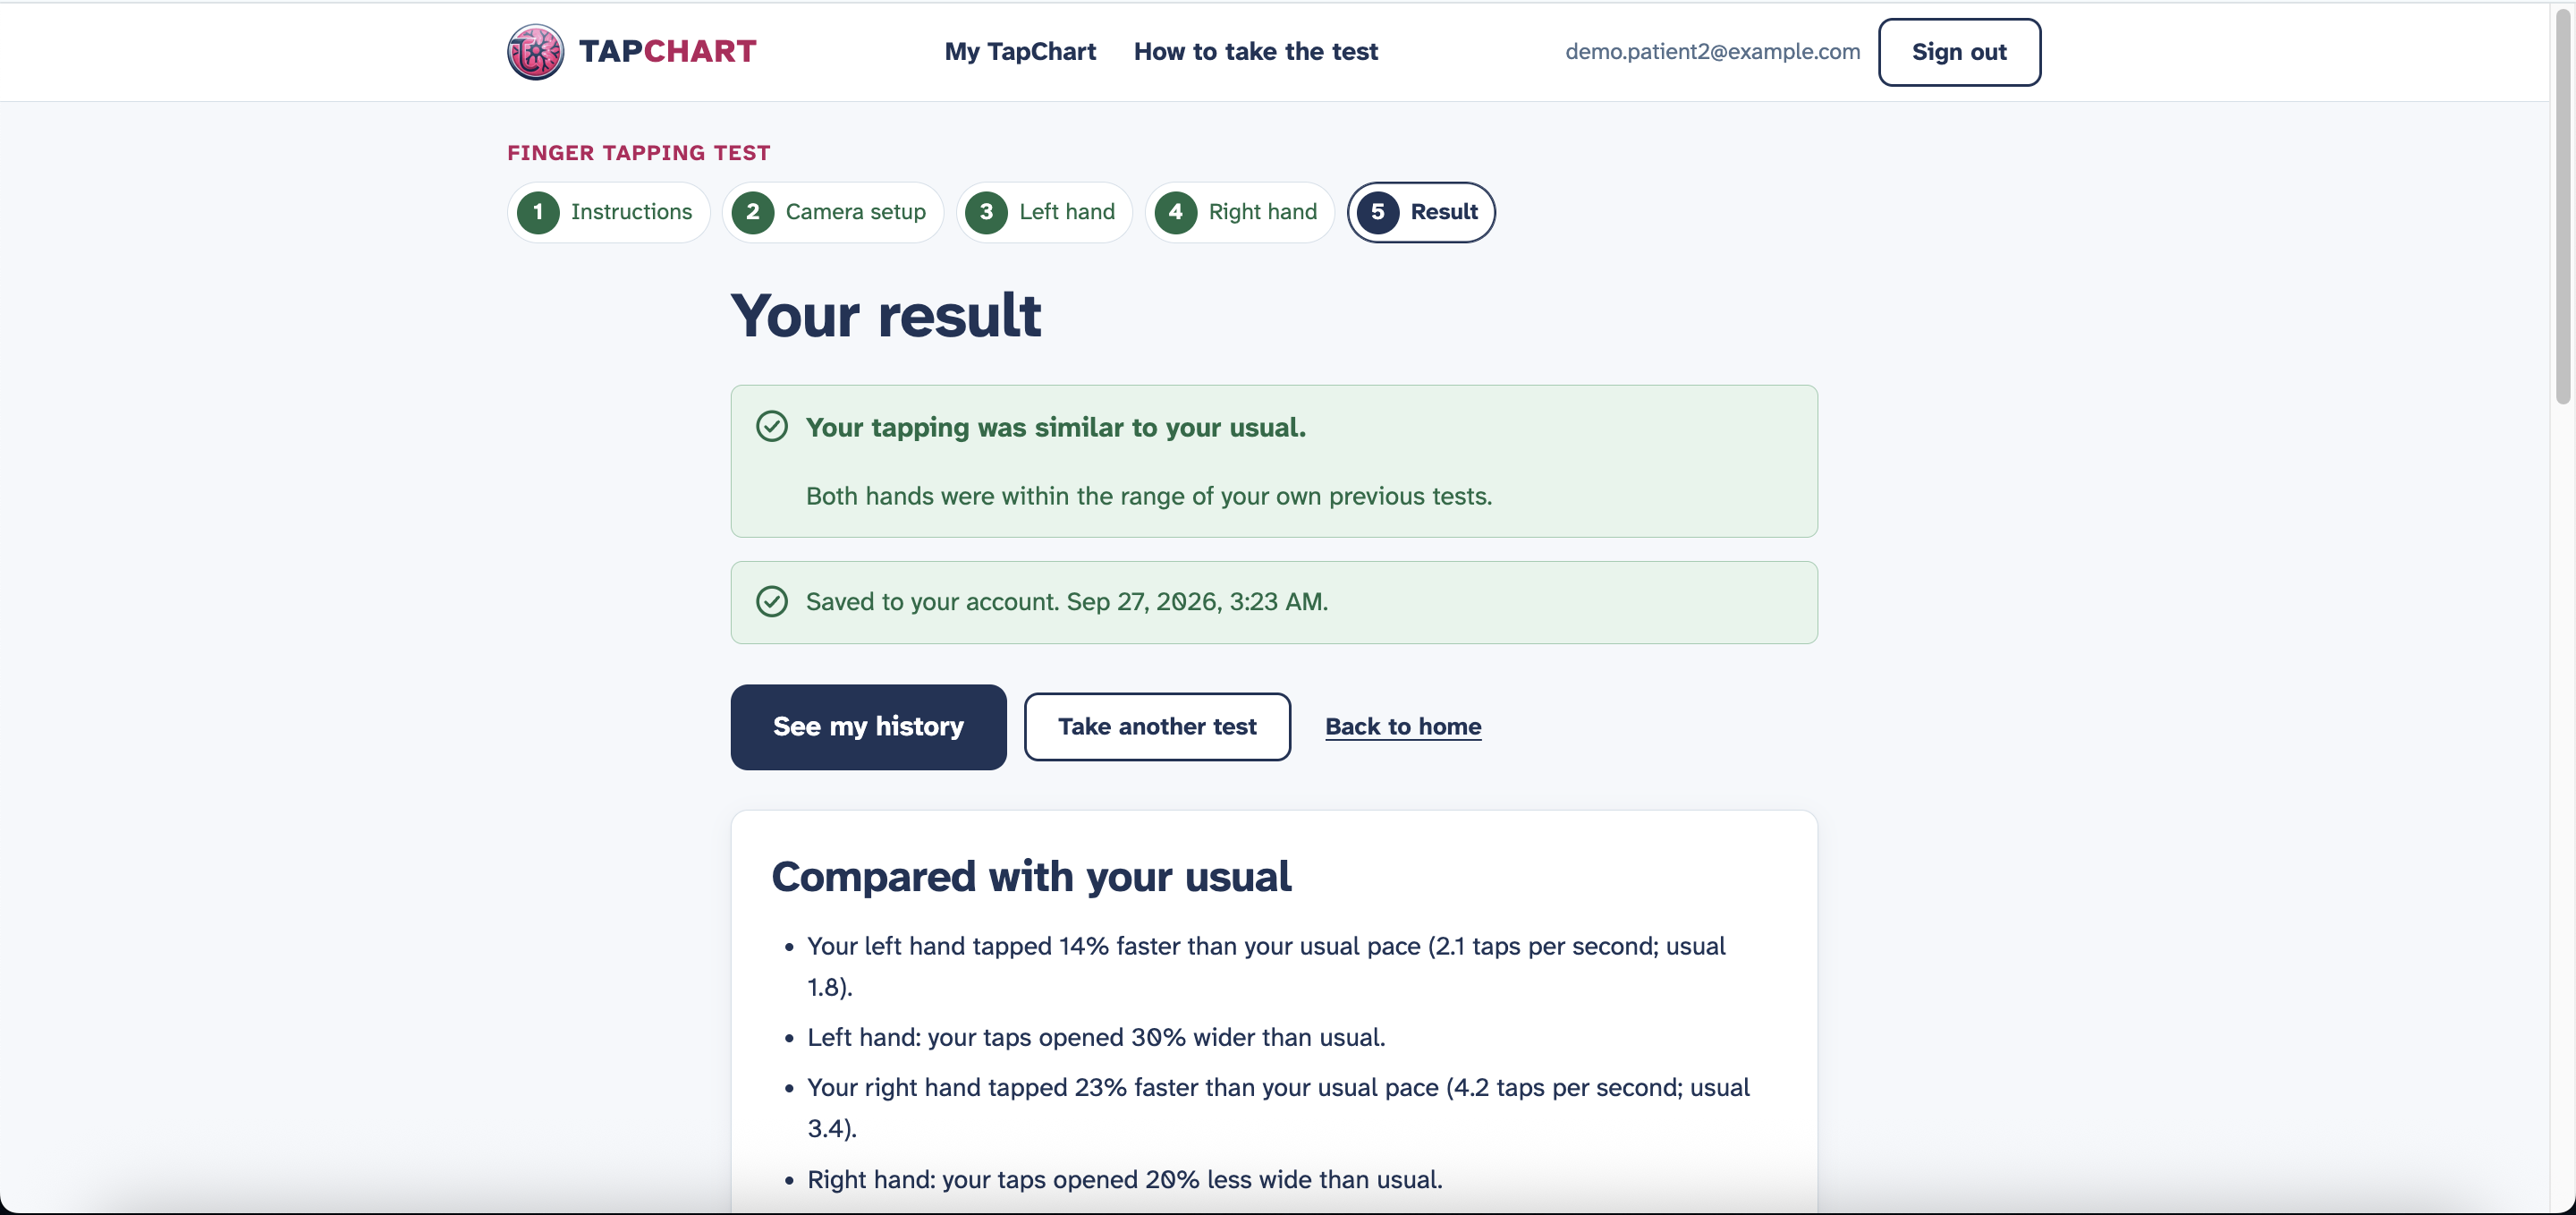
Results and Analysis
-
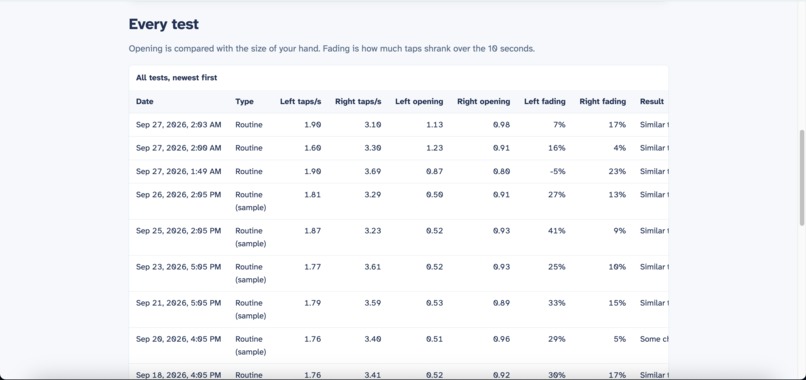
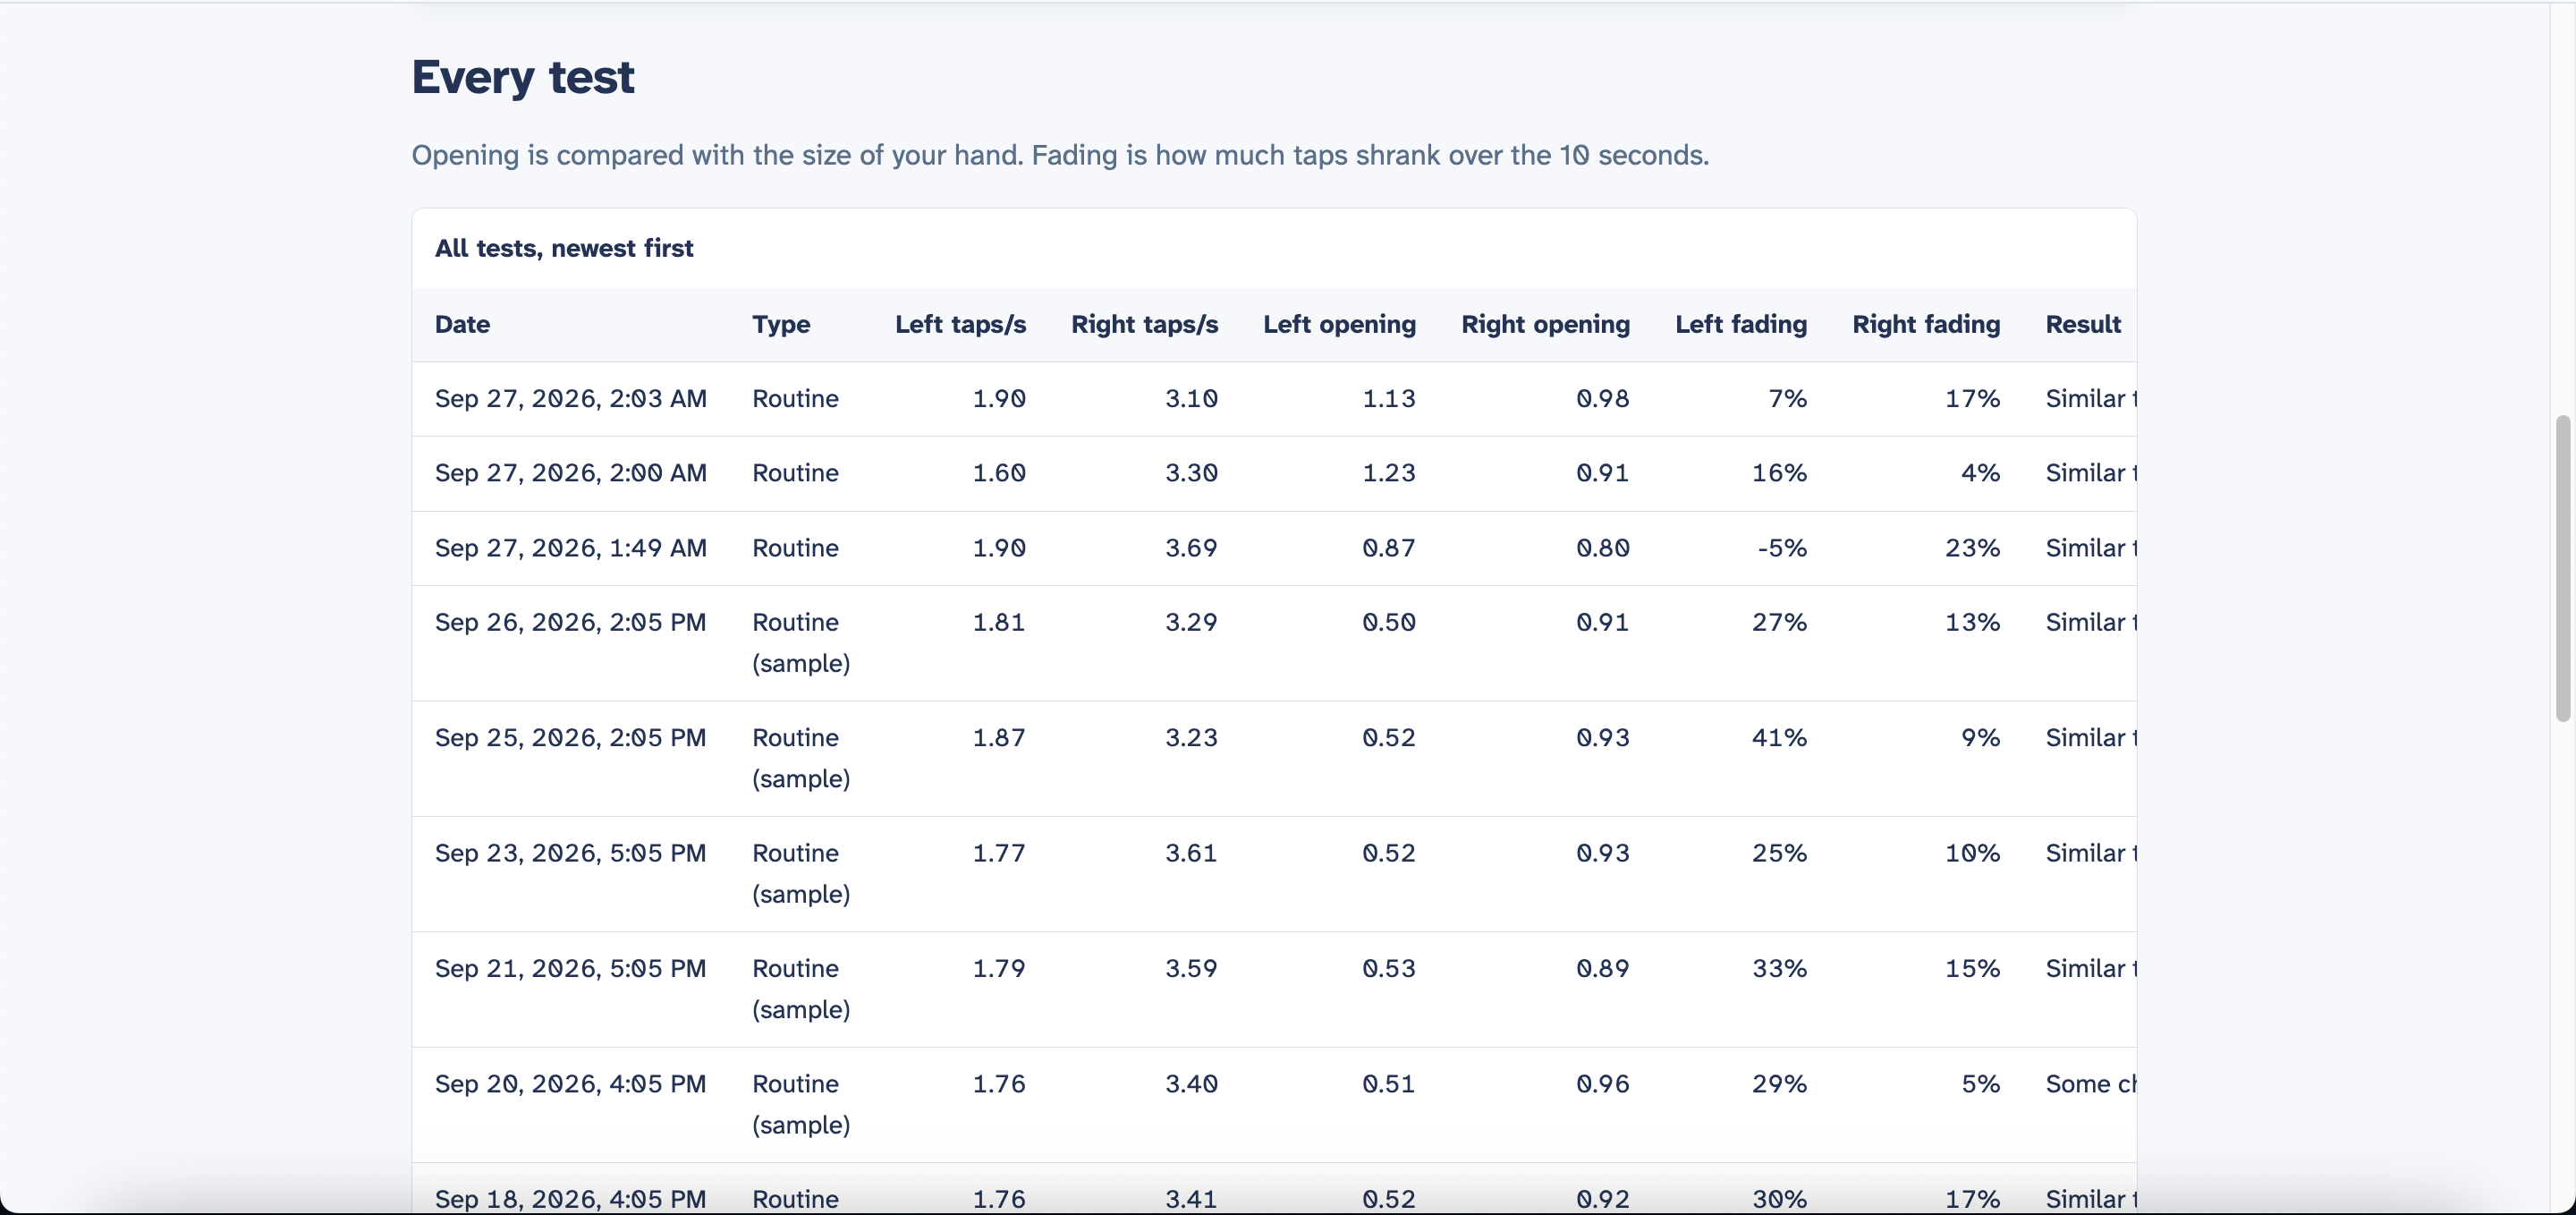
Patient Test History
-
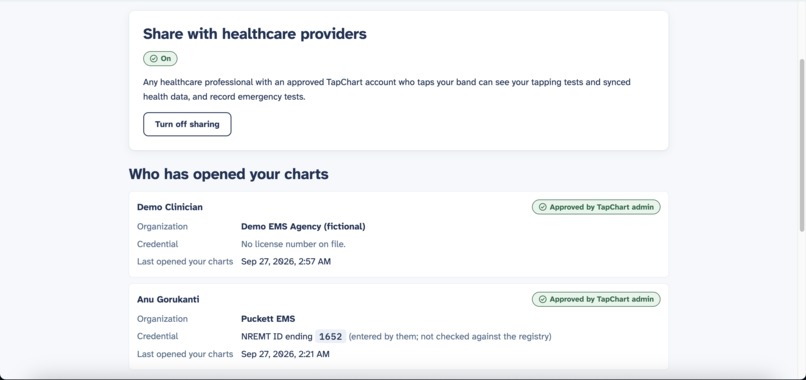
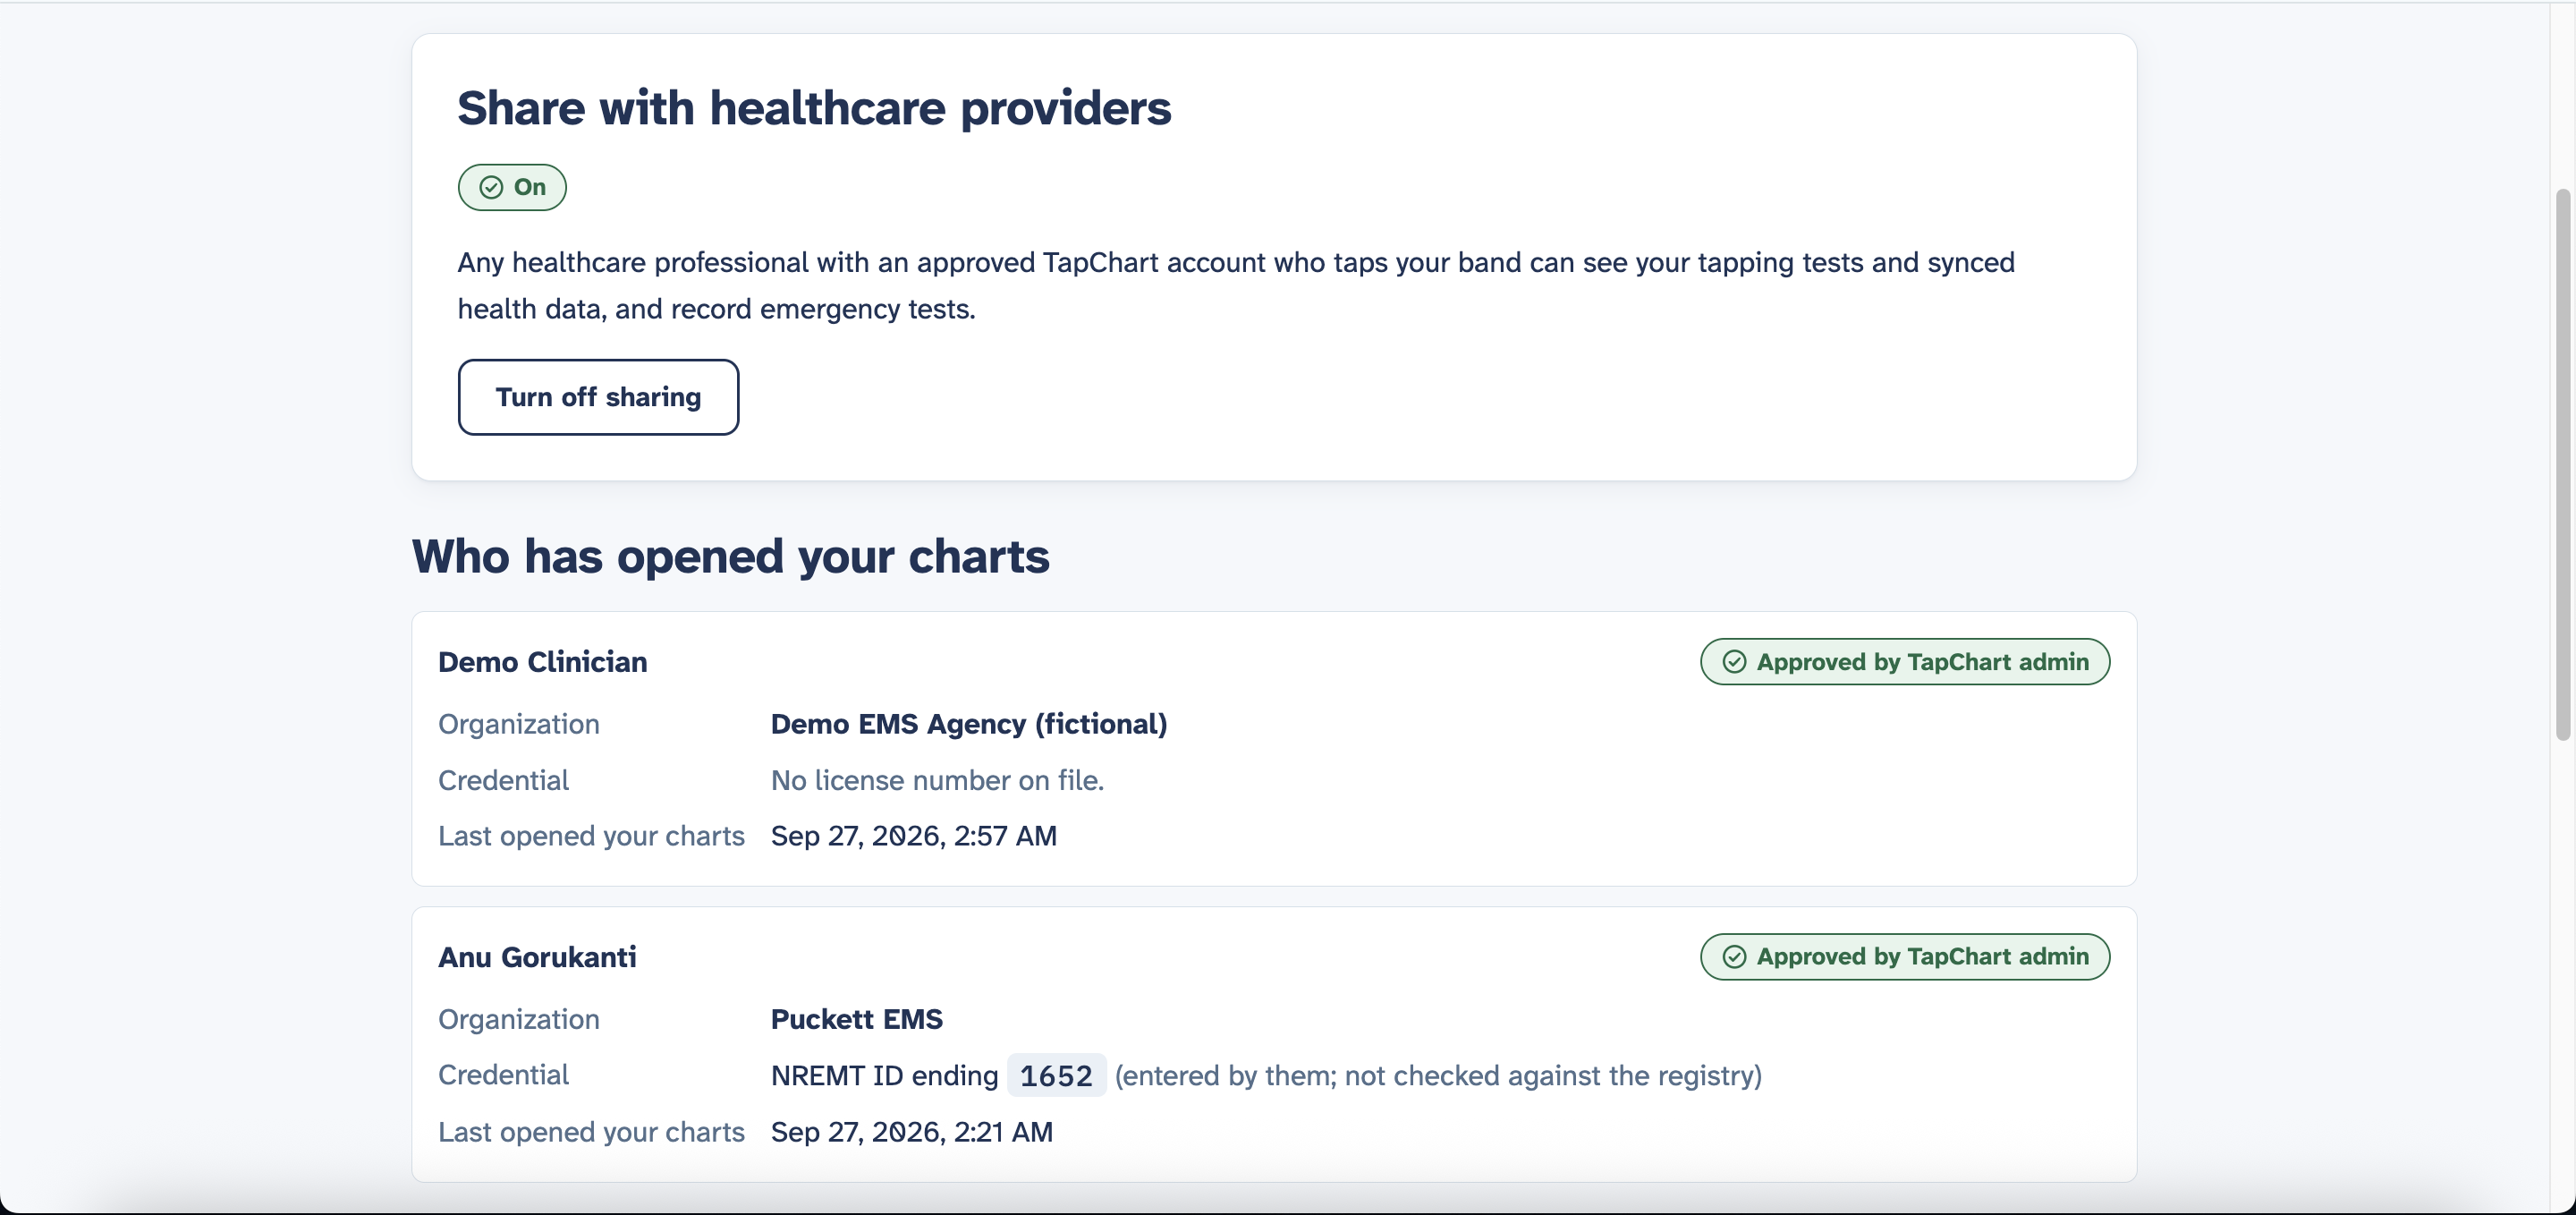
Patients - HCP Log
-
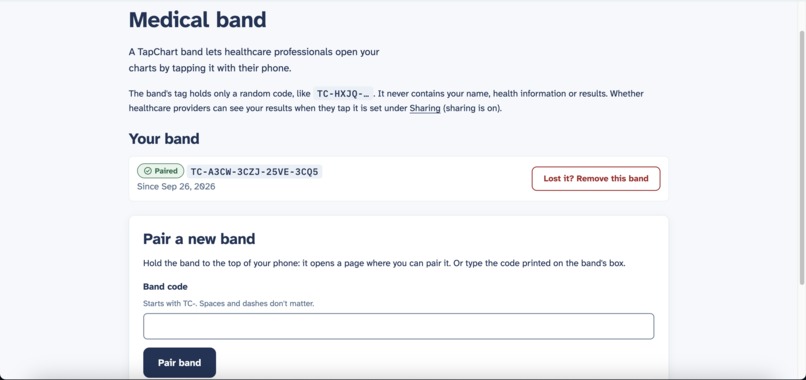
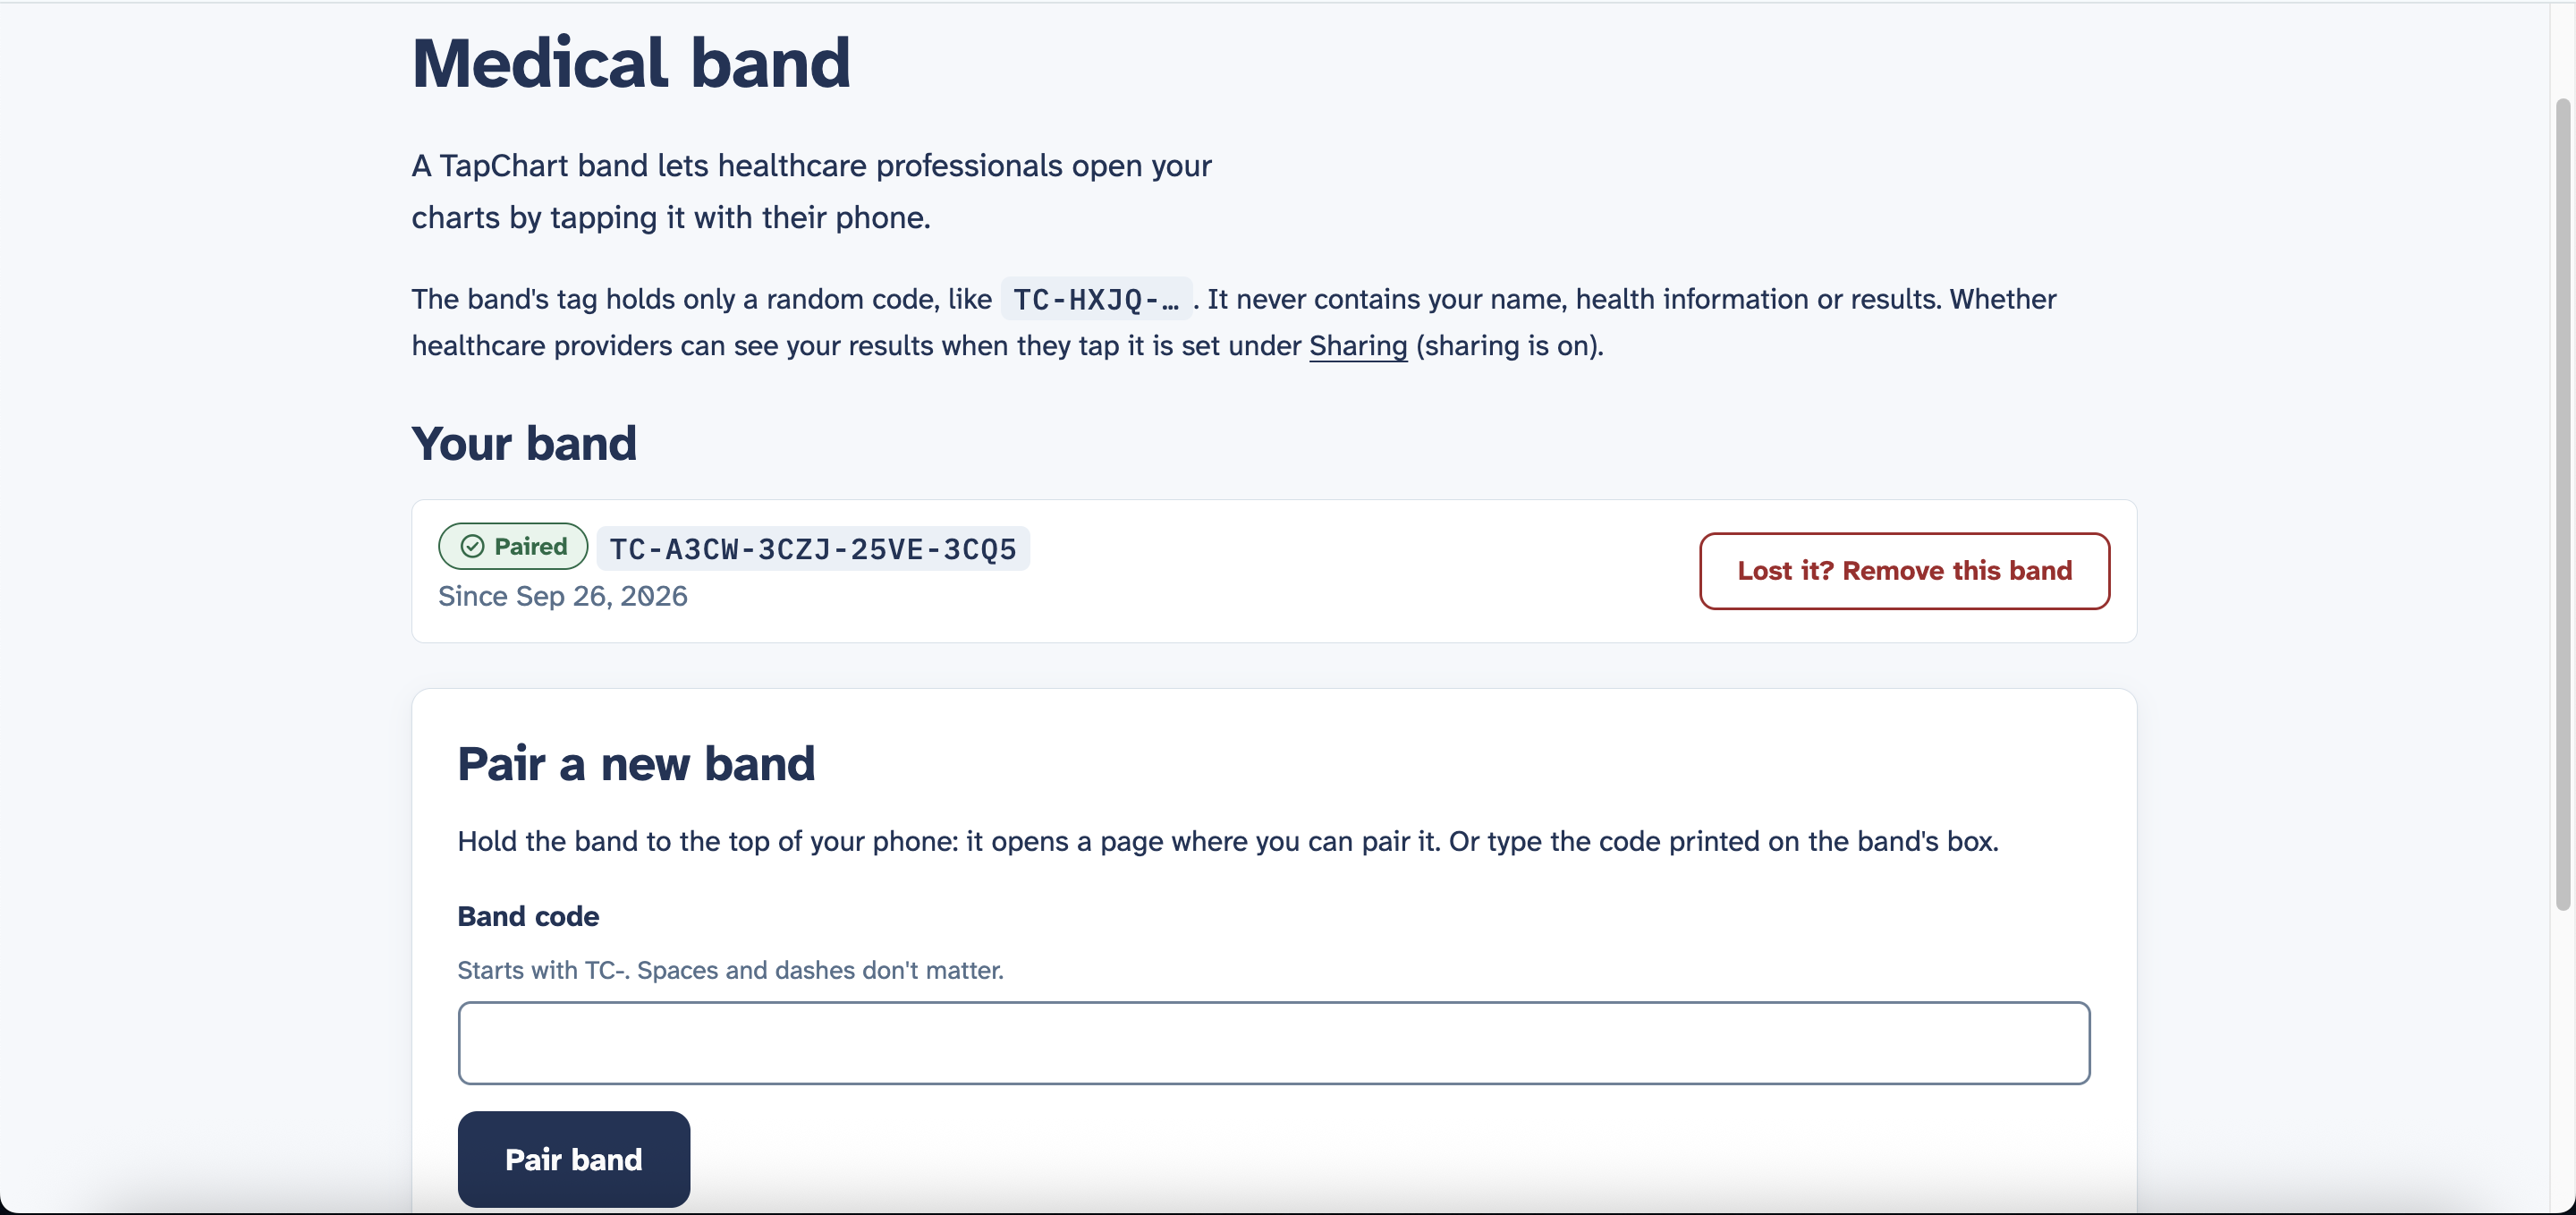
Patients - Medical Band Adding/Editing
-
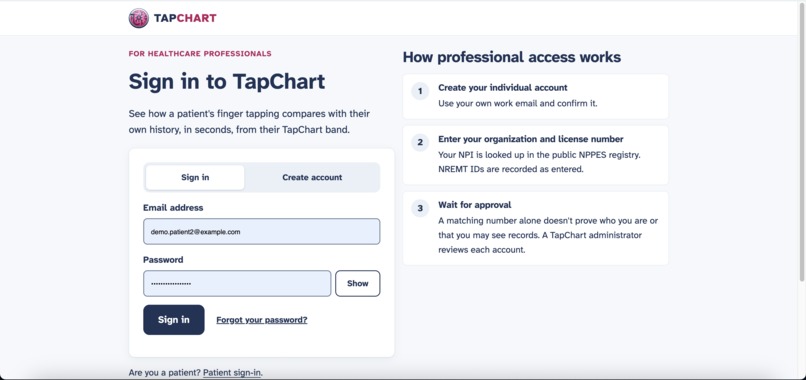
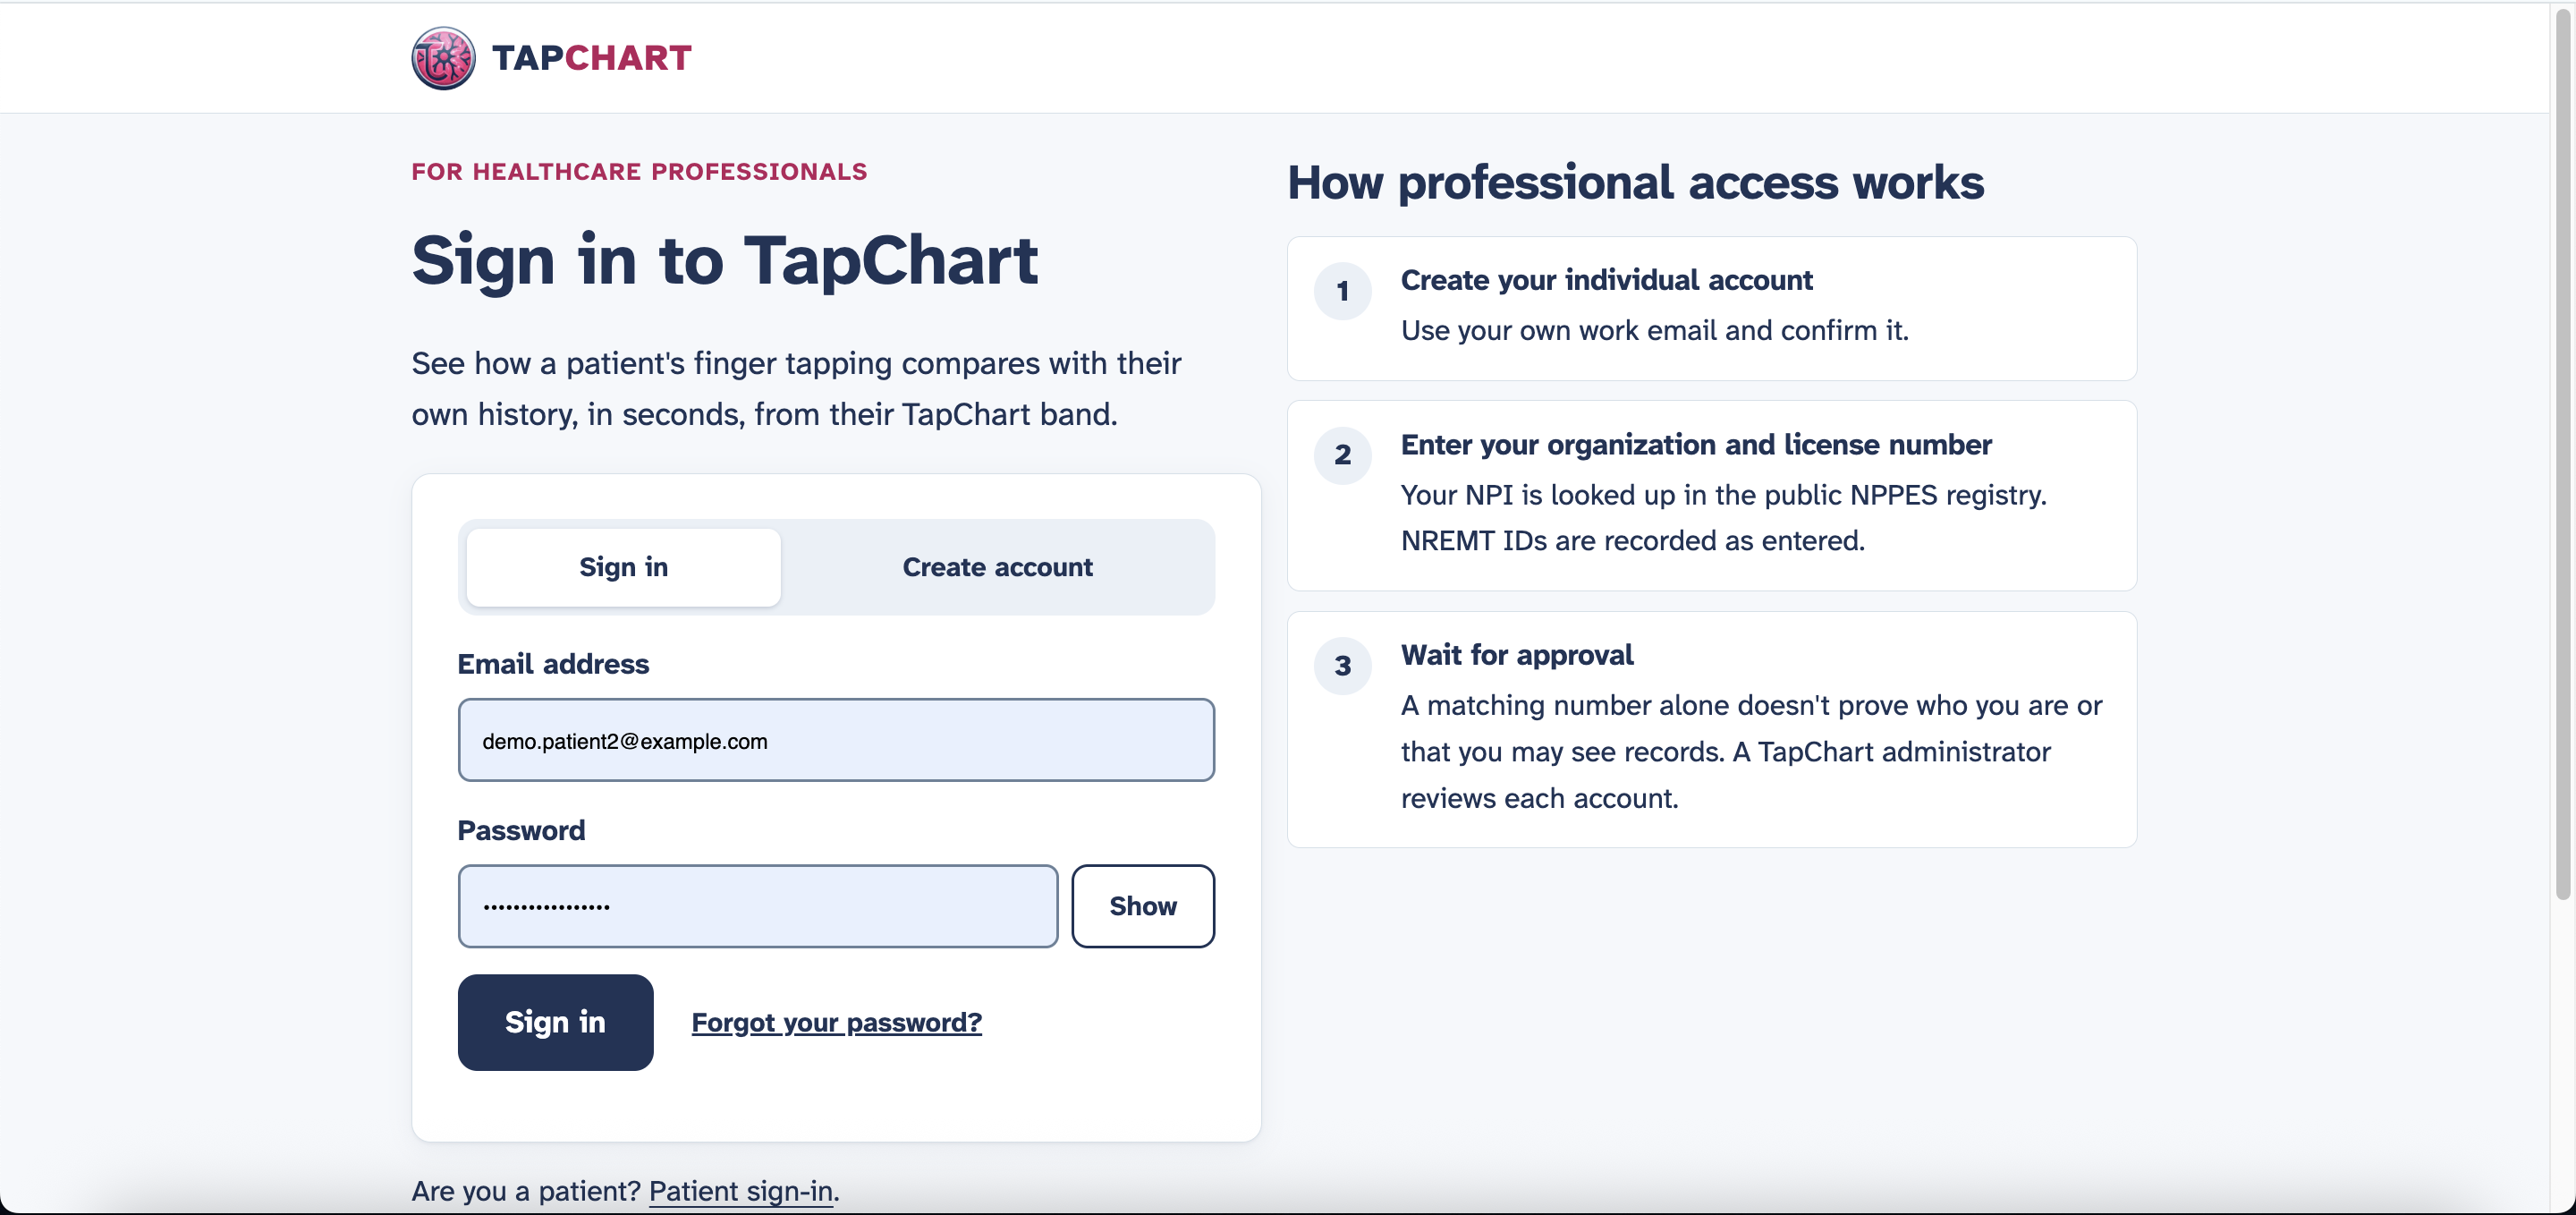
HCP Login
-
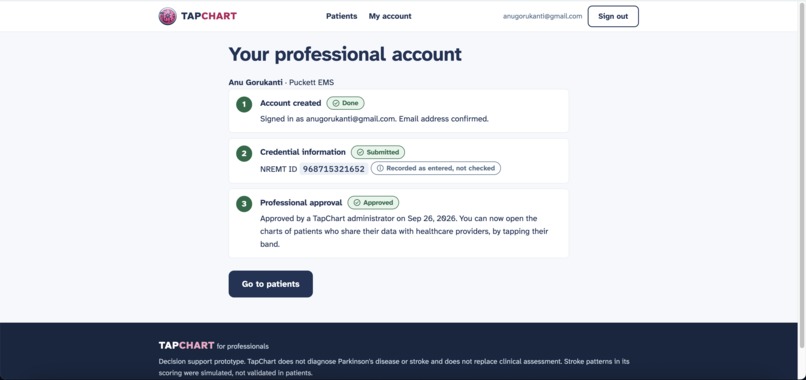
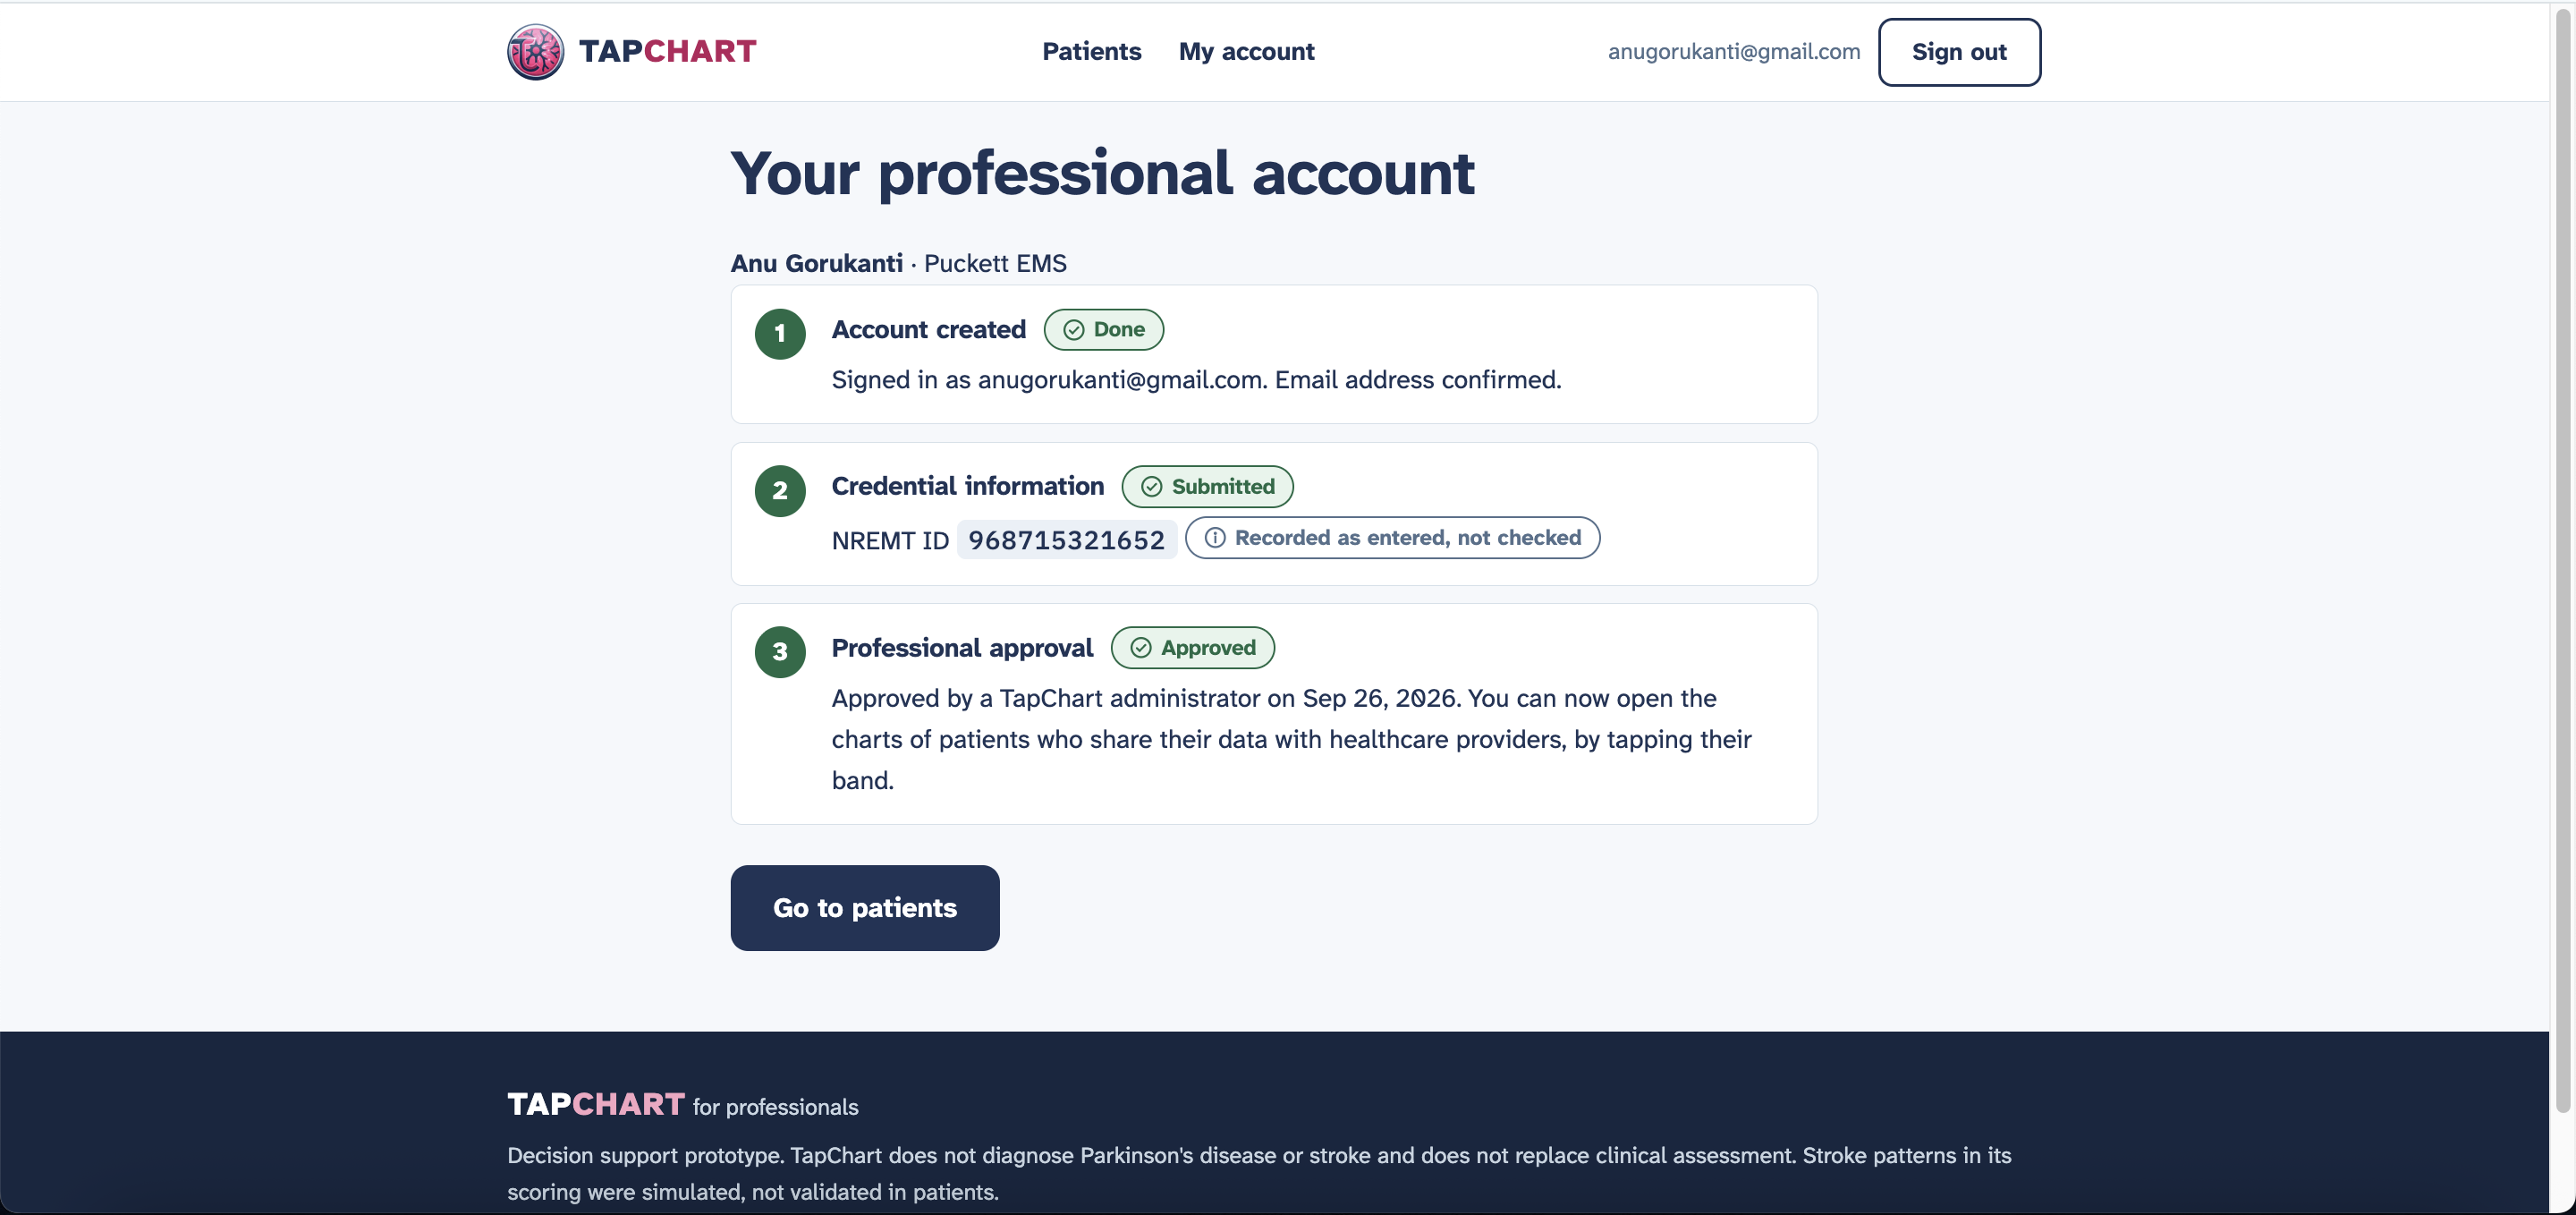
HCP Verification
-
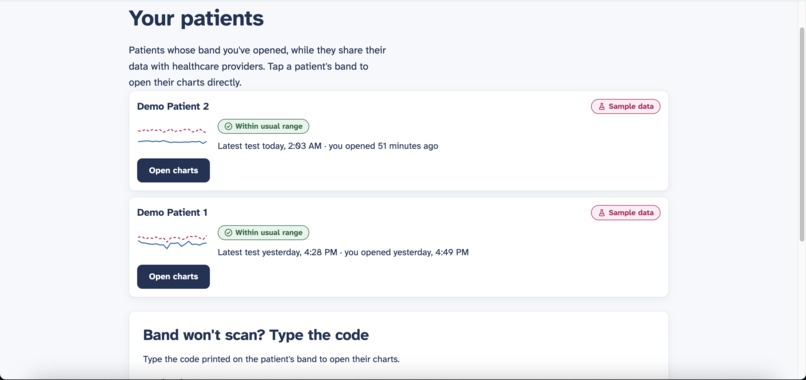
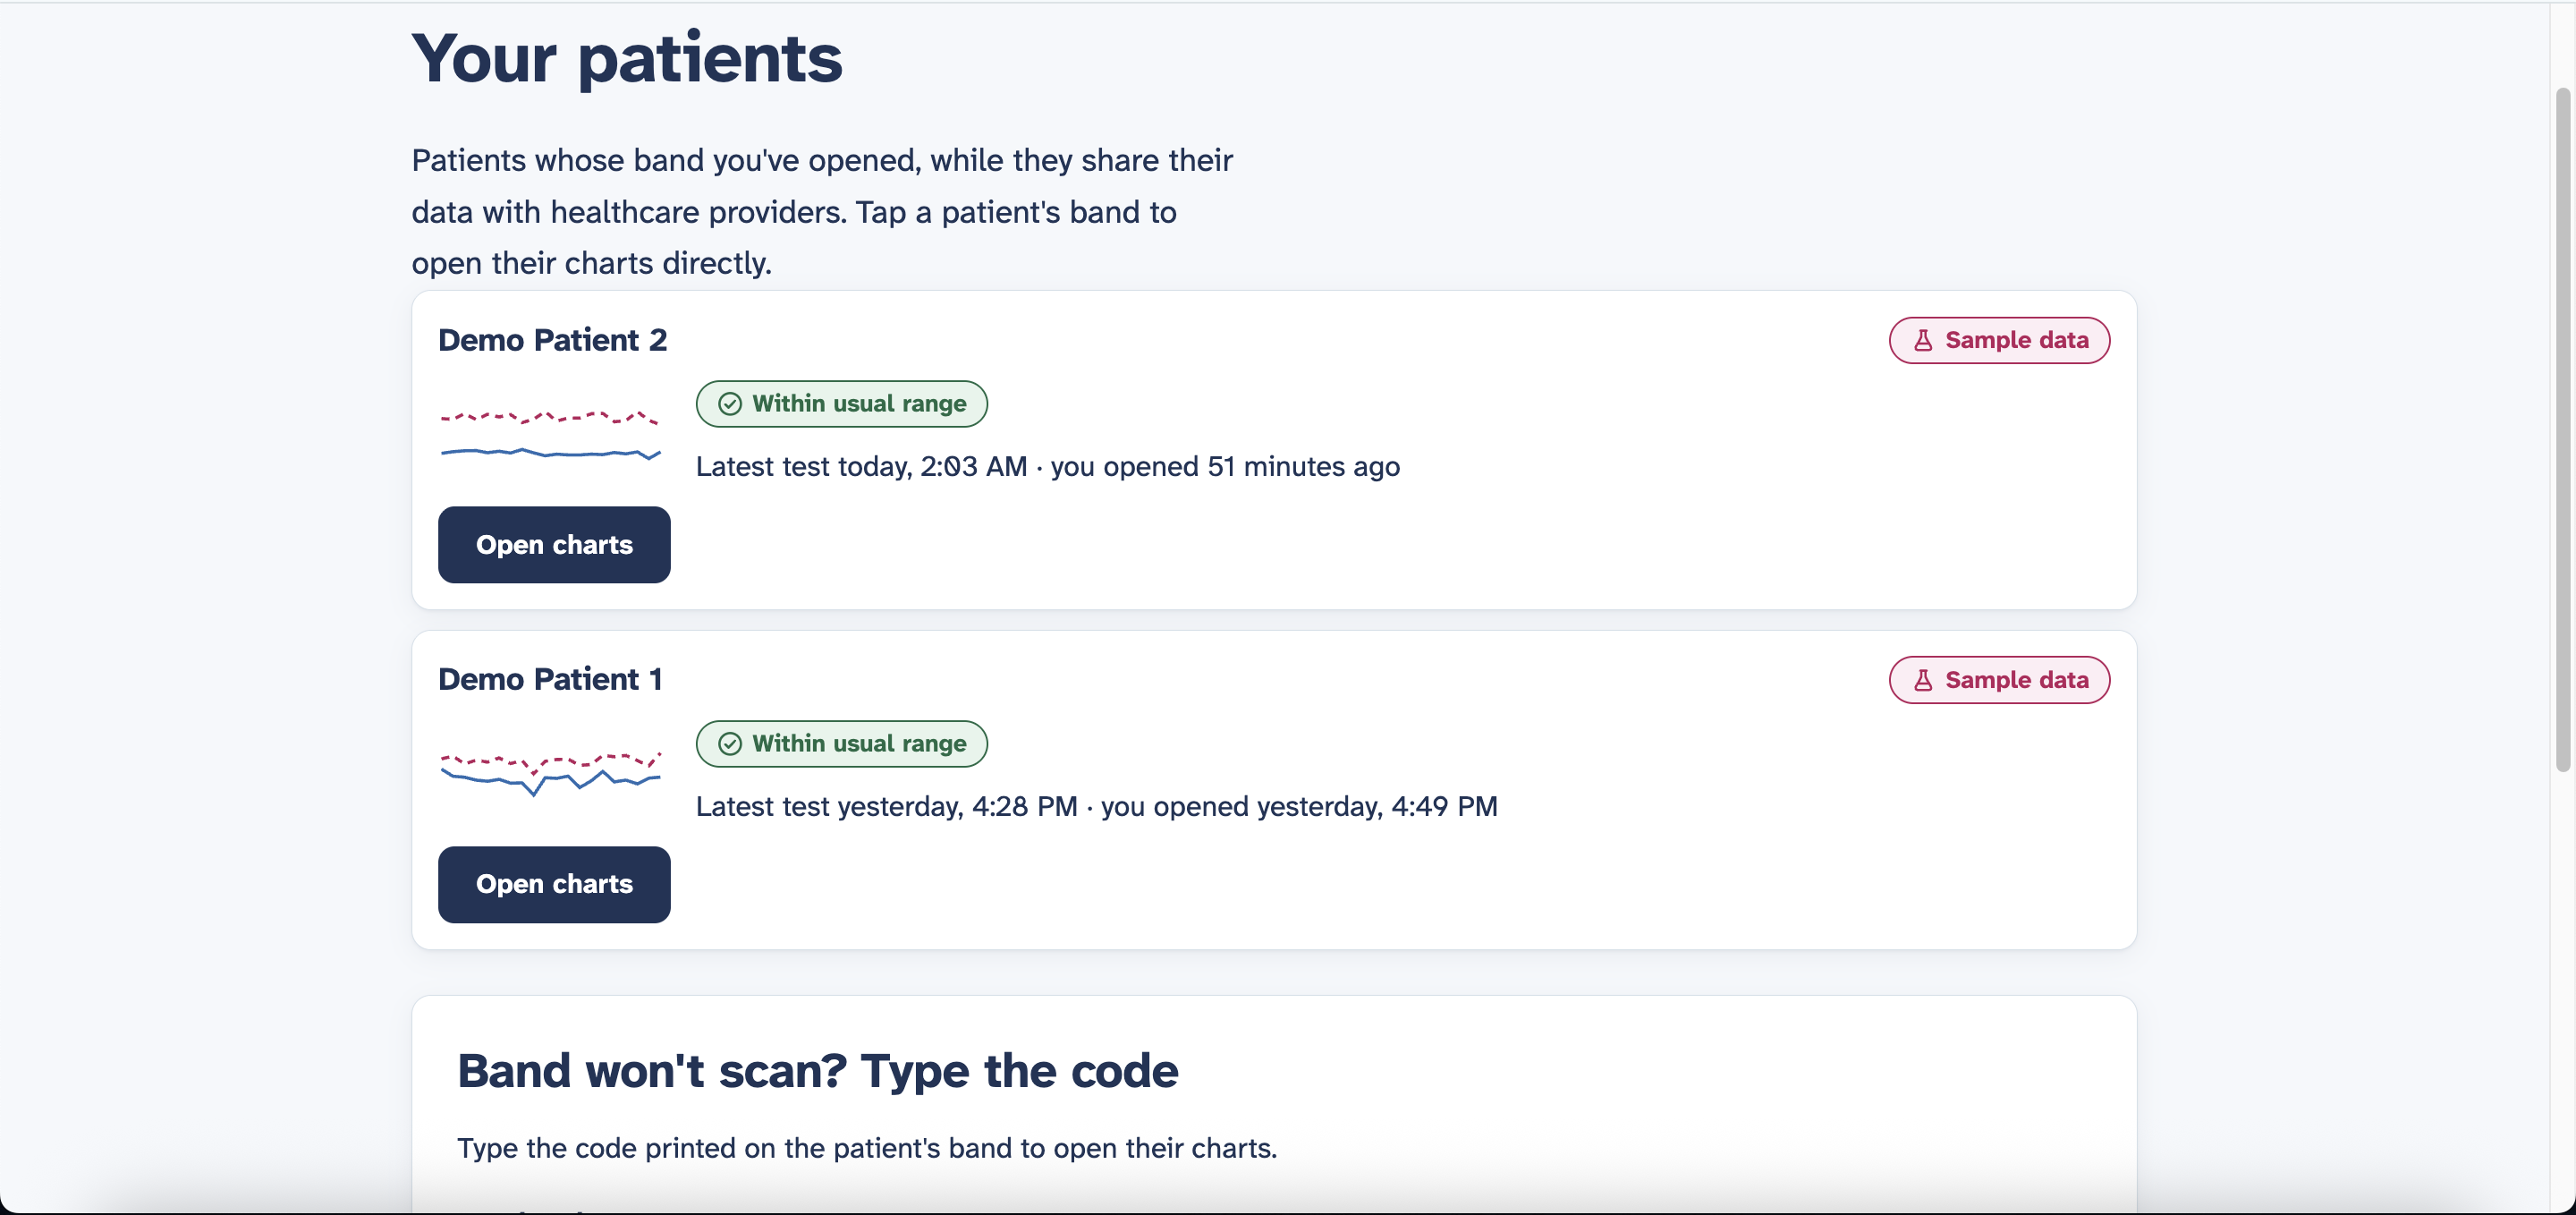
HCP - Patients List
-
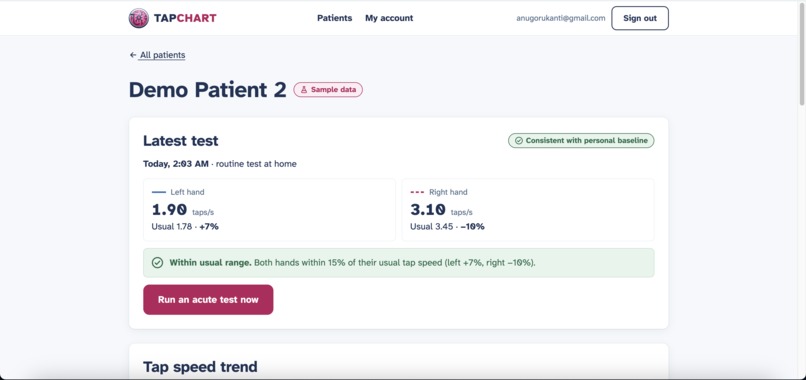
HCP - Patient Data Access
-
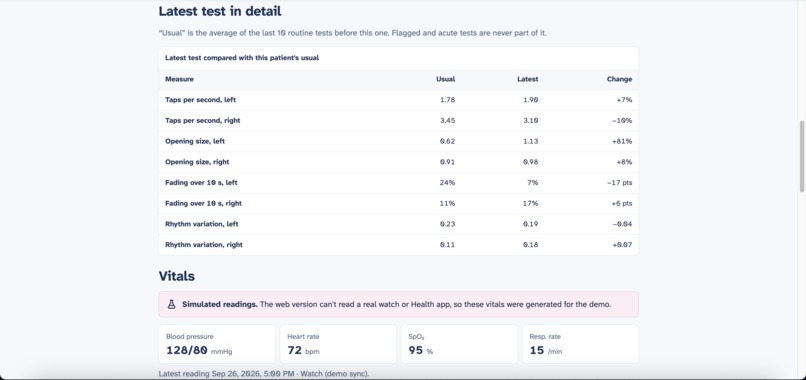
HCP - Patient Data Access Cont.
Inspiration
In an emergency, knowing what changed starts with knowing what is normal.
For someone living with Parkinson's, tremors and movement difficulties can make that distinction harder. A clinician seeing a patient for the first time may have no record of their usual motor function, leaving a critical gap when evaluating a possible stroke.
We built TapChart to make that context accessible. Our starting question was simple: What if a patient's motor baseline could be available with a single tap?
What it does
TapChart connects routine motor tracking with accessible clinical context.
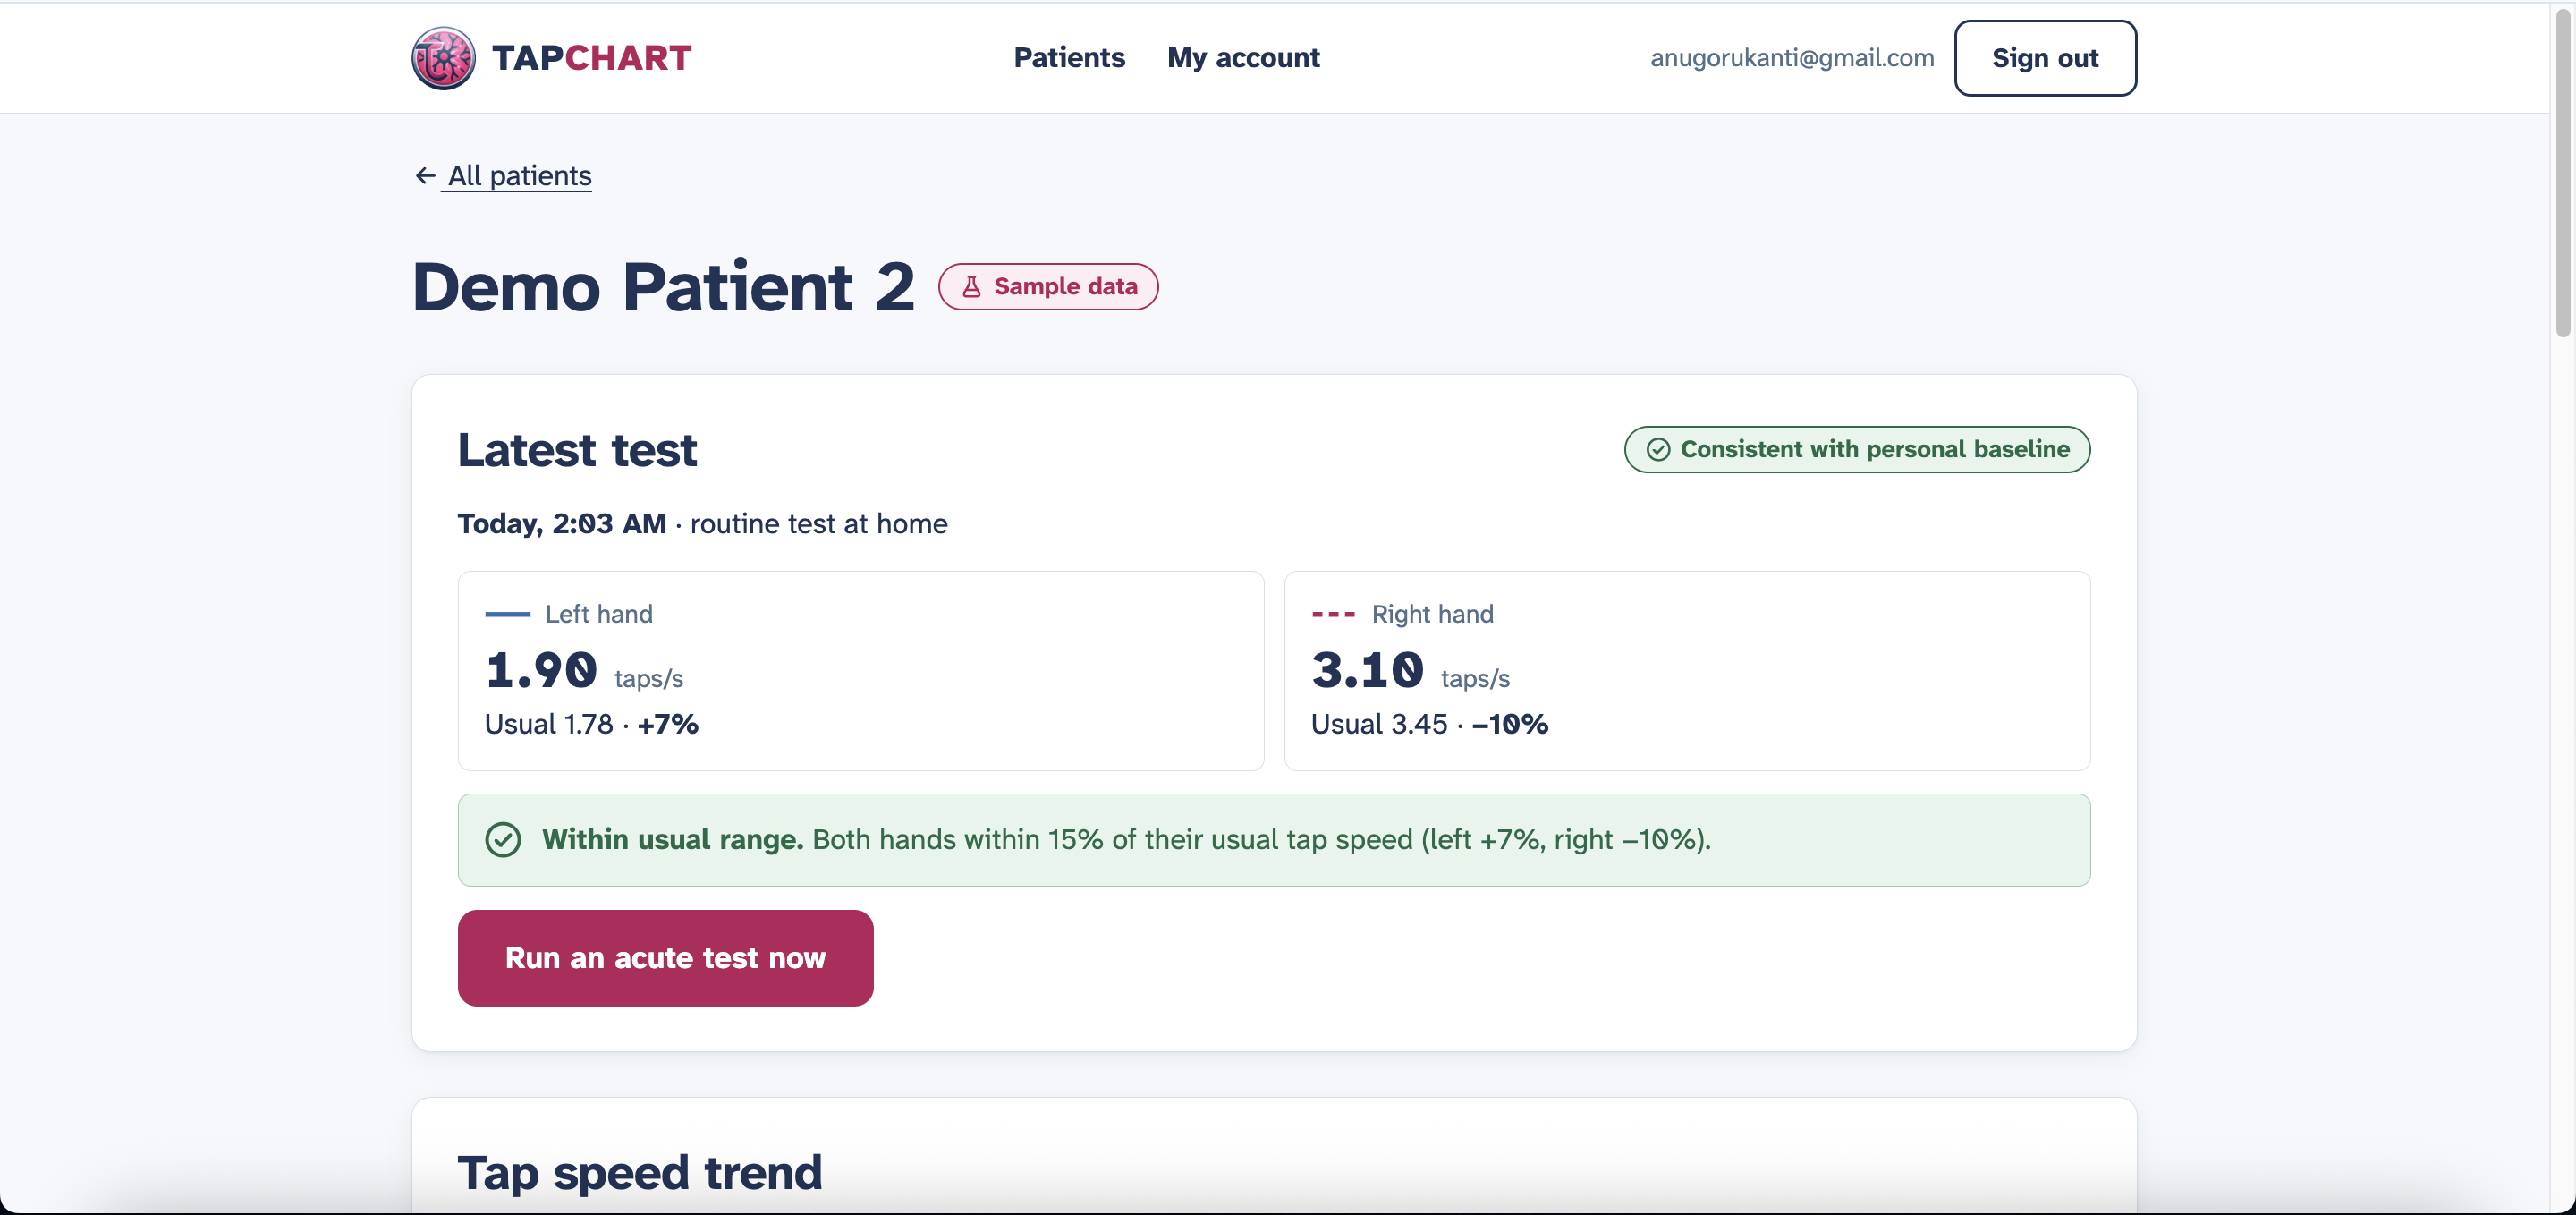
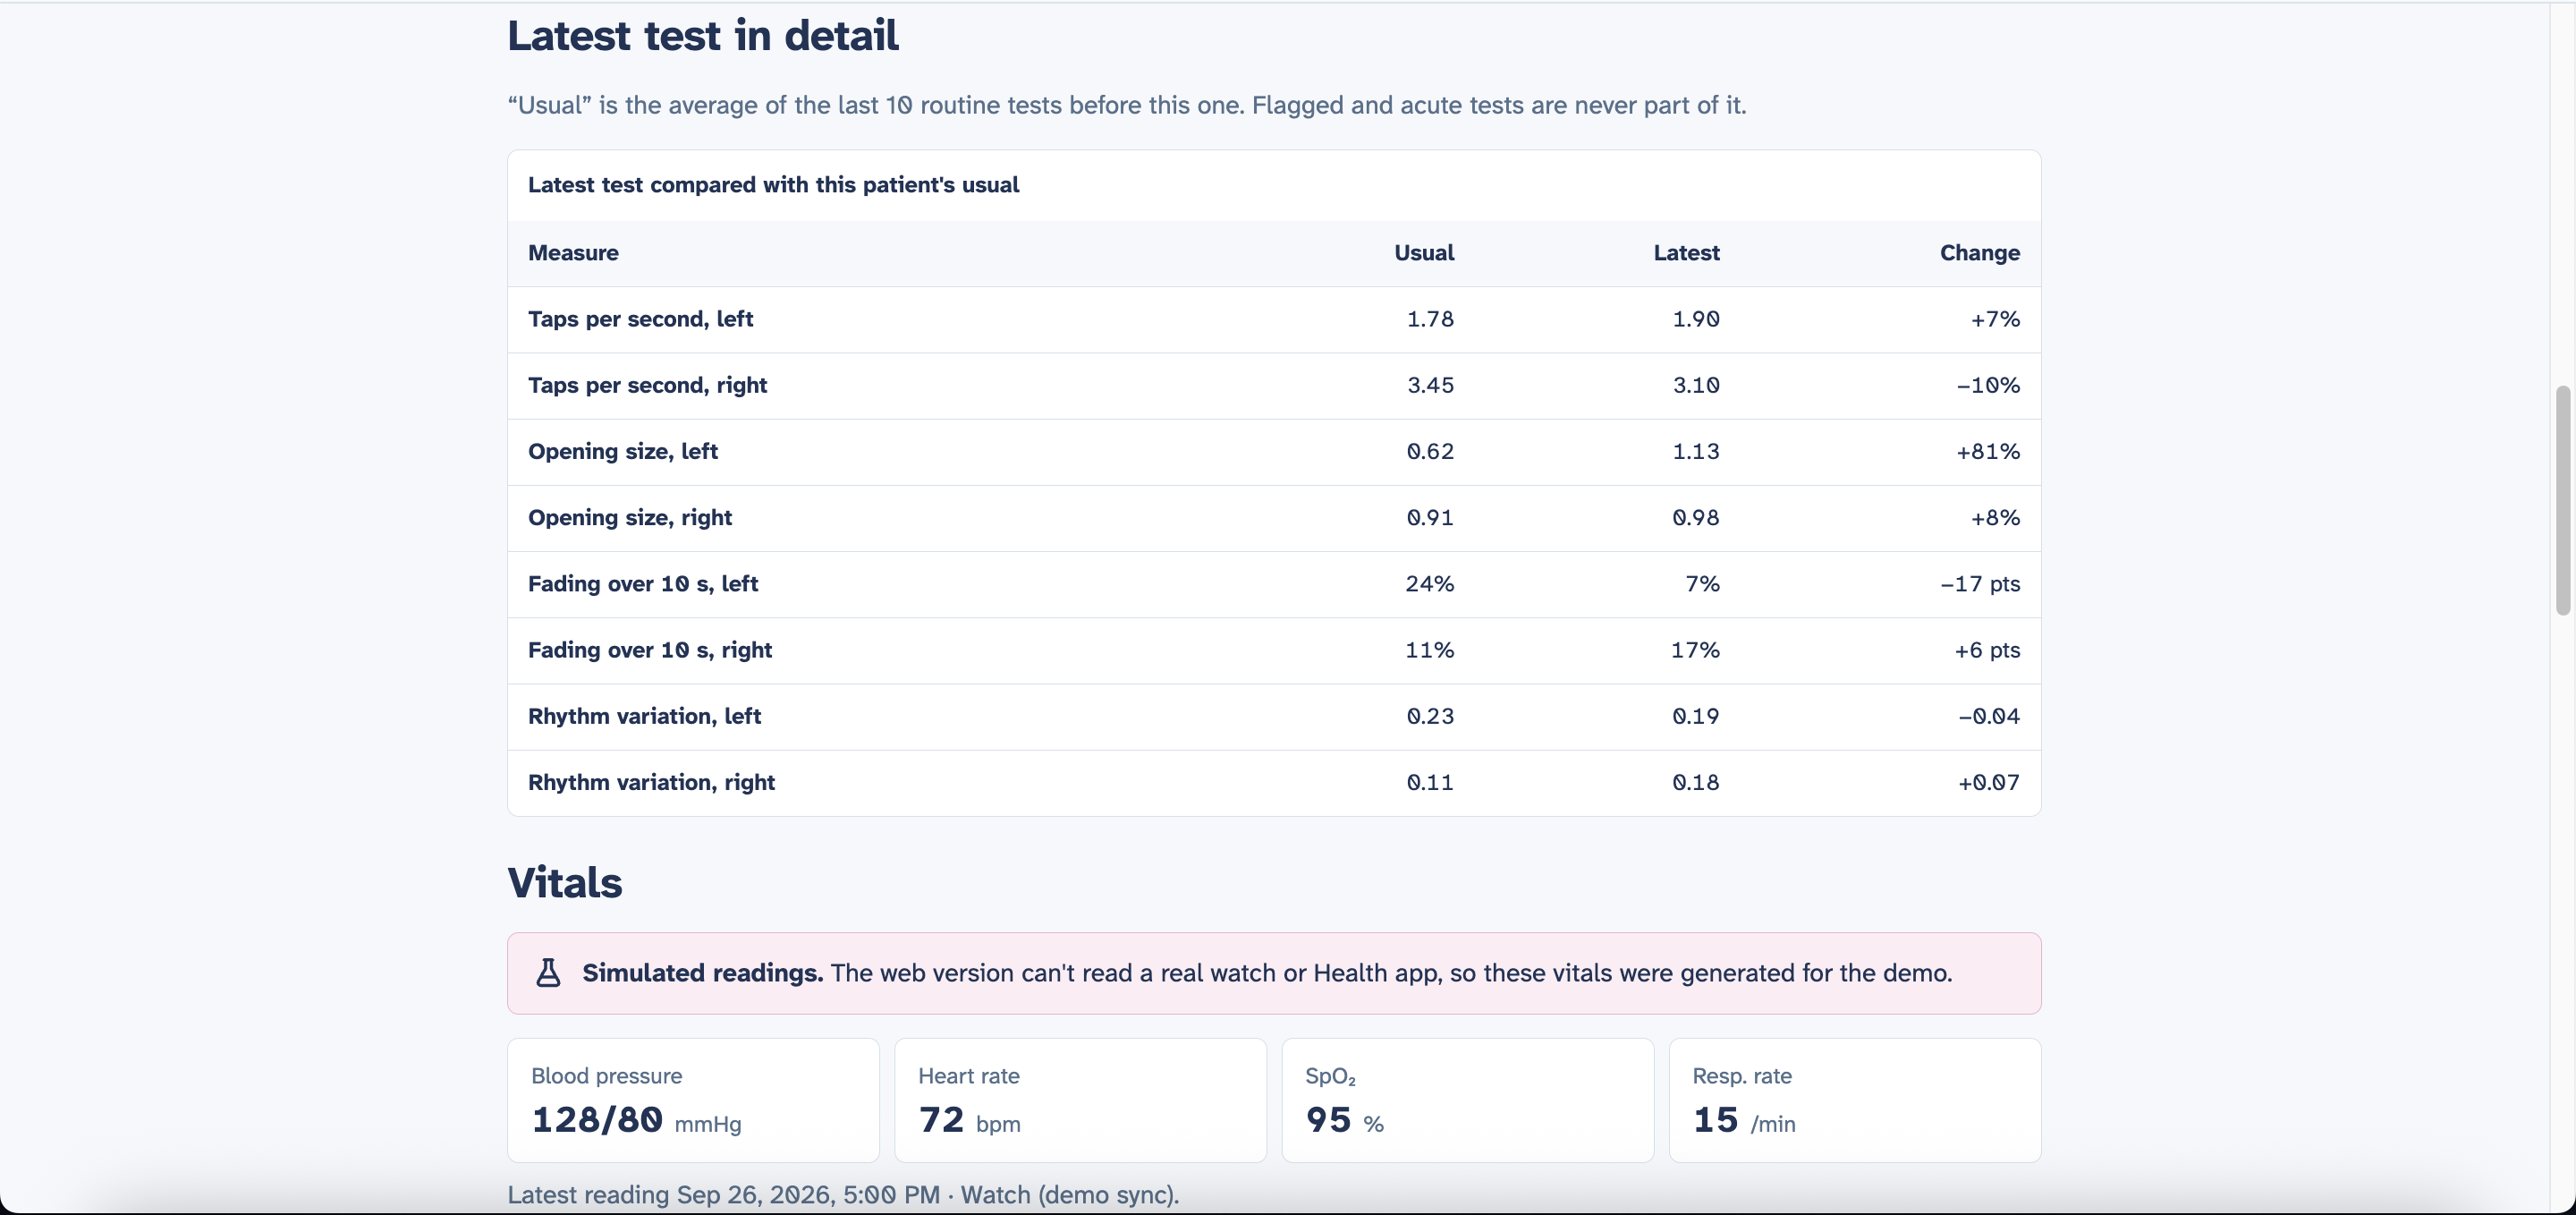
Patients complete a short, camera-based finger-tapping test to record their motor performance over time. TapChart turns those measurements into a personal baseline and charts that help care teams understand the patient's usual movement patterns.
An NFC-linked patient profile gives doctors, EMTs, and other healthcare professionals a quick route to that information. When a patient presents with concerning symptoms, their care team can compare recent measurements with their history by tapping their tag.
TapChart provides context for clinical assessment. It does not diagnose or rule out a stroke.
How we built it
We brought together a patient-facing testing experience, movement analysis, stored motor measurements, and an NFC-accessible clinical view.
Our movement-analysis pipeline extracts finger-tapping data from a short camera recording. We store the resulting measurements and summaries rather than the videos, associating each patient's records with a unique identifier.
The patient experience focuses on completing tests and viewing trends. The healthcare professional experience focuses on quickly finding and interpreting the patient's baseline.
Challenges we ran into
One of our biggest design challenges was serving two very different situations: a patient completing a routine test at home and a care professional seeking context under time pressure.
We also had to think carefully about accessibility. An interface for people with motor difficulties needs clear instructions, readable text, large controls, and as few unnecessary steps as possible.
Another challenge was defining what our prototype could responsibly communicate. Motor measurements can provide useful context, but translating them into a clinical conclusion requires evidence beyond a hackathon demo.
Accomplishments that we're proud of
We're proud of connecting a simple patient action to a concrete information gap in care.
Instead of treating each test as an isolated result, TapChart builds a picture of the individual over time. Pairing that history with NFC access makes the information easier to reach when it matters.
We also made privacy part of our design by keeping derived motor data instead of storing patient videos and ensuring NFC access was only available for licensed healthcare providers.
What we learned
We learned that collecting data is only part of the problem. Making it accessible, understandable, and relevant to the person using it is just as important.
Designing for patients and care teams pushed us to consider accessibility, speed, privacy, and clinical limitations together. It also reinforced the importance of comparing a patient with their own history rather than assuming one baseline fits everyone.
What's next for TapChart
Our next step is to gather feedback from people living with Parkinson's, neurologists, and emergency care professionals.
We want to evaluate measurement consistency, improve the accessibility of the testing flow, and understand which trends are most useful to clinicians. We would also strengthen provider verification, patient consent, and access controls before any real-world deployment. We also hope to expand the baseline tracking to other degenerative diseases, making this data more available to HCPs for all sorts of conditions.
Built With
- claude
- css
- html
- javascript
- mediapipe
- nfc
- numpy
- opencv
- pandas
- postgresql
- python
- scikit-learn
- scipy
- supabase
- vercel

Log in or sign up for Devpost to join the conversation.