-
-
-
-
-

Where will be your next place to live?


Texas A&M Datathon 2020
Github: https://github.com/johnschwenck/tamu_datathon_2020
Team:
- Allison Bertie Johnson (allisonbertie@tamu.edu)
- Arjun Ravikumar (arjun.cc@gmail.com)
- Christopher Han (christopherhan@stat.tamu.edu)
- John Schwenck (jschwenck@stat.tamu.edu)
Summary
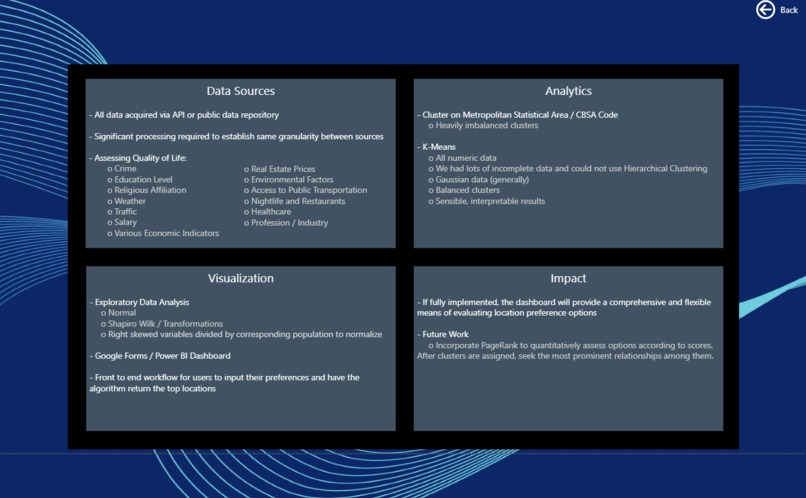
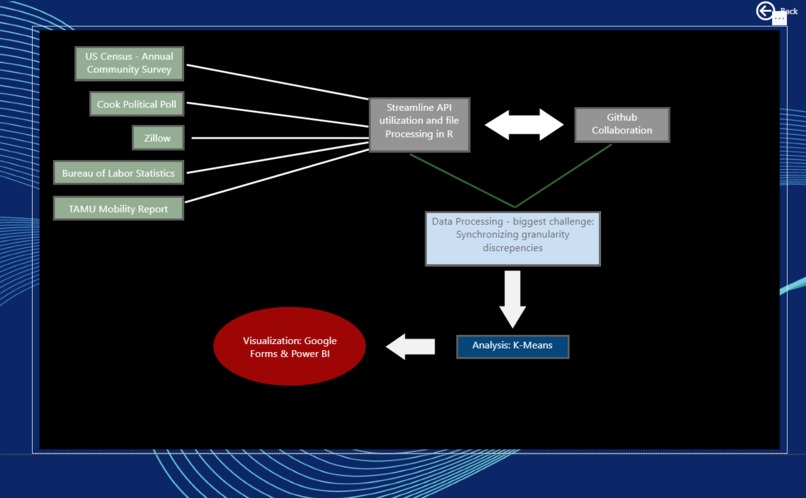
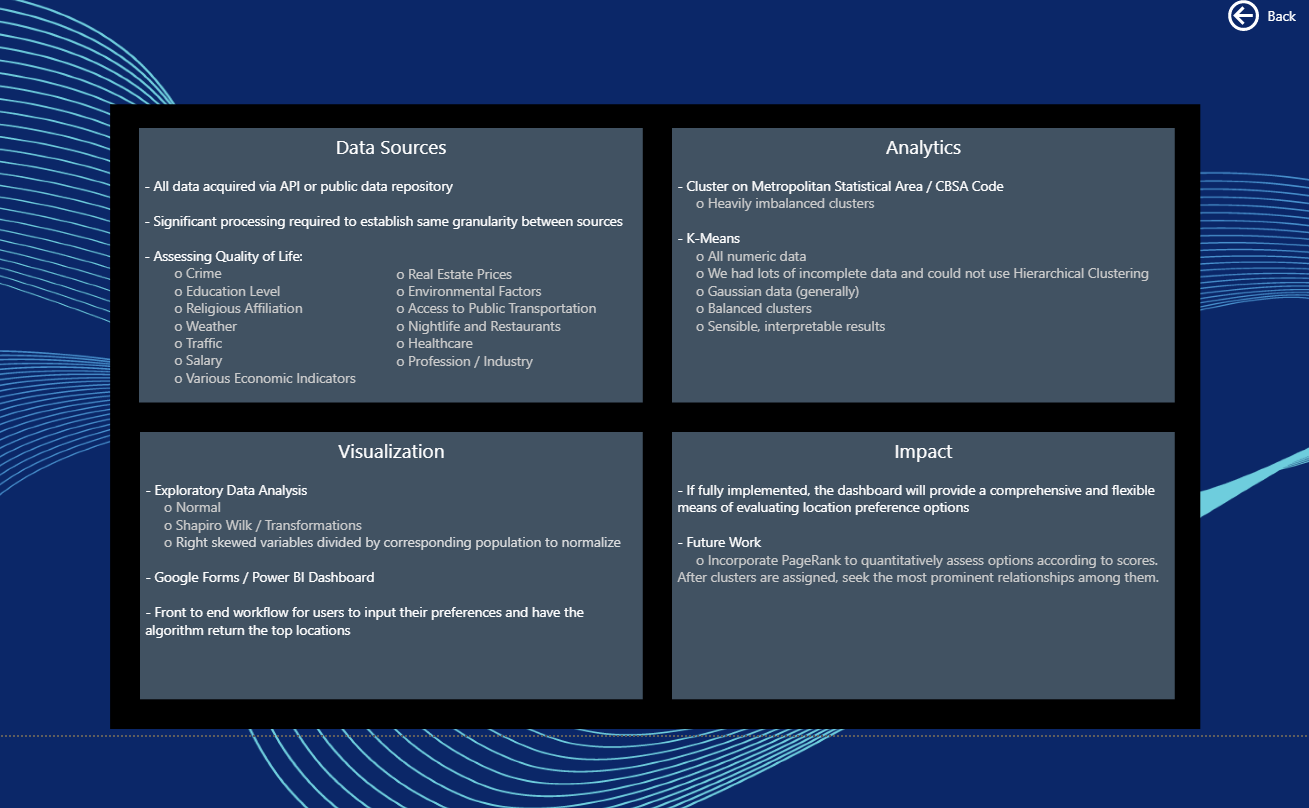
For our 2020 TAMU Datathon submission, we have elected to solve the City Search challenge. Our model's unique spin offers a complete front-to-end implementation of a K-Means algorithm, which suggest the Top 12 best locations for a given user's preferences. We managed to collect and thoroughly process data from over 10 very different sources using various APIs such as the US Census and COVID-19 data. We also utilized Google tools such as Google Forms and Google Sheets where users submit a form with their preferences to a series of questions, which then get fed into a Google Sheet. Using R, we extract the information from the Google Sheet using the googledrive package and feed it into our K-Means algorithm.
Outline of Our Approach:
- Identify region of interest (U.S)
- Decide on the granularity (Metropolitan Area/ CBSA code)
- Identify variables of interest
- Obtain relevant dataset for each variable (API, government, other websites)
- Process each dataset to obtain relevant columns
- Map each dataset from zip code/city/county level to Metropolitan area through CBSA ID
- Join all the mapped datasets into one table containing CBSA ID, and all relevant columns
- Analyze dataset using K-Means Clustering and output cities within the chosen cluster
- Utilize Power BI to create visuals
Variable Descriptions:
Housing (2019-2020):
Source: https://www.zillow.com/research/data/
Raw Data: ZHVI_1.csv, ZHVI_2.csv, ZHVI_3.csv, ZHVI_4.csv, ZHVI_5.csv, ZHVI_condo.csv
Processed Data: housing.rda
Variable Descriptions:
- CBSA: Core-based statistical area code
- one_bed_avg: Average price in dollars of one bedroom house
- two_bed_avg: Average price in dollars of two bedroom house
- three_bed_avg: Average price in dollars of three bedroom house
- four_bed_avg: Average price in dollars of four bedroom house
- five_bed_avg: Average price in dollars of five bedroom house
- condo_avg: Average price in dollars of a condo
Rental Prices (2021 Forecast):
Source: https://www.huduser.gov/portal/datasets/fmr.html#2021_data
Raw Data: fy2021-safmrs.xlsx
Processed Data: rent_metro.rda
Variable Descriptions:
- CBSA: Core-based statistical area code
- one_bed_rent: Fair Market Rent for one bedroom apartment
- two_bed_rent: Average price in dollars of two bedroom apartment
- three_bed_rent: Average price in dollars of three bedroom apartment
- four_bed_rent: Average price in dollars of four bedroom apartment
- five_bed_rent: Average price in dollars of five bedroom apartment
Air Quality Index (2019):
Source: https://aqs.epa.gov/aqsweb/airdata/download_files.html#Annual
Raw Data: annual_aqi_by_cbsa_2019.csv
Processed Data: air_quality.rda
Variable Descriptions:
- City, State: City and State for each entry
- CBSA: Core-based statistical area code
- Median AQI: Median Air Quality Index
Public Transportation (2018):
Source: https://api.census.gov/data/2018/acs/acs5/variables.html
Raw Data:
Census API key needed
pub_trans = B08006_008
Processed Data: pub_trans.rda
Variable Description:
- CBSA: Core-based statistical area code
- NAME: City, State Abbr. Area Type
- Avg_User: Average number of users
Daily Average of Temperatures (2011):
Source: https://wonder.cdc.gov/controller/datarequest/D60
Raw Data: max_avg_temps2011.txt and min_avg_temps2011.txt
Processed Data: avg_temps_msa.rda
Variable Description:
- CBSA: Core-based statistical area code
- mean(Avg.Min.Temp): mean average of minimum air temperature for each CBSA
- mean(Avg.Max.Temp): mean average of maximum air temperature for each CBSA
Demographics
Source: https://www.bls.gov/oes/tables.html
Raw Data: B01003_001B01002_001, B19013_001
Processed Data: demographics.rda
Variable Descriptions:
- CBSA: Core-based statistical area code
- CBSA_name: Core-based statistical area name
- tot_emp_hc: Total employees in healthcare
- loc_quotient_hc: Location quotient for healthcare
- tot_emp_rest: Total employees in restaurants and food service
- loc_quotient_rest: Location quotient for restaurants and food service
- pop: Population
- pca_hc: Healthcare employees per capita
- rest_hc: Restaurant and food service workers per capita
Healthcare and Restaurant Labor Statistics (2019):
Source: https://www.bls.gov/oes/tables.html
Raw Data: oesm19ma.zip; MSA_M2019_dl.xlsx
Processed Data: healthcare_restaurants_labor.rda
Variable Descriptions:
- CBSA: Core-based statistical area code
- CBSA_name: Core-based statistical area name
- tot_emp_hc: Total employees in healthcare
- loc_quotient_hc: Location quotient for healthcare
- tot_emp_rest: Total employees in restaurants and food service
- loc_quotient_rest: Location quotient for restaurants and food service
- pop: Population
- pca_hc: Healthcare employees per capita
- rest_hc: Restaurant and food service workers per capita
COVID Cases and Deaths (2020):
Source: https://www.nytimes.com/interactive/2020/us/coronavirus-us-cases.html
Raw Data: us_crime_counties.csv
Processed Data: covid_14dayavg.rda
Variable Descriptions:
- CBSA: Core-based statistical area code
- mean(cases): 14-day average of cases
- mean(deaths): 14-day average of deaths
Transportation (2016-2018):
Source: https://api.census.gov/data/2018/acs/acs5/variables.html
Raw Data: B08101_025, B08134_061, B08101_009, B08134_011, B08134_021, B08301_004, B08134_031, B08101_033, B08101_041, B08134_111, B08101_049, B08134_001
Processed Data: transportation.rda
Variable Description:
- CBSA: Core-based statistical area code
- public_trans_qty: Average number of people who took public transportation
- priv_trans_all_qty: Average number of people who took private transportation
- priv_trans_carpool_qty: Average number of people who took private transportation and carpooled
- walked_qty: Average number of people who walk
- bike_cab_other_qty: Average number of bike, cab and other transportation usage
- work_from_home_qty: Average number of people who work from home
- avg_time_to_work_all: Average number of seconds for a person to get to work
Religion (2010):
Source: https://www.thearda.com/Archive/ChCounty.asp
Raw Data: religion.csv
Processed Data: religion.rda
Variable Description:
- CBSA: Core-based statistical area code
- sum(TOTCNG): All denominations/groups - Total number of congregations
- sum(TOTADH): All denominations/groups - Total number of adherents
- sum(NONDCNG): Non-denominational - Total number of congregations
- sum(NONDADH): Non-denominational- Total number of adherents
- mean(TOTRATE): All denominations/groups - Rates of adherence per 1,000 population
- mean(NONDRATE): Non-denominational - Rates of adherence per 1,000 population
Education
Source: https://libguides.princeton.edu/c.php?g=464855&p=3181354
Raw Data: B15003_017, B15003_018, B15003_022, B15003_023, B15003_024, B15003_025
Processed Data: education.rda
Variable Description:
- CBSA: Core-based statistical area code
- edu_hs_only: Total number of people who only have a high school diploma
- edu_ged_only: Total number of people who only have a GED
- edu_bs: Total number of people who have a Bachlor's degree
- edu_ms: Total number of people who hae a masters
- edu_prof: Total number of professional persons
- edu_phd: Total number of people with a PhD
Built With
- api
- powerbi
- r

Log in or sign up for Devpost to join the conversation.