-
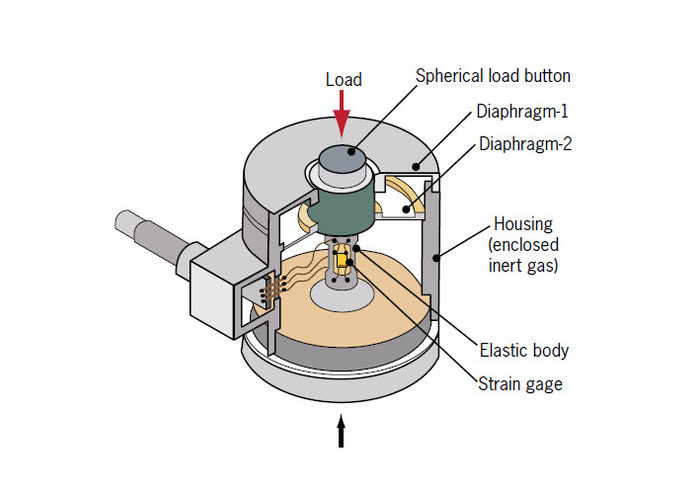
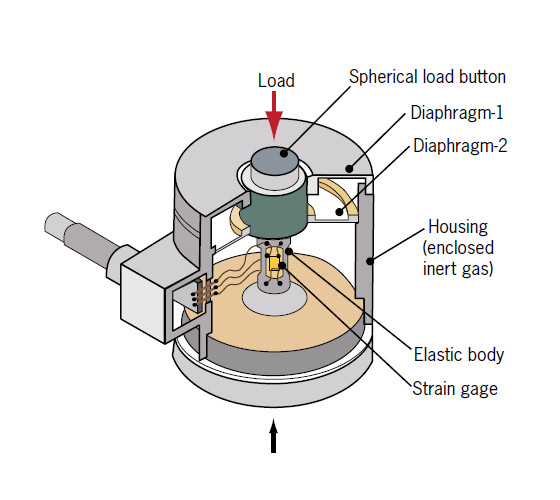
Sensor for Oil and Gas
-
Hail ENARC
Inspiration
In the beginning, we wanted to be part of the learner's track. However once we saw that there was available space in the audience, we could not resist the competitive track. We became entranced with the challenge from ConocoPhillips, which asked us to use ML Classification in order to predict which equipment fails based on 107 sensors with 60k rows.
What it does
Our goal was to classify the data given to us into two categories: failure or success. It predicts whether or not a piece of equipment will fail given certain conditions from 107 sensors that are collecting data from the environment that the equipment is working in. Our project requires training data and testing data as CSV inputs and outputs classifiers for the test data in another CSV file.
How we built it
We used XGBoost classifier that specializes in extreme gradient boosting. In our situation, where we had a ton of numerical data that was inconsistent, had a ton of outliers and NaN values, this classifier was perfect.
Challenges we ran into
Sensor data is very inconsistent, with a ton of 'na' values, so the first challenge was to replace the 'na' values to 'NaN'
Accomplishments that we're proud of
Our model was able to accomplish an F1 score of 0.99392, propelling us into top 10 teams out of 67, and allowing us to stay there for about an hour before moving on to 11th place for the rest of the competition. We have never dealt with processing .csv files seriously, so we were able to learn a lot in terms of file processing and tuning classifiers.
What we learned
We have learned and gained another utility of a ML boosting technique, particularly XGBoost.
What's next for TAMU_Datathon
Built With
- jupyter-notebook

Log in or sign up for Devpost to join the conversation.