-
-

-

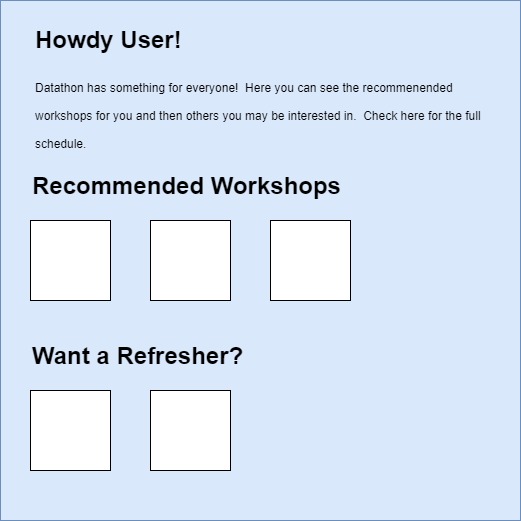
User Interface
-
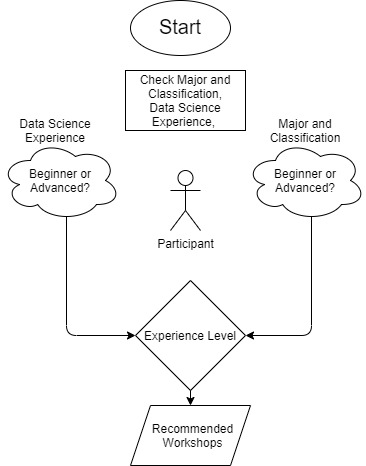
Algorithm Flowchart


Inspiration
Our inspiration came from our own experiences signing up for TAMU Datathon. We also learned that as much as 45% of the total 25.5 hours of possible working time can be dedicated to workshops and attended workshops ourselves in the hopes of it being the most informative and helpful for our specific learning objectives.
What it does
Looks at past Datathon data from participants' information to suggest the best workshops for Datathon participants of all experience levels to attend.
How we built it
We began by defining our problem based on the published TD parameters and ideas, and used the Colab notebook as a framework to guide our design process.
Looking at the data we look for trends and decided to designate groups for majors experience levels. Workshops are also distinguished by experience level. A person's experience is viewed more holistically by accounting for both their major and experience and taking the highest level of their experience, i.e. a person who had little coursework in pure data science but competed an internship in the field is not dismissed by her major.
We discuss the process and how to use the provided, utilizing Google, Zoom calls and Discord to share our ideas. We created visuals including graphs and flowcharts to accompany our program and presentation.
Challenges we ran into
The datasets were not very compatible, and we didn't have many past year's experience to draw our model around. We also had different backgrounds and skills.
Accomplishments that we're proud of
We expanded our given data collection by requesting an anonymized participant list from last year’s Datathon. We also categorized and tagged keywords from TD 2019 workshops to boost the robustness of our data sets, and hence our algorithms capability.
What we learned
We learned how to deal with some of the difficulties in extracting usable information from free text responses. We learned how to cluster data into readily-interpreted units algorithmically. We also learned how to organize our time more efficiently from the past TD winners’ presentations.
What's next for TAMU Datathon - For-You Page_1
One way to check how well this algorithm works is by comparing it to this year’s data on which participants attended which workshops. We hope to see our algorithm being used by TD organizers to improve participant workshop satisfaction/experience. If our algorithm were implemented into TD’s future “For-You” page, we would expect to see participants make better decisions regarding which workshops will help them the most, as well as a better overall experience of Datathon.

Log in or sign up for Devpost to join the conversation.