-
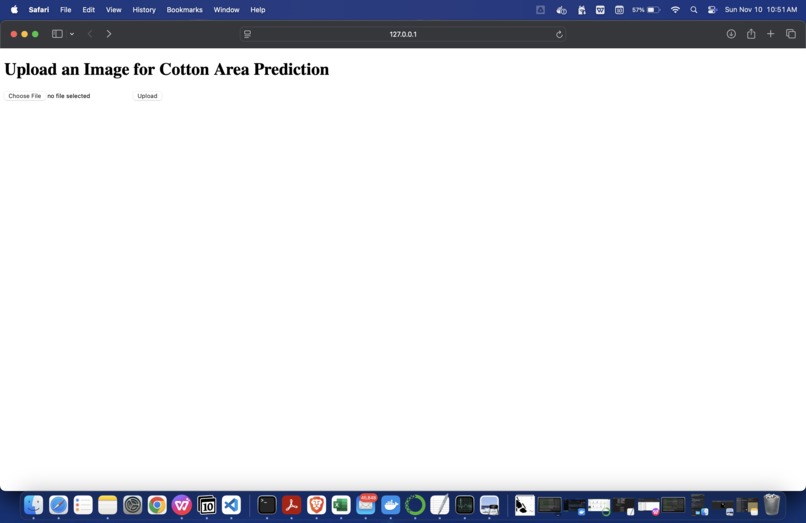
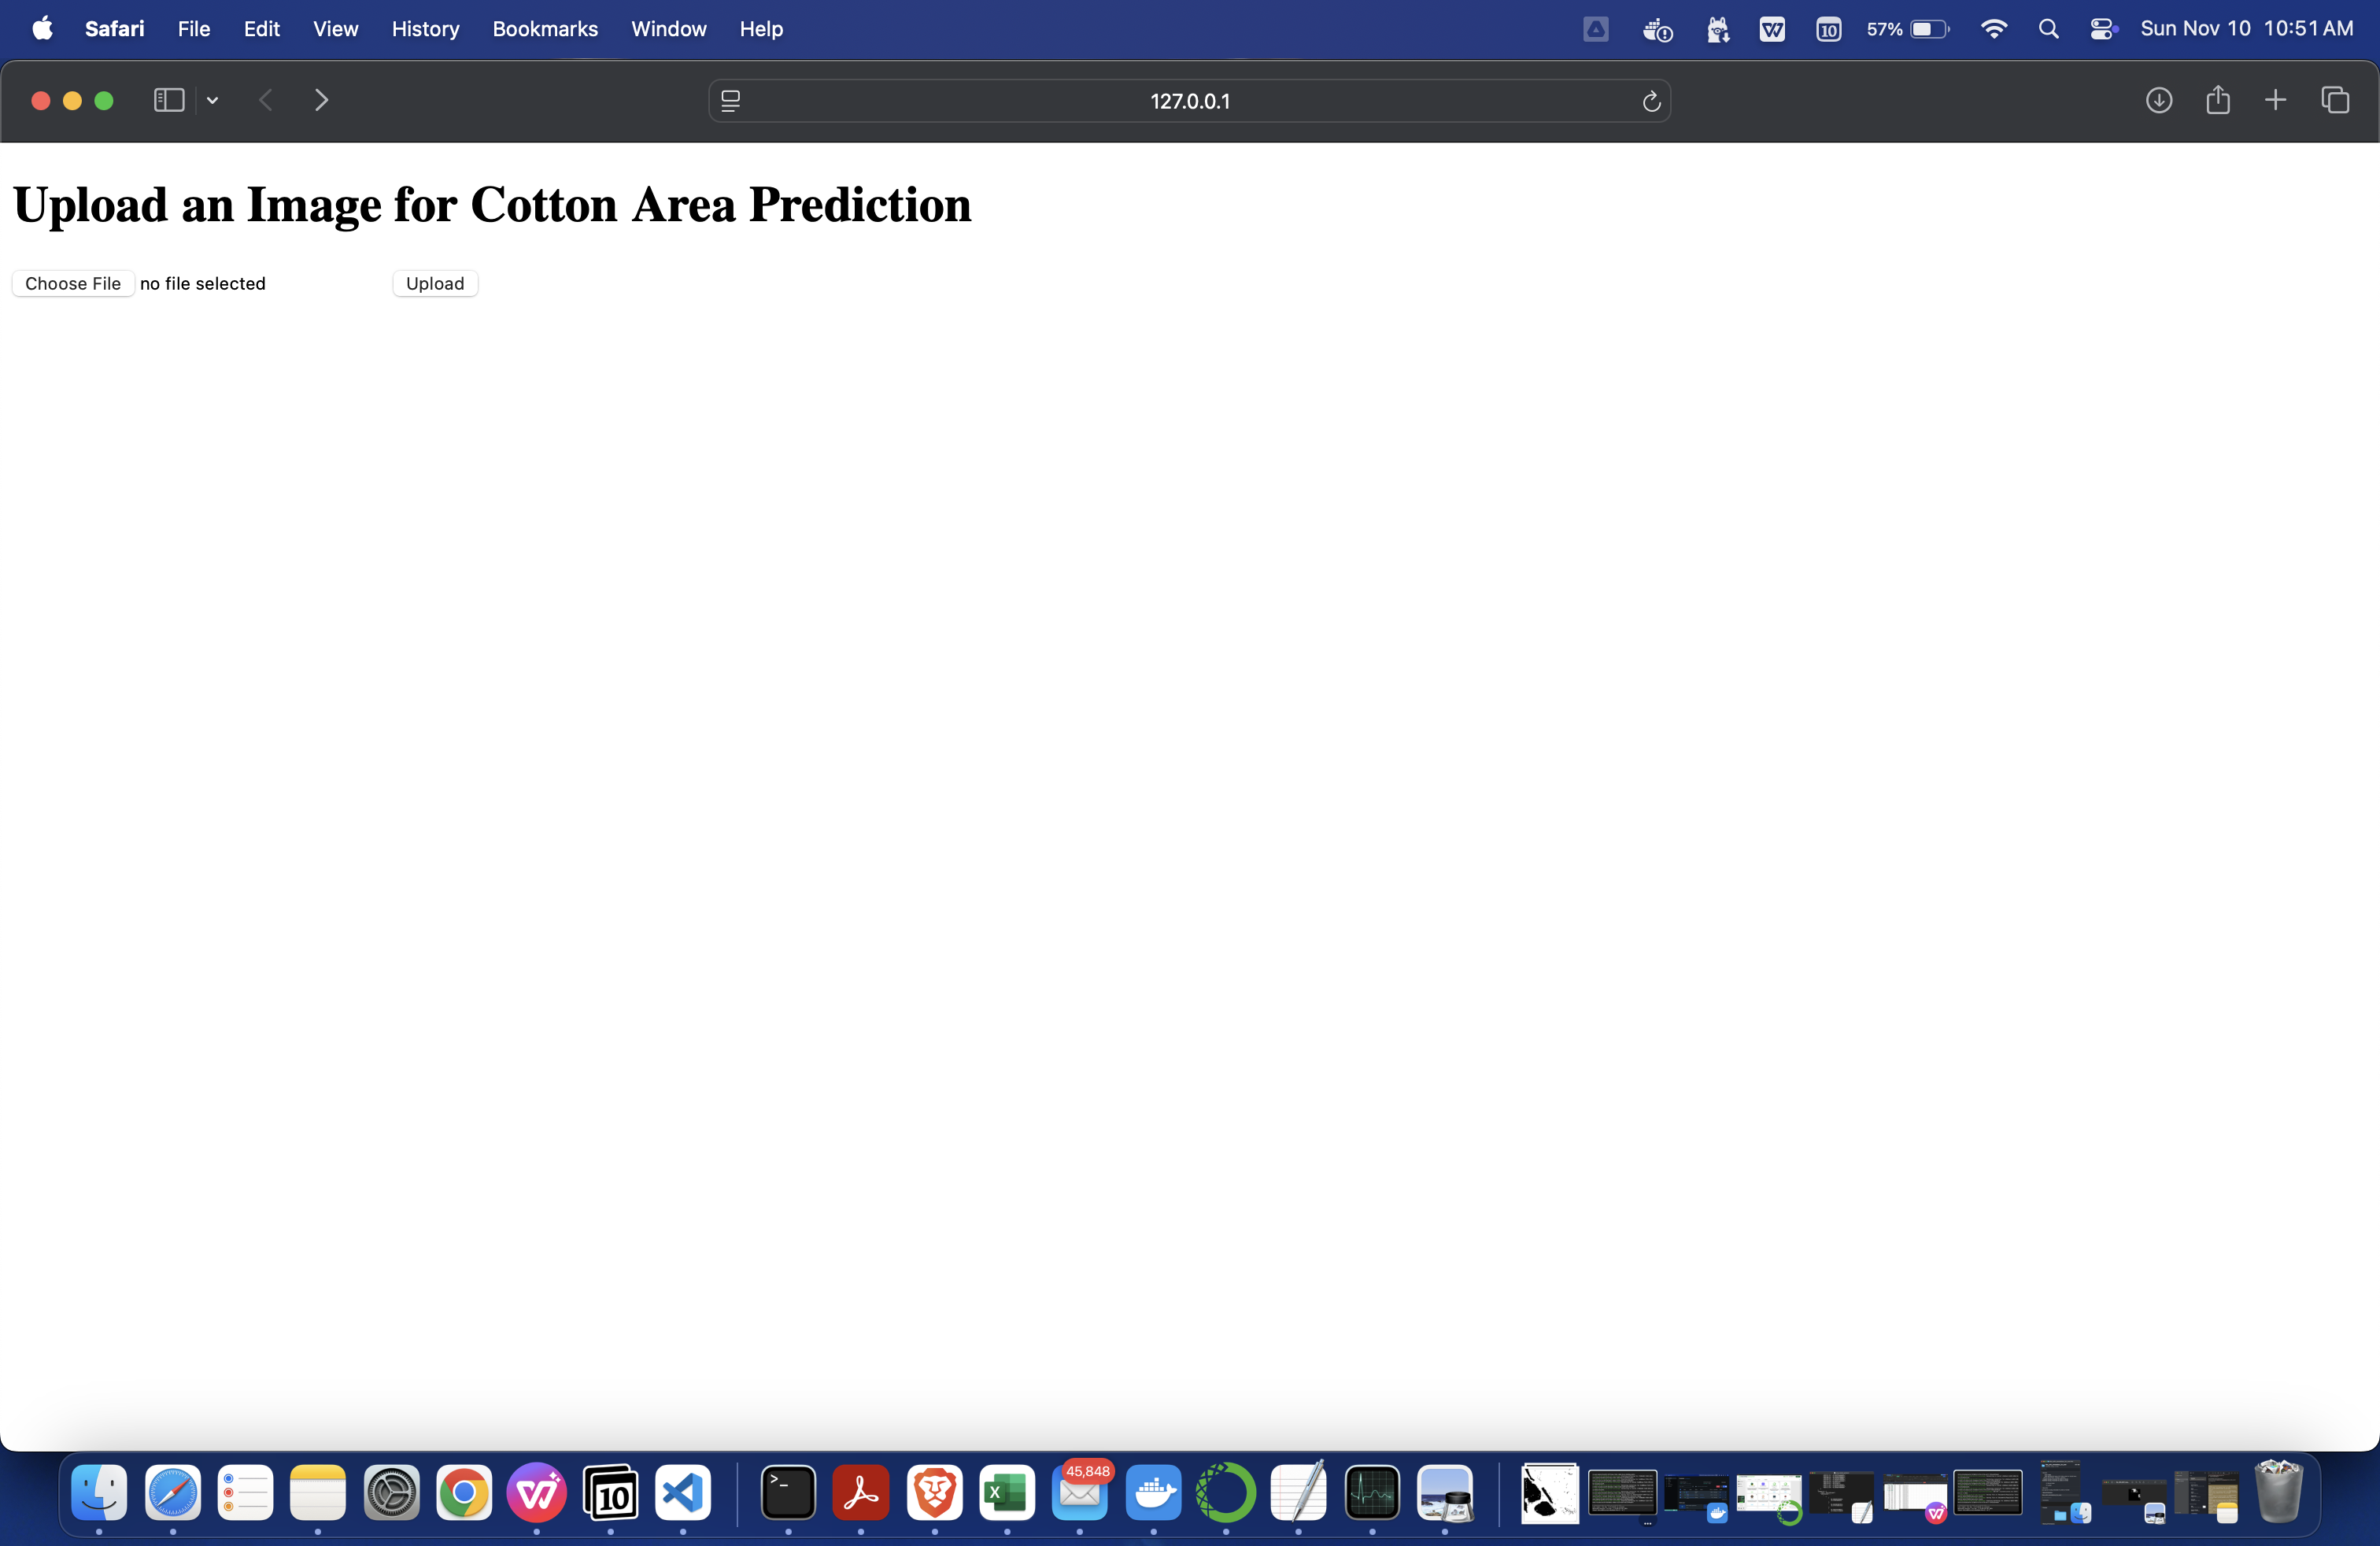
image uploader
-
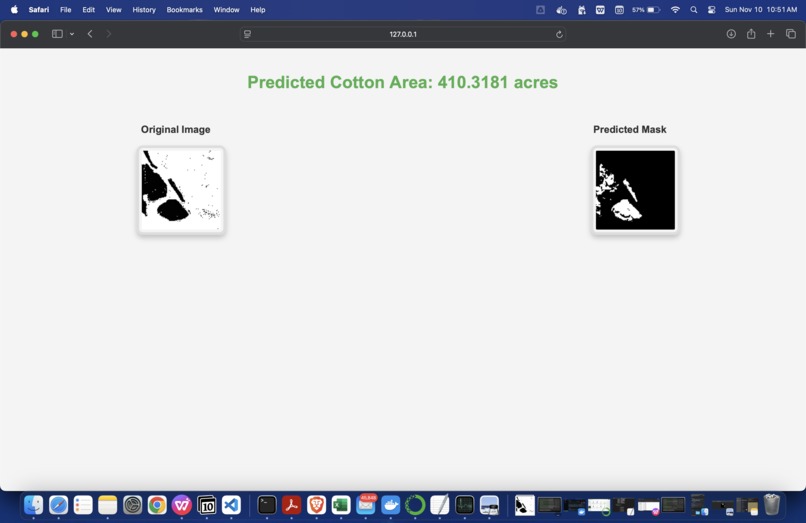
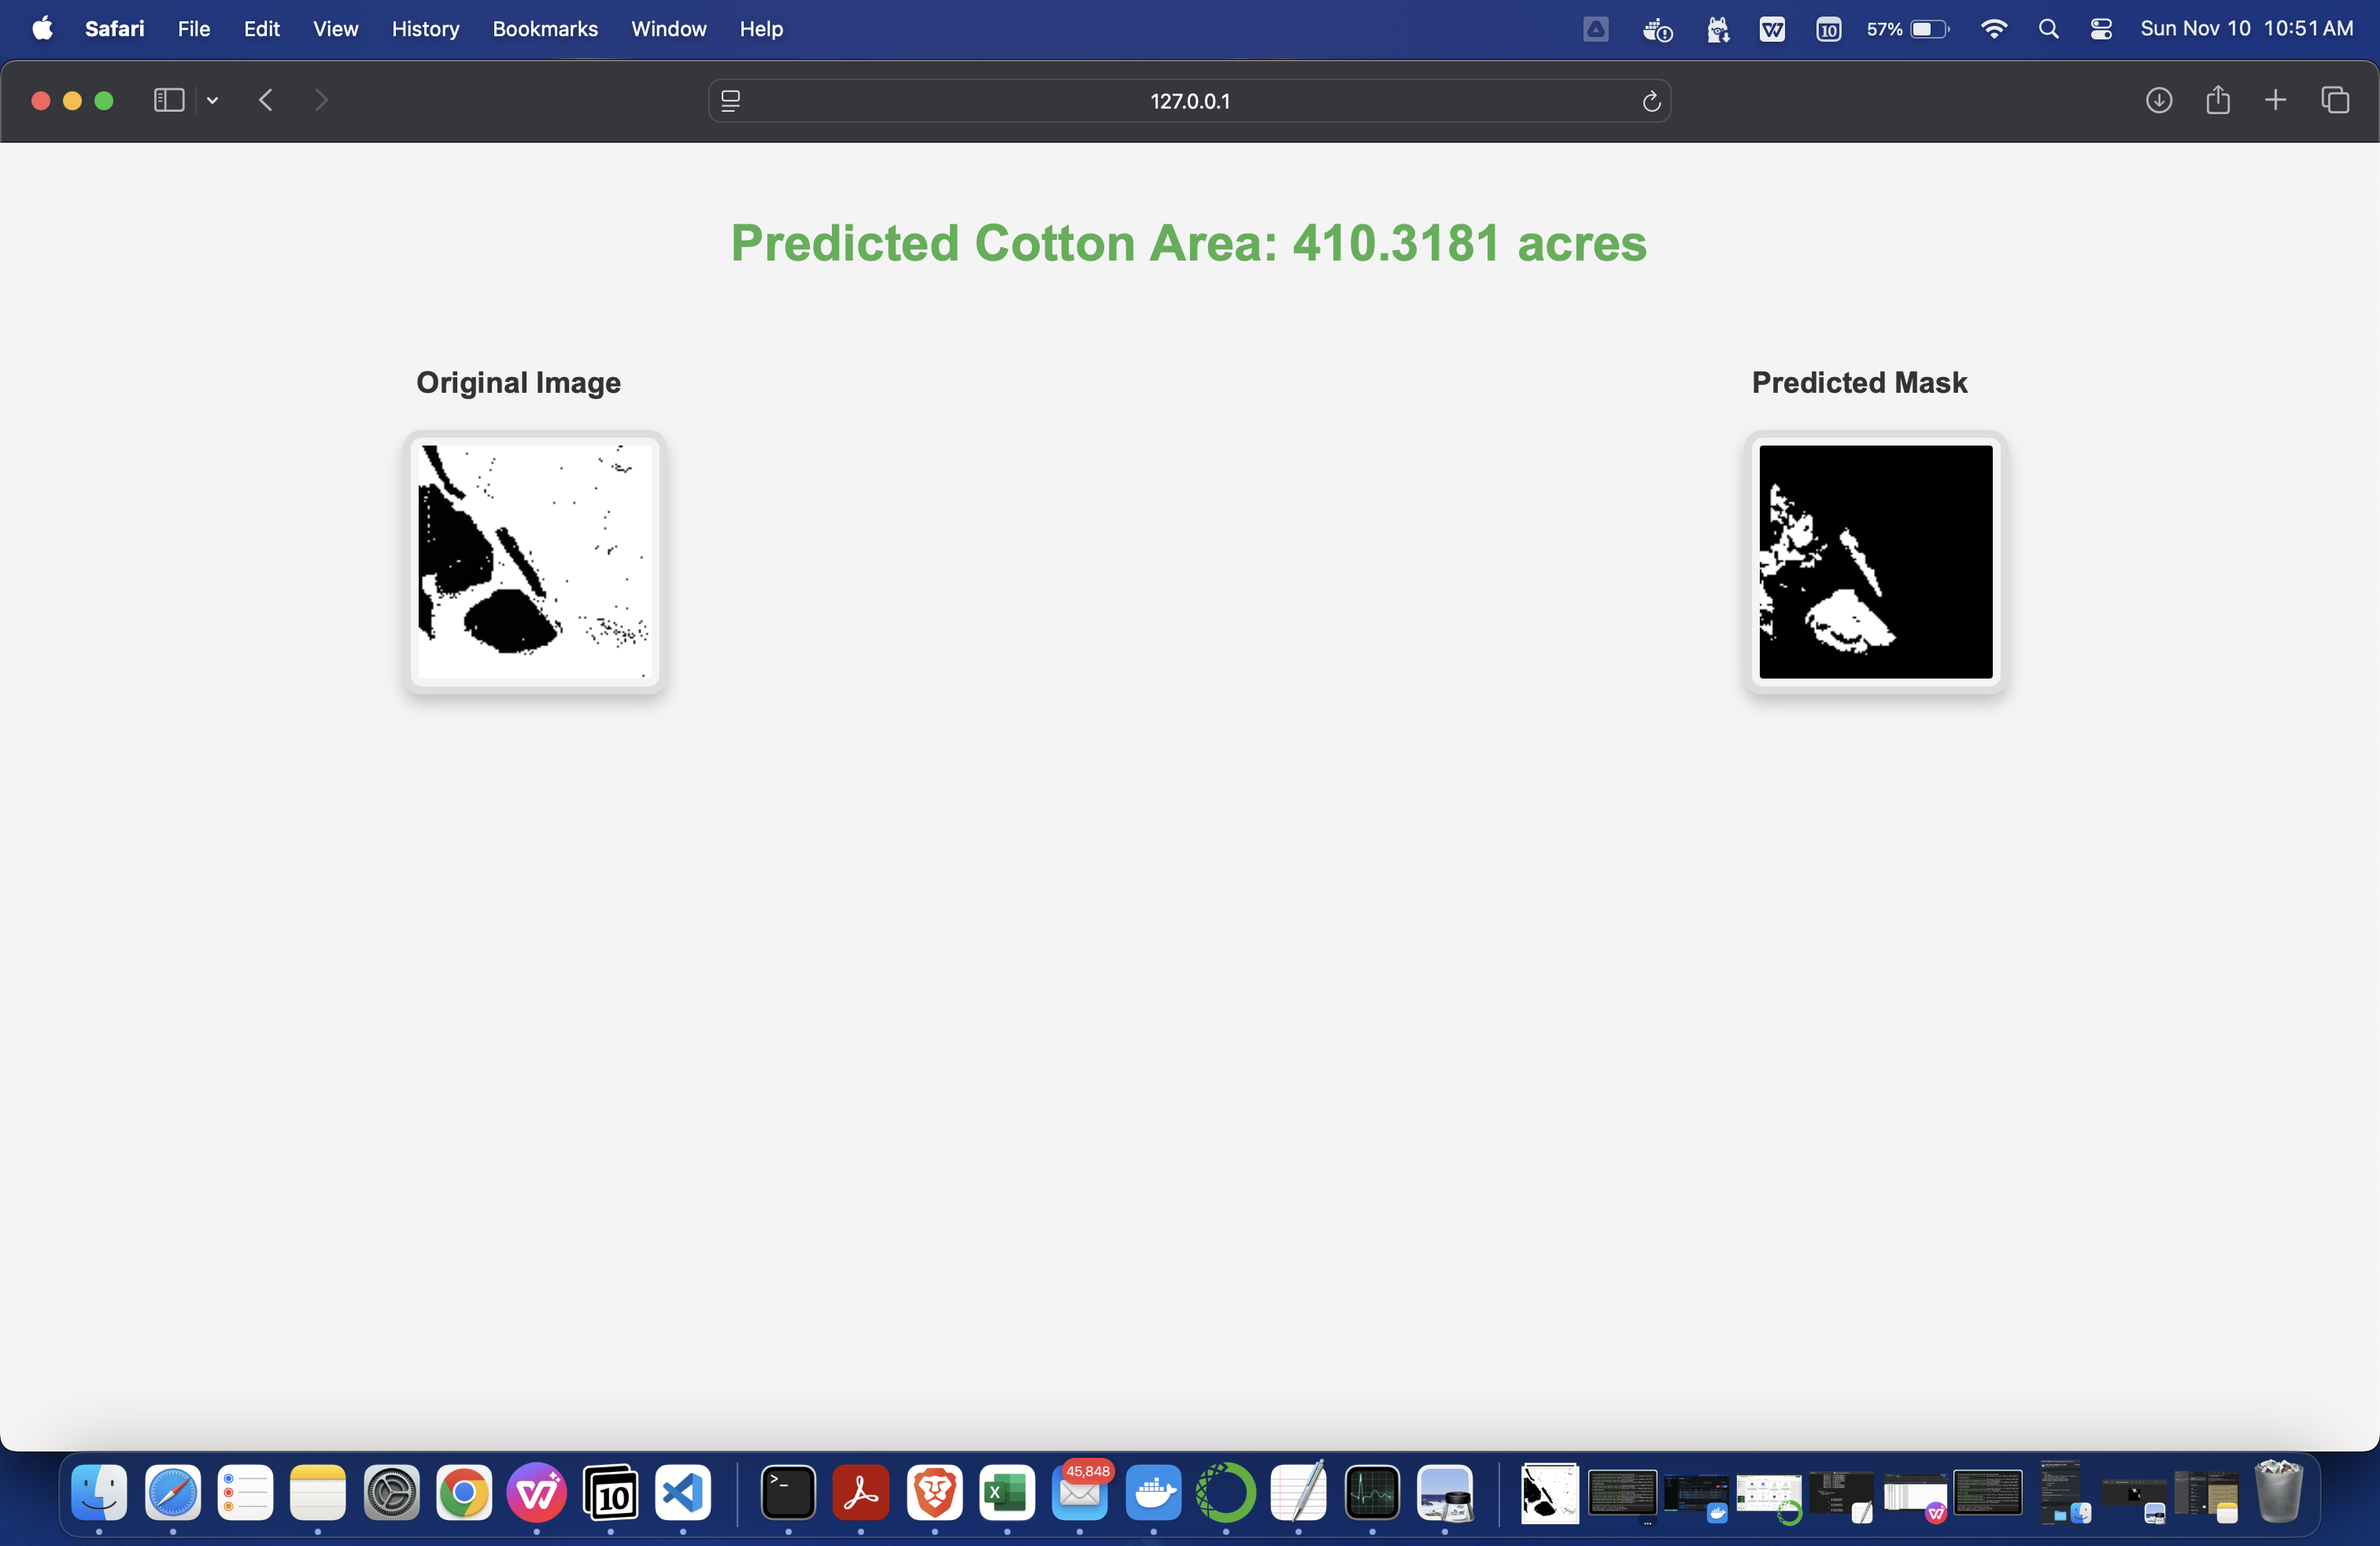
Predicted mask image for cotton and the crop covered area
-
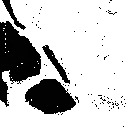
original grayscale image
-
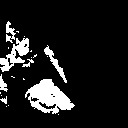
predicted mask image
-
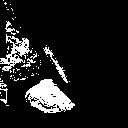
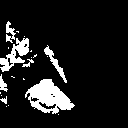
Ground Truth mask image
-
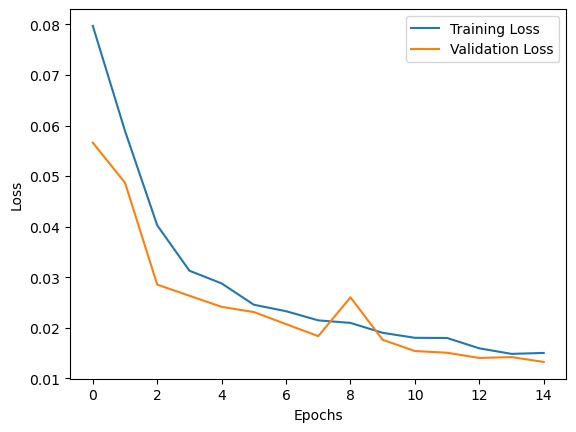
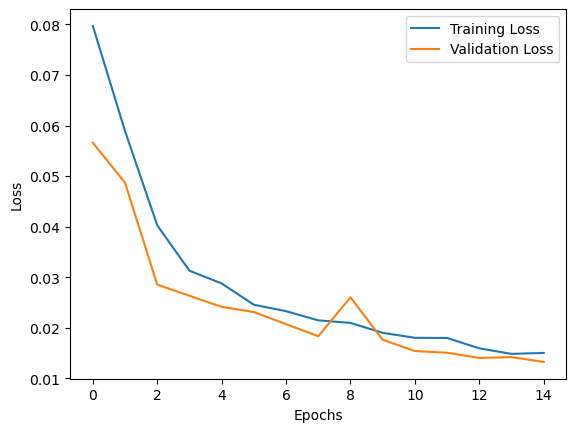
Loss Graphs
-
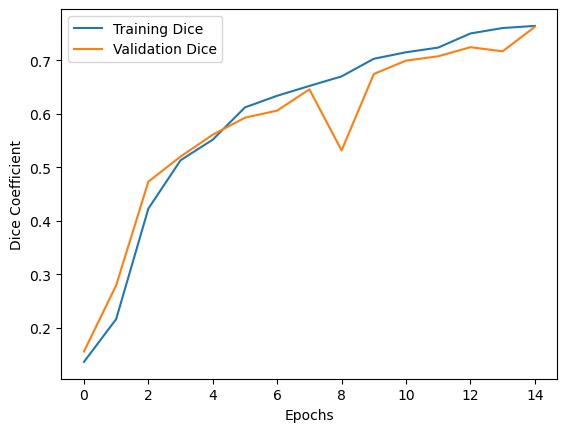
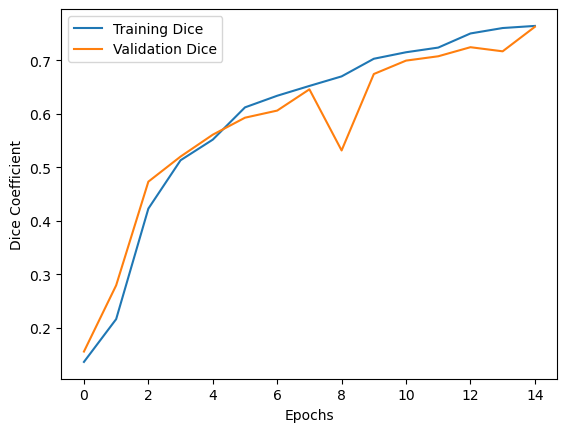
Dice Coefficient Graphs


Inspiration
What it does
In this challenge, we aimed to develop an end to end pipeline for automated cotton crop classification from satellite imagery using models based on semantic segmentation. We utilised the Cropland Data Layer Dataset available on Google Earth Engine to develop our models. This document shall describe a brief description of the dataset, methodology used, model training and validation.
How we built it
We started off with a huge tif file having coverage for the entire country.We then supplied windows of 128x128 with no overlap and created grayscale regions having white color annotated to cotton(as per the google engine annotations).We then made a Unet model and sent our training images to the model.The model was trained and we obtained a test image with annotations for it based on the model training.We then used mathematics to obtain acreage.
Challenges we ran into
- We spent a significant amount of our time in developing the dataset from the raster image. To accomplish this, we decided to divide our image into multiple tiles, using a sliding window, that iteratively saved TIF images of 128*128 from the raster file.
- Since our images were single channel we needed to obtain the data for cotton using the corresponding pixel values of (2,2,2), since the data was a grey-scale image.For our semantic segmentation model we needed the corresponding images and masks. The images were extracted as TIF files. To create the masks, we set all pixels that were (2,2,2) (corresponding to cotton) to (255,255,255) (white). All the other pixels were set to (0,0,0) (black). We ran this iteratively over our dataset, creating a directory containing the images and masks.
- At the start of our model development we decided to classify the presence of cotton using a Convolutional Neural Network. During this approach we decided to assign a % value to the amount of cotton present in each image, such as 10% cotton, 20% cotton and so on. However we faced 2 issues with this approach. Firstly since our tile size of 128*128 wasn’t small enough to create a window that accurately captured one type of crop completely, we were getting multiple crops in a single image along with cotton. Secondly certain classes such as Corn were highly overrepresented creating a dataset imbalance. This caused overfitting of our CNN model, which displayed 99% accuracy on the training set and 53% on the test set.Hence we decided to switch to semantic segmentation using the U-NET. This allowed us to identify regions of cotton within each tile, regardless of the other crops present. U-Net can therefore generate masks that highlight only the cotton areas, giving a more detailed analysis than the original classification model
- As part of the challenge we needed to calculate the amount of cotton present in every image. For this we first calculated that our original tile represented 30m^2 per pixel. Then we applied our semantic model to our images and calculated the ratio of white pixels to black pixels, in order to obtain the area cotton covers in a single tile.
Accomplishments that we're proud of
We were able to successfully obtain the acreage of cotton fields using our model.We were also able to identify regions where cotton fields were present and print them to the screen.
What we learned
A great deal about Data Preprocessing,Cleaning and Model Hyperparamters

Log in or sign up for Devpost to join the conversation.