-
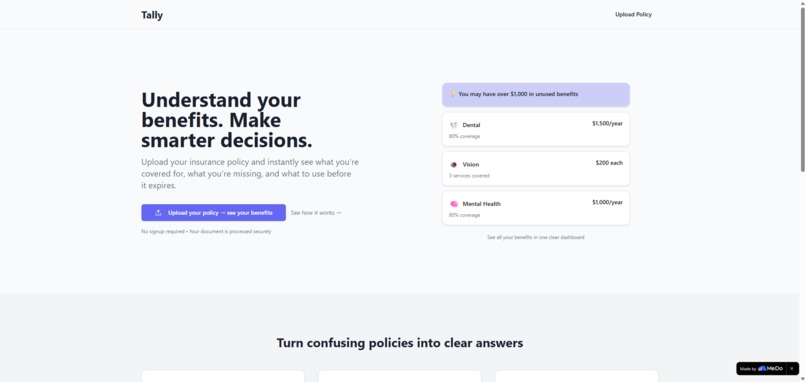
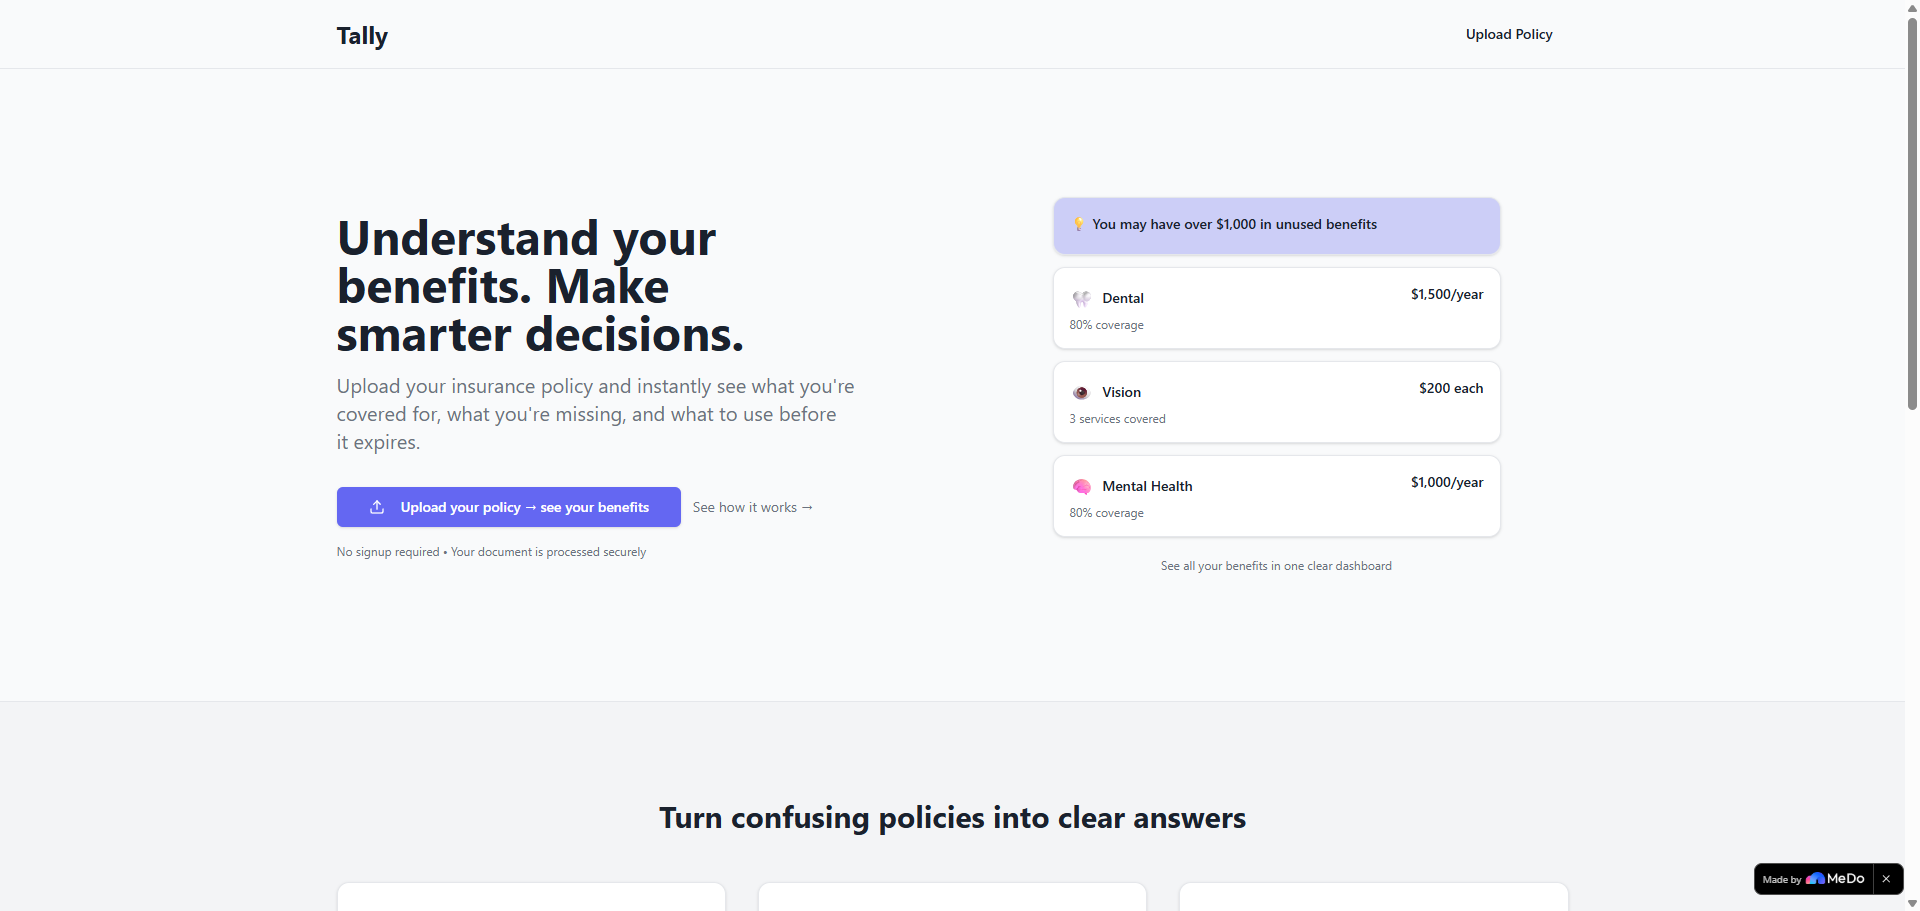
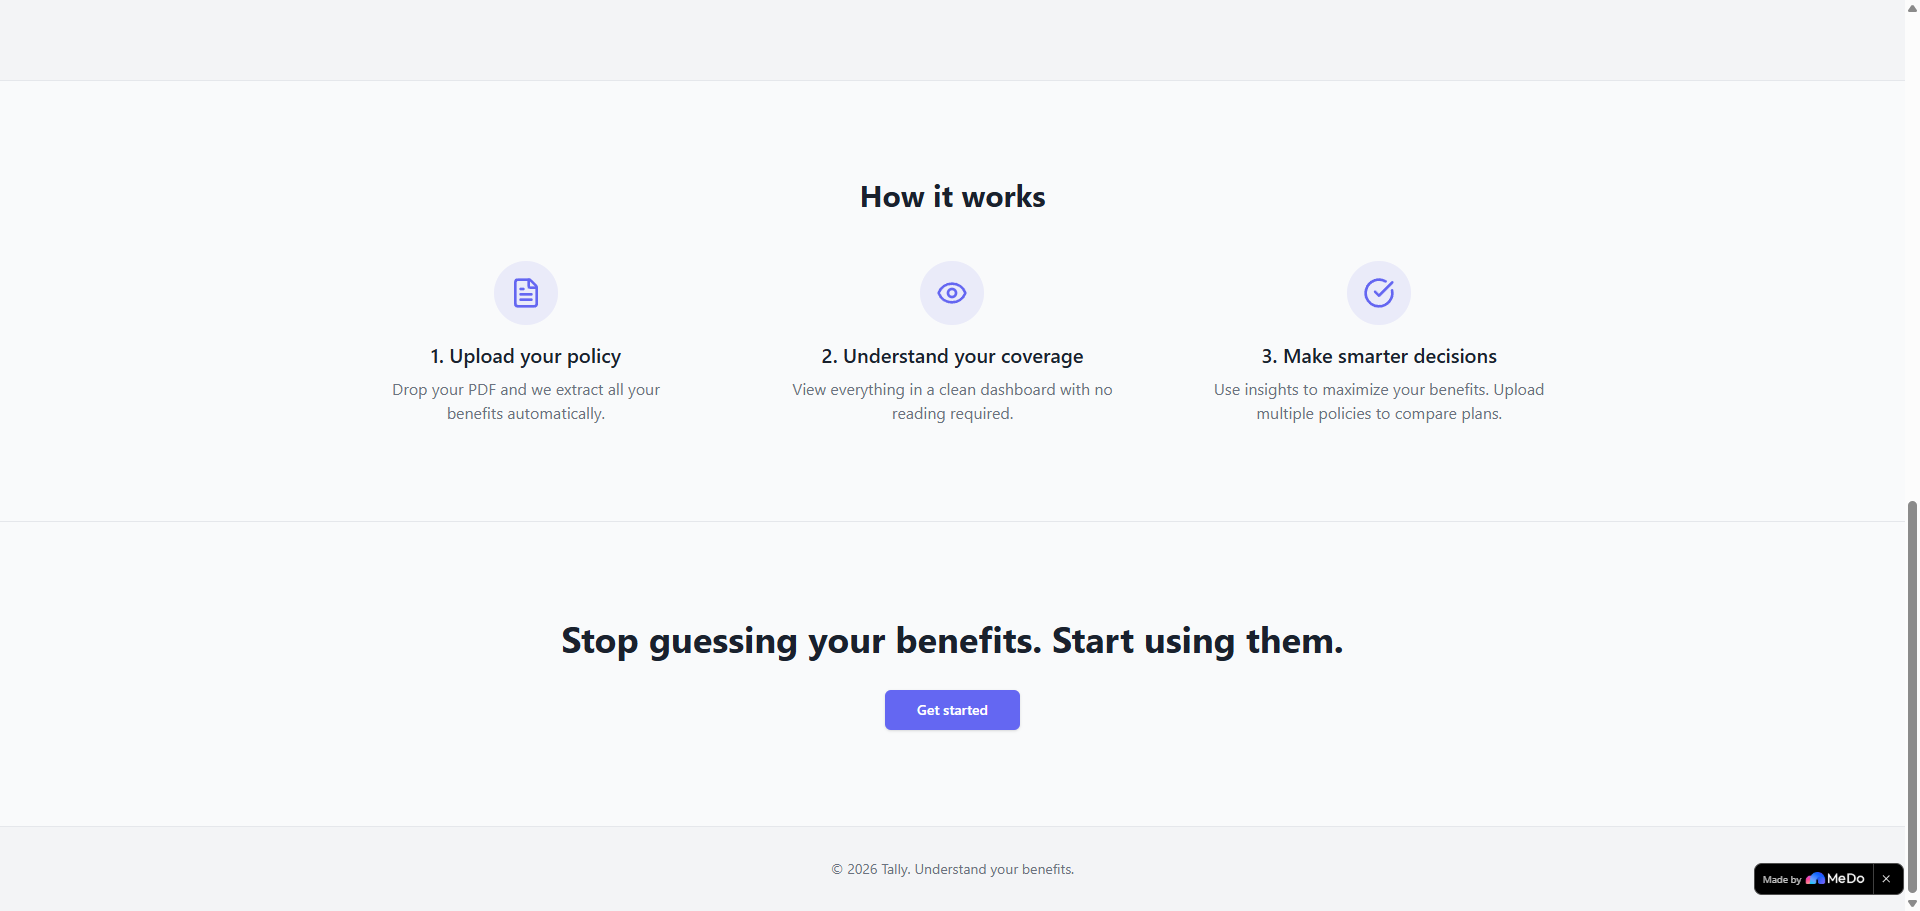
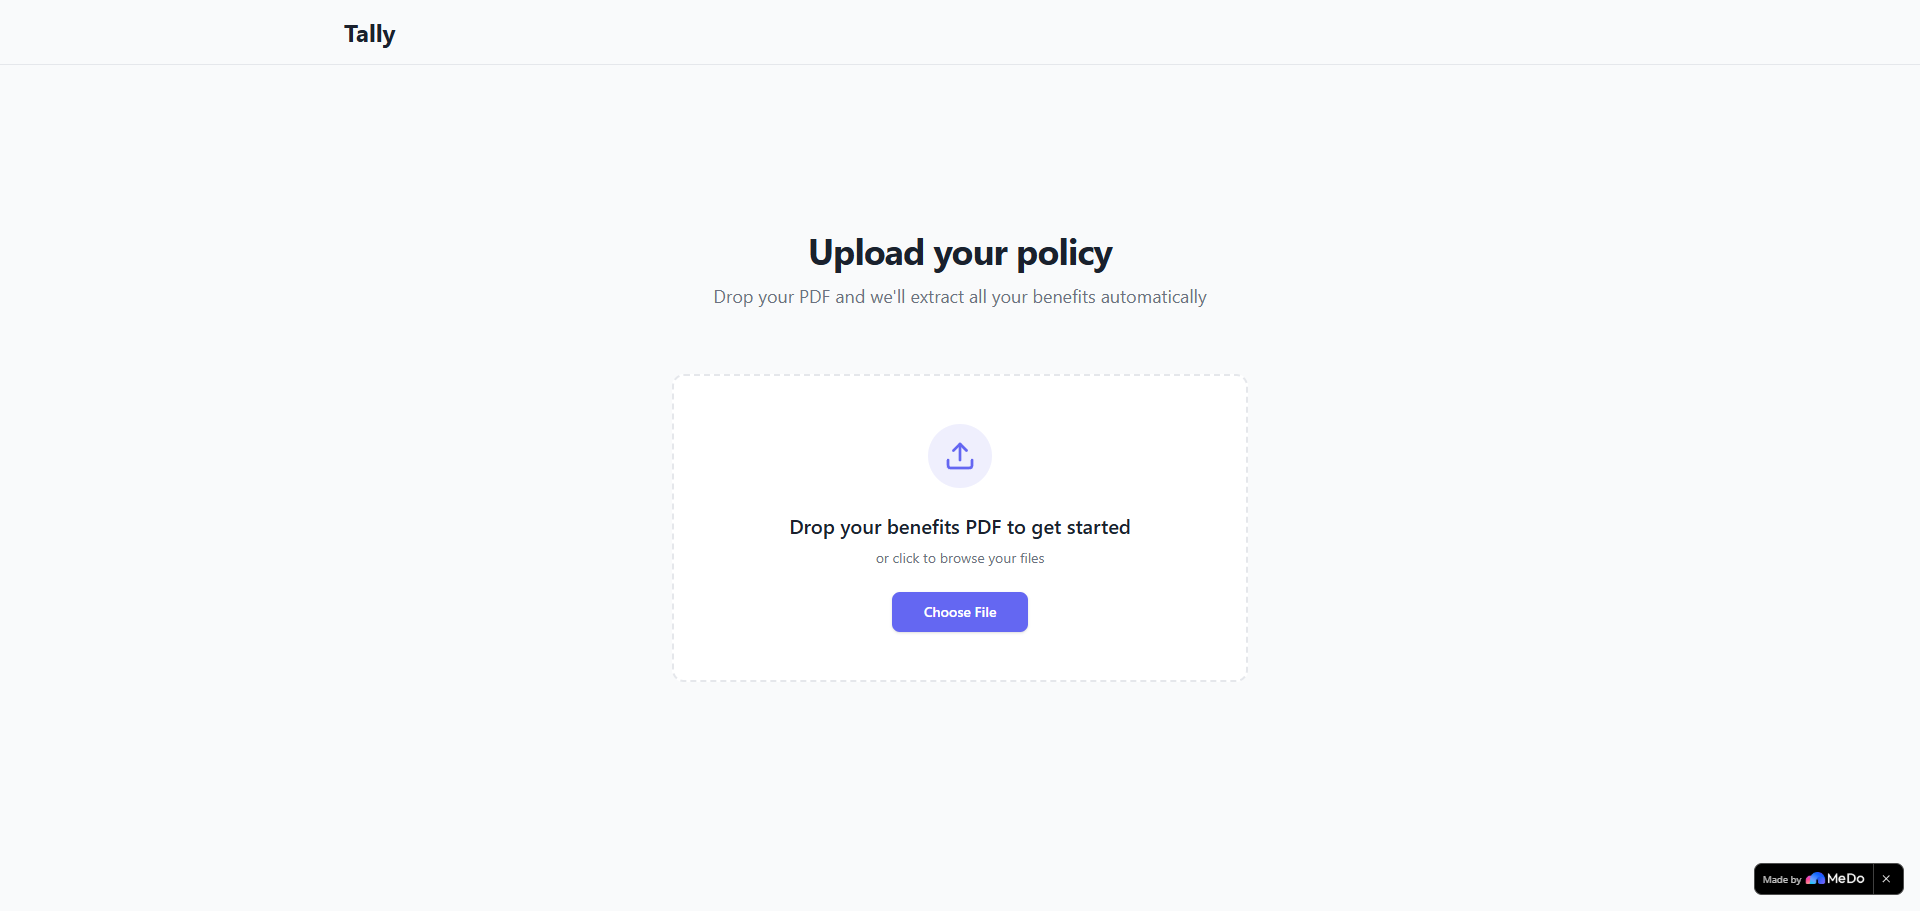
Landing Page
-
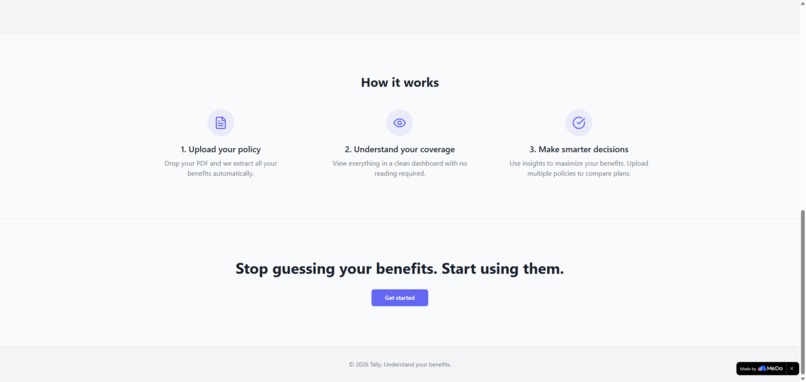
Landing Page
-
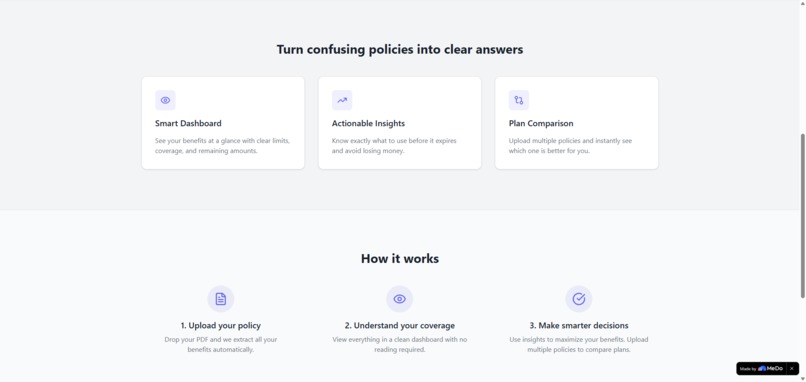
Landing Page
-
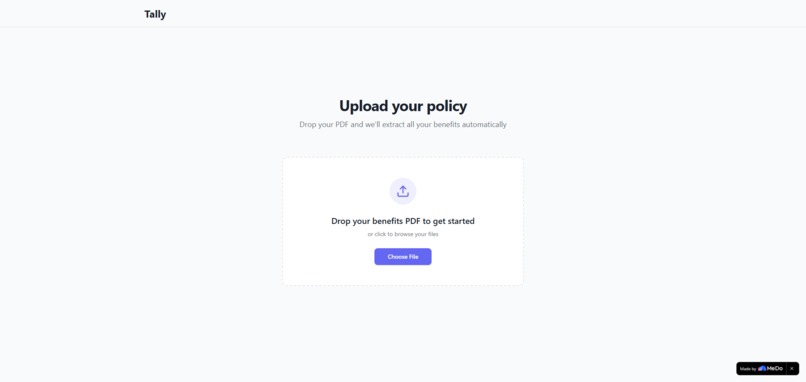
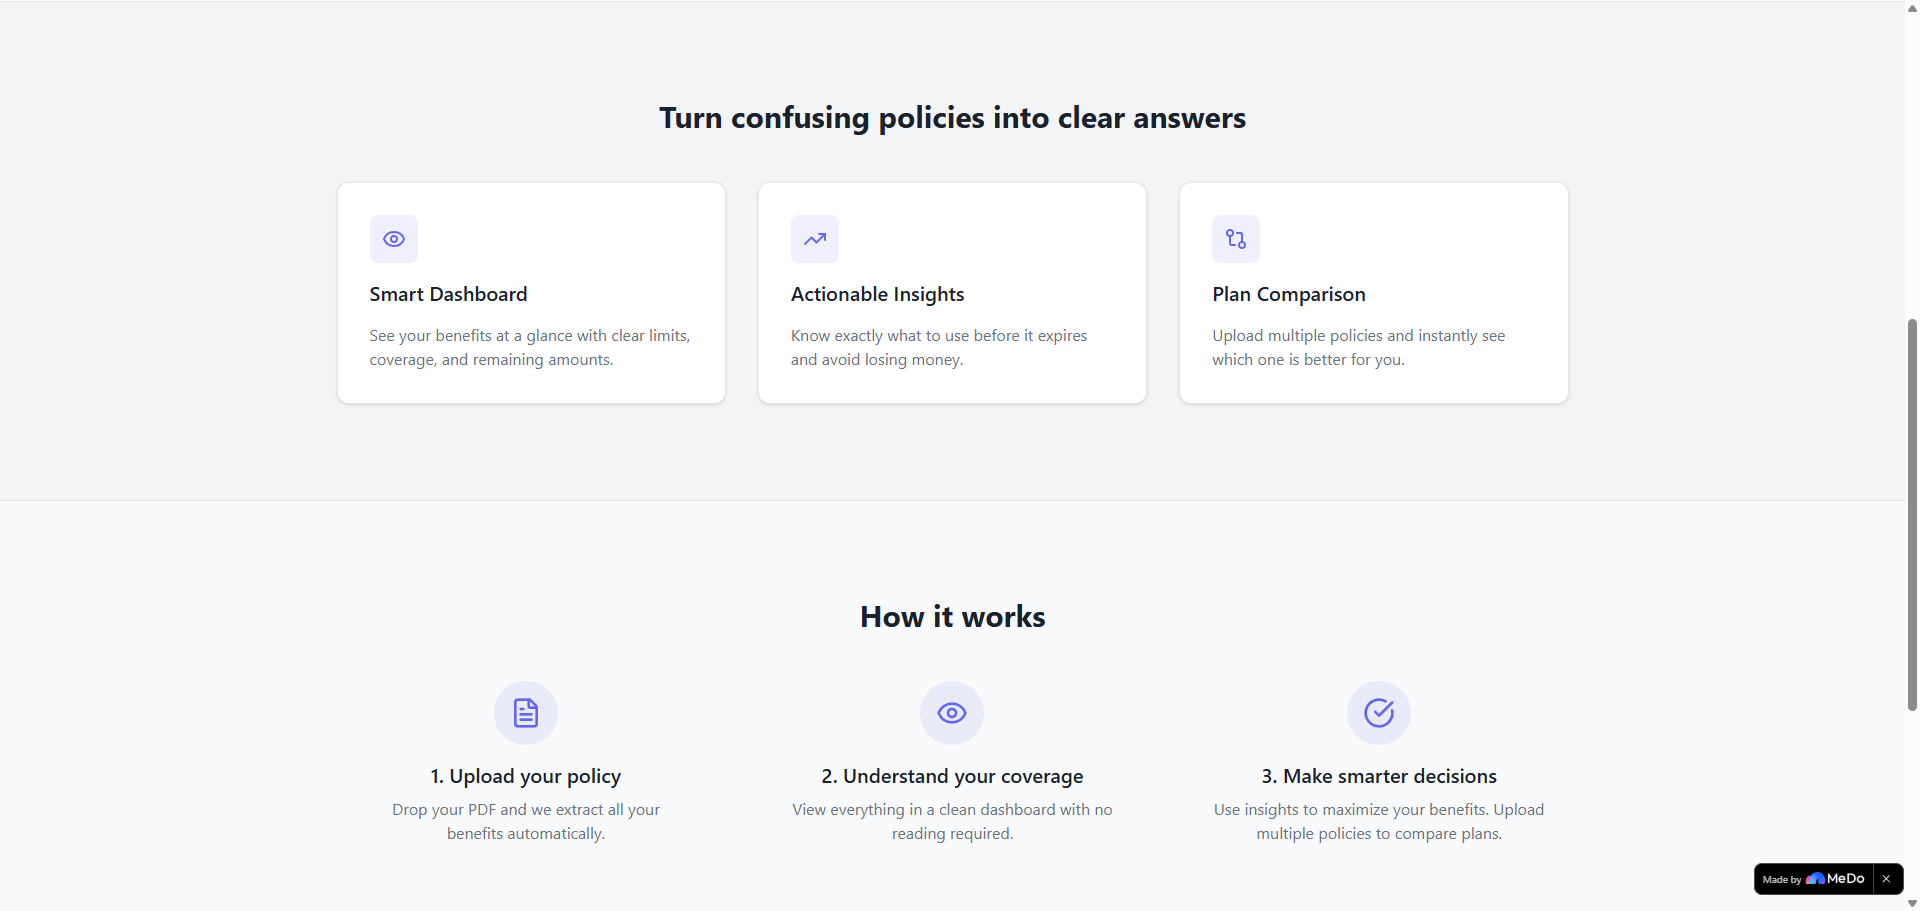
Upload Policy Page
-
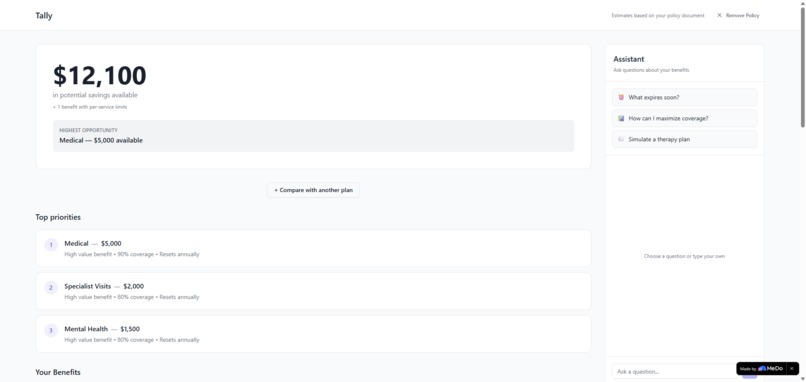
Dashboard
-
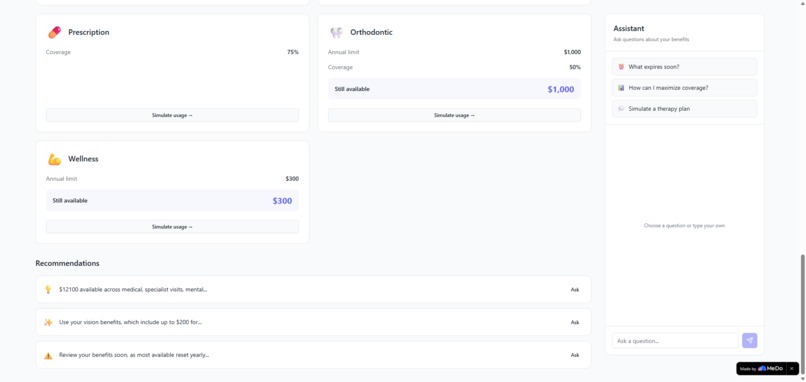
Dashboard
-
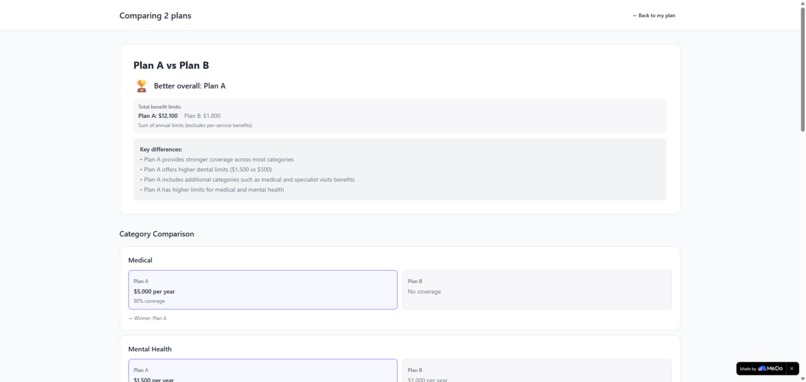
Comparison
-
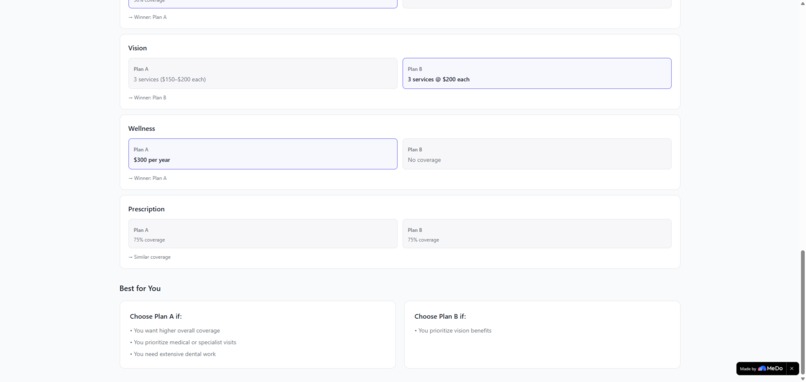
Comparison
Inspiration
Understanding insurance policies is unnecessarily hard. Most people don’t know what they’re actually covered for, what benefits they haven’t used, or what they should prioritize before they expire.
I wanted to build something that removes that friction. Instead of reading a PDF, you just upload it and immediately understand what you have and what you should actually use.
What it does
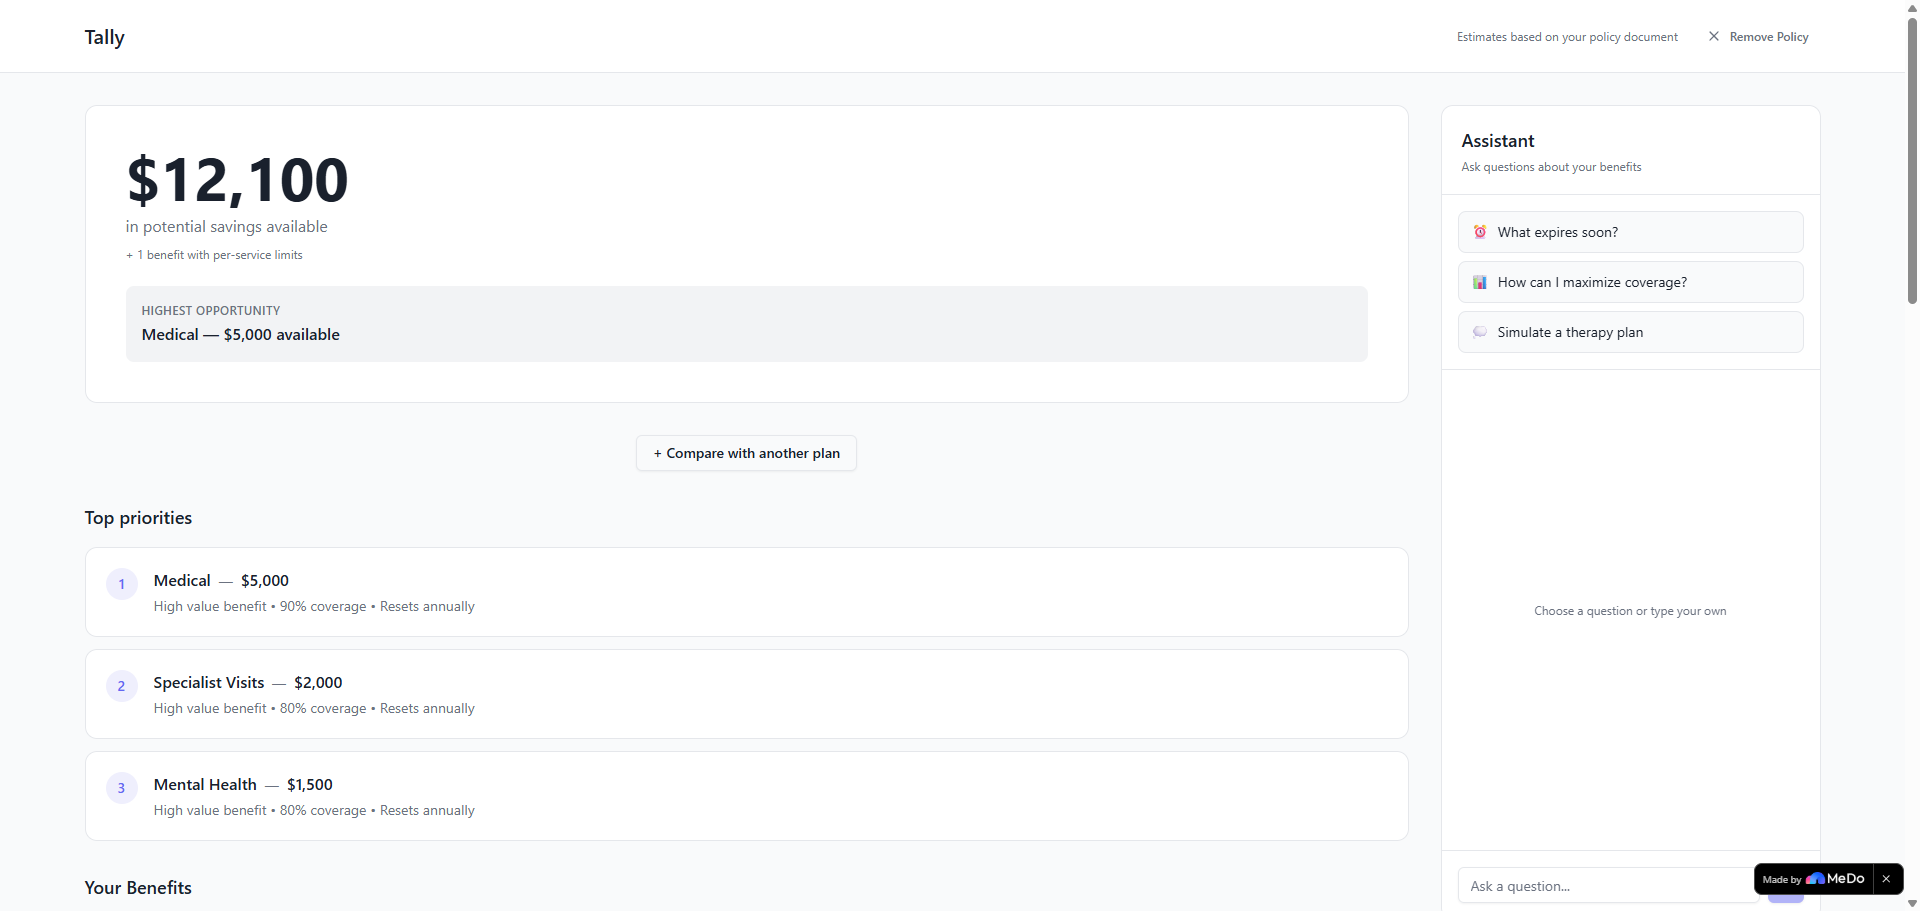
Tally takes a benefits or insurance PDF and turns it into something you can actually use.
After uploading a document, you get:
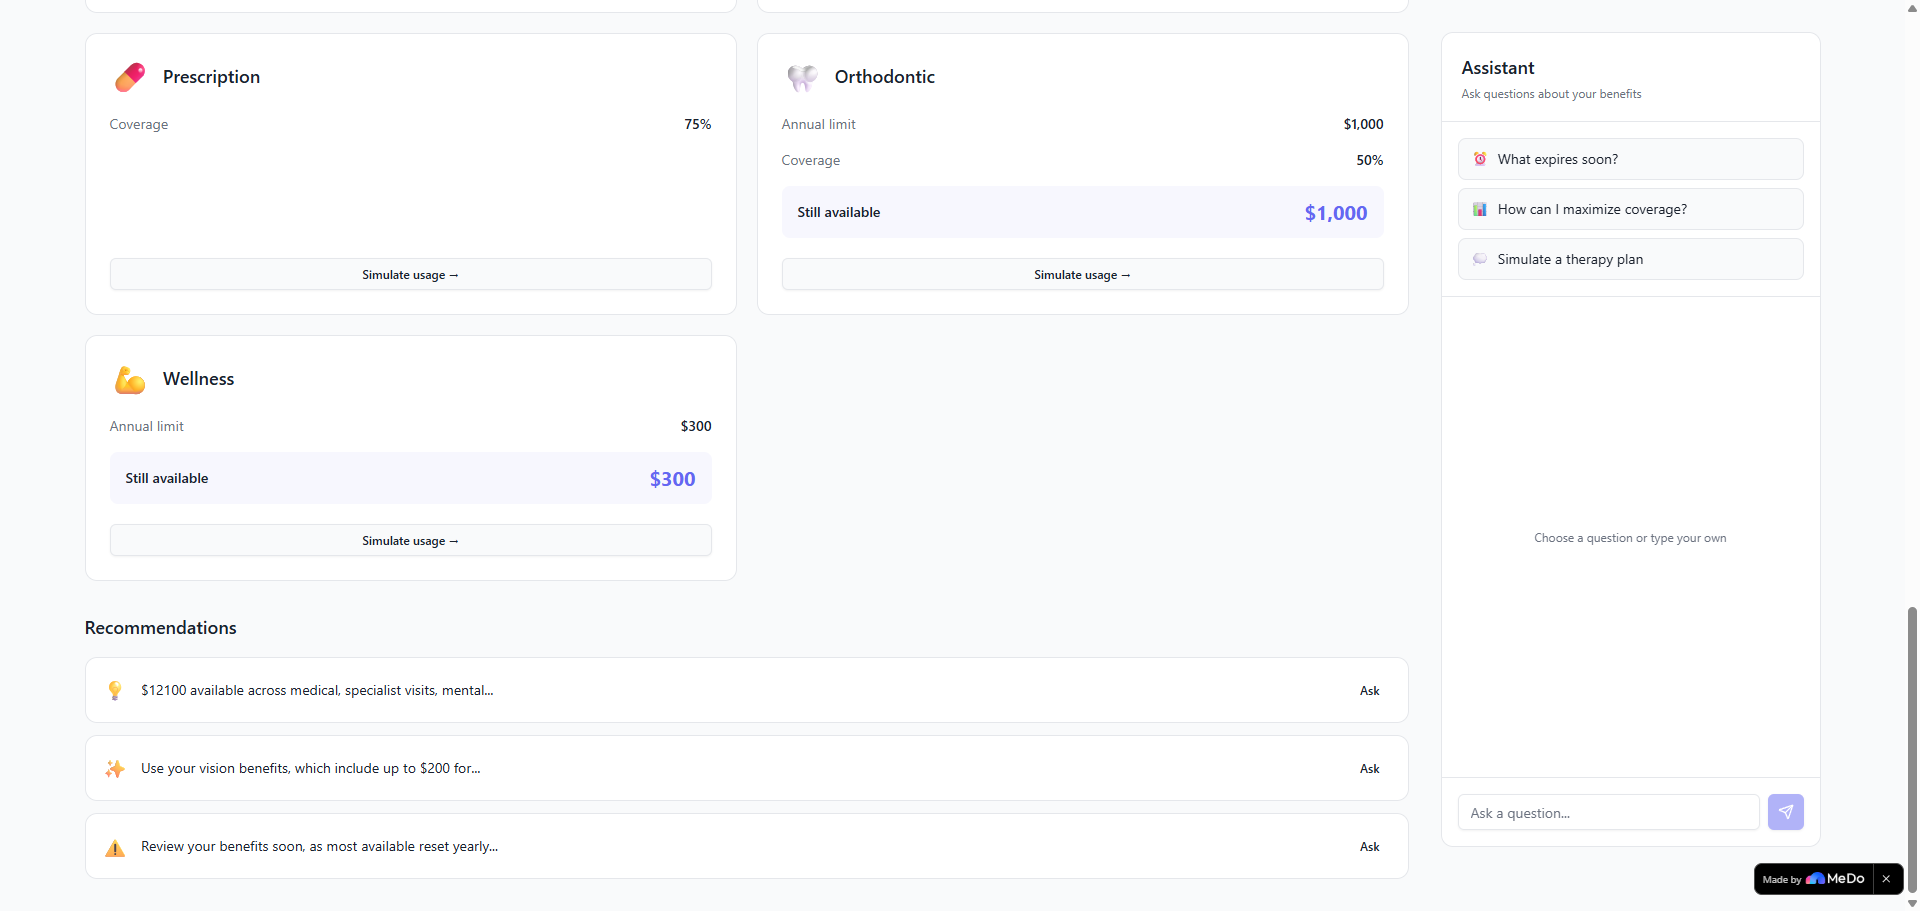
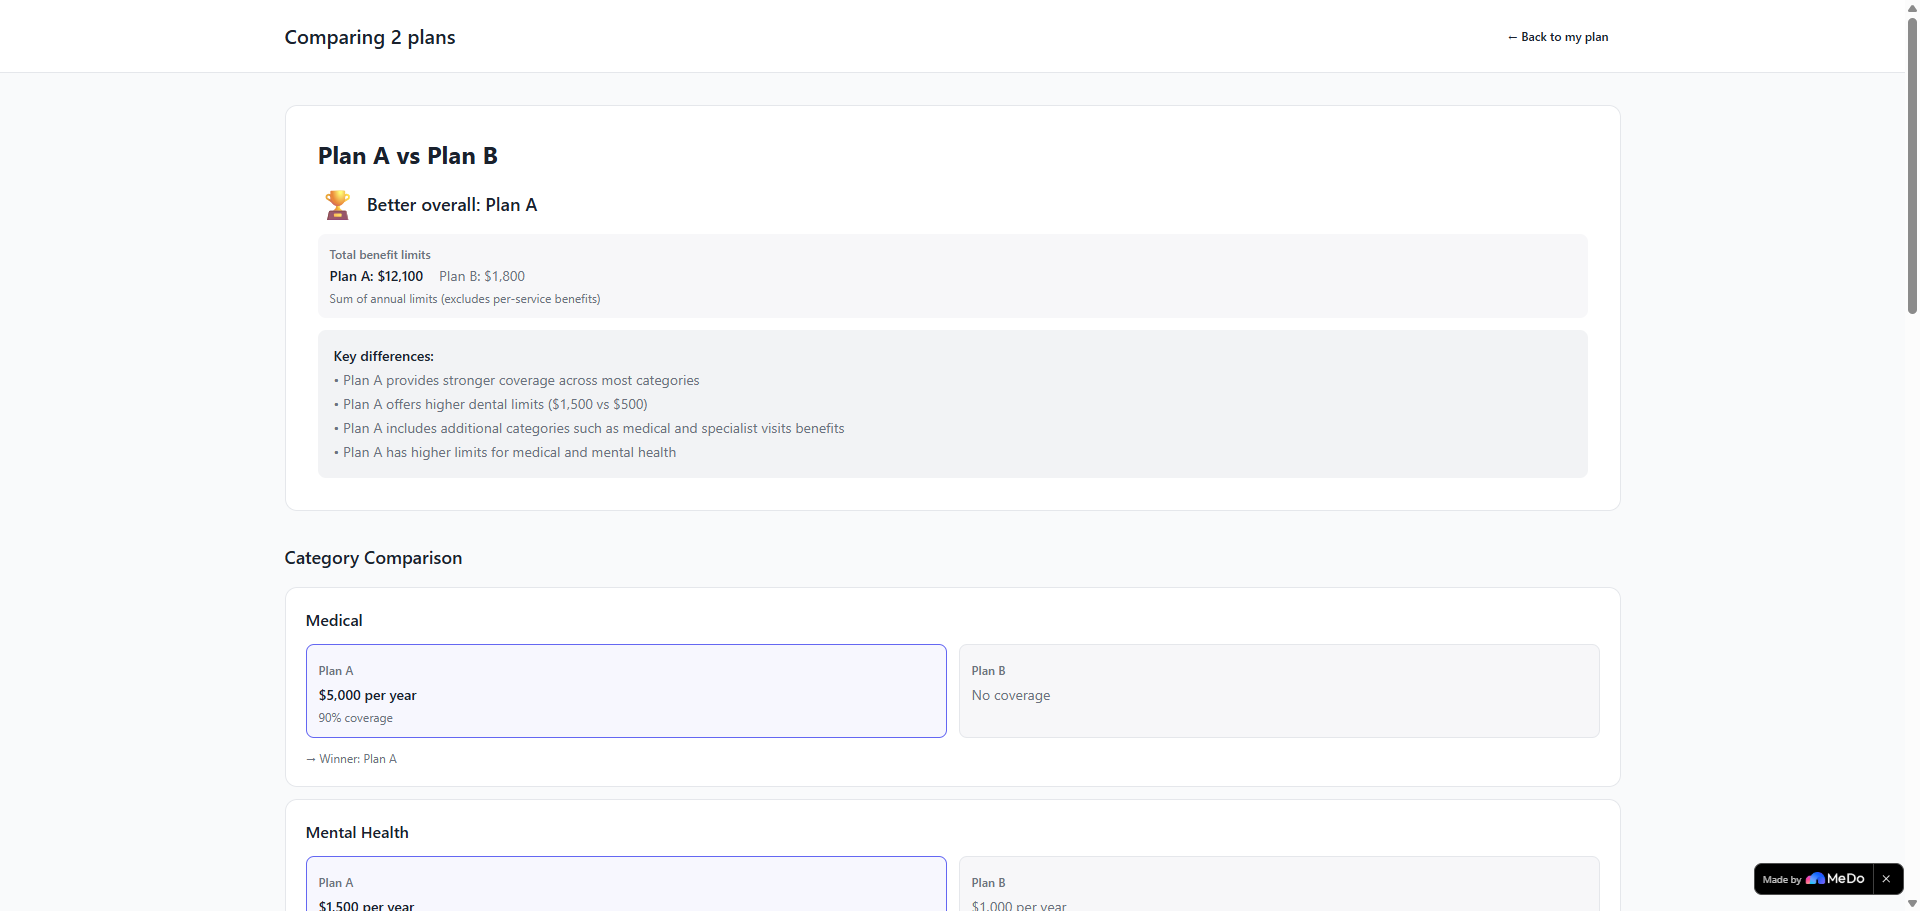
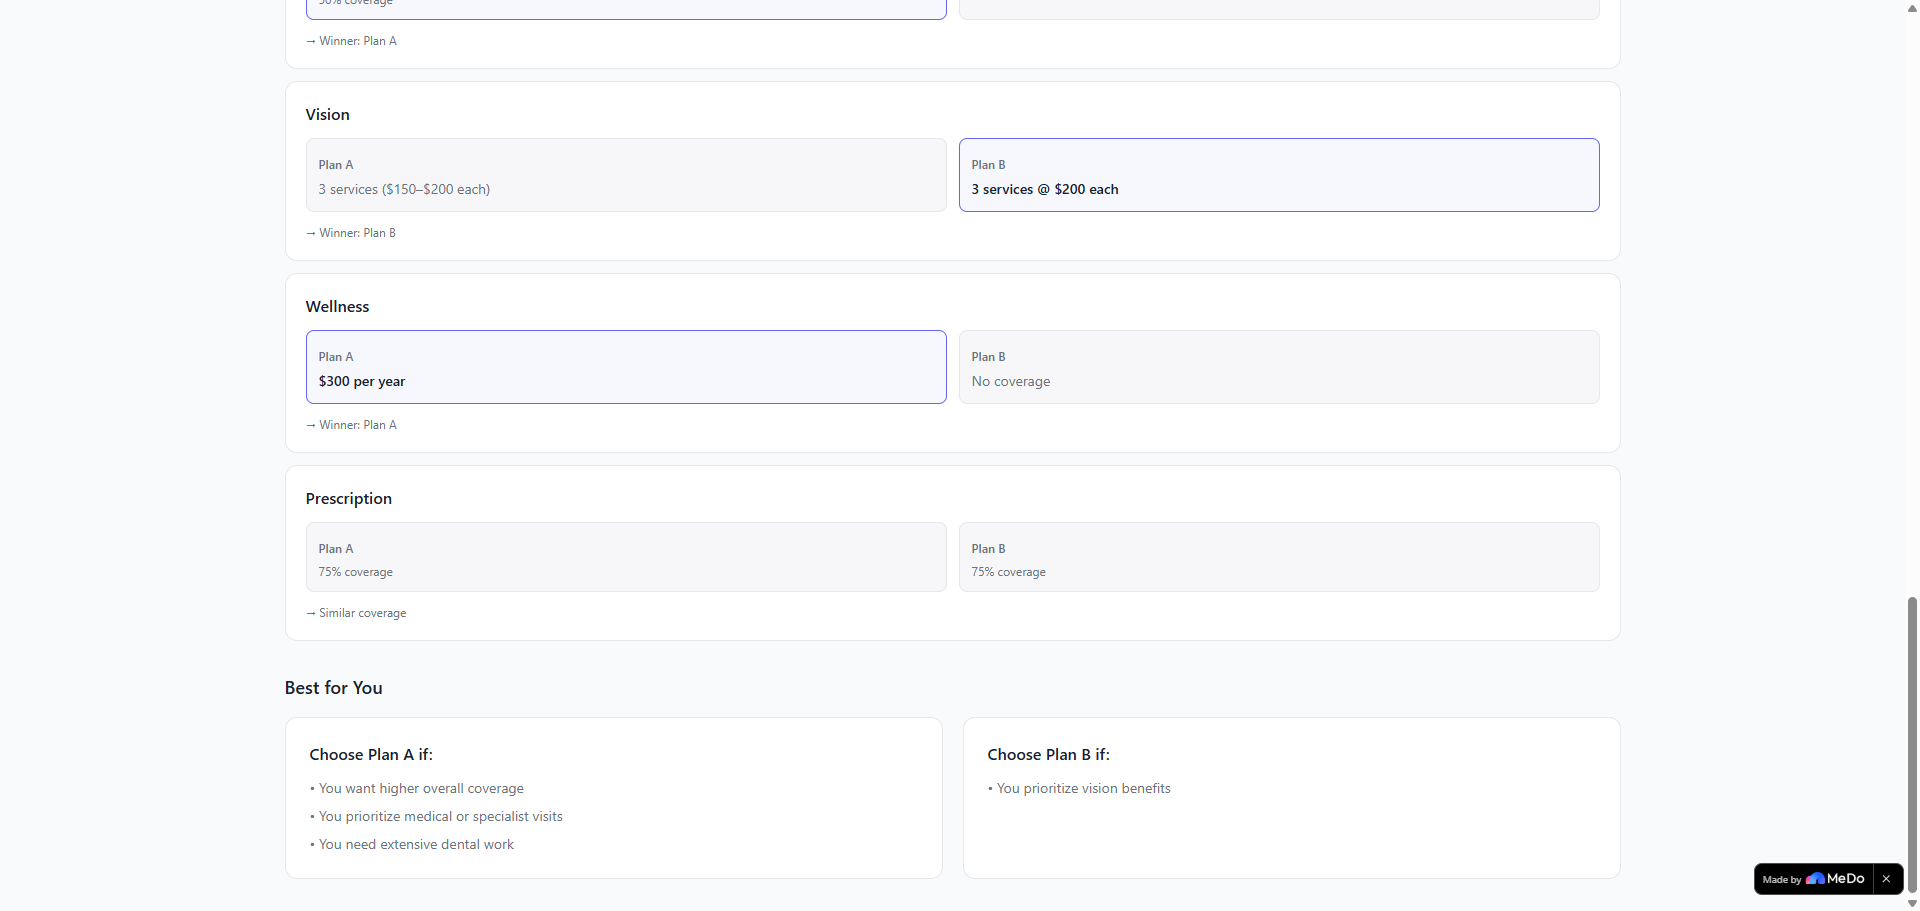
A simple dashboard with all your benefits A clear view of how much you could still use A “what should I use first” section to prioritize high-value benefits A comparison view to evaluate two plans side by side
The goal isn’t just to explain the policy, but to help you make decisions.
How we built it
The core of the app is turning messy PDF data into something structured.
Extracted text from PDFs (including messy layouts and tables) Used AI (Groq API) to help interpret and structure the content Normalized everything into a consistent format (limits, coverage, categories) Built logic to calculate totals and rank benefits by value Designed a UI that focuses on clarity instead of overwhelming the user
I also added a comparison feature that evaluates two policies using the same structure, so the results are consistent and easier to understand.
Challenges we ran into
PDF inconsistency No two policies are the same. Some have tables, others are messy text. The app normalizes everything into a consistent internal format.
Incorrect calculations At one point, uploading the same PDF would give different totals. This forced me to tighten the logic and make calculations deterministic.
Misleading comparisons At first, the comparisons exaggerated the differences (for example, claiming something was “4500× better”). This has now been corrected so that comparisons are grounded in real values, consistent with the dashboard data, and transparent about the assumptions behind them.
Accomplishments that we're proud of
One thing I’m really proud of is getting messy, real-world PDFs to actually work. The app can take documents with broken layouts, tables, and inconsistent formats and still turn them into something structured and useful.
Another big win was making the results feel consistent and trustworthy. Early on, the same file could give different outputs, and fixing that made the app feel much more solid.
I’m also happy with how the UI turned out.
And overall, turning a pretty generic idea into something more product-focused with priorities, insights, and comparisons, was probably the most important improvement.
What we learned
Real-world data is way messier than expected Small inconsistencies quickly break trust A clean UI is more about what you remove than what you add It’s easy to build a “cool demo,” but harder to build something that feels reliable
What's next for Tally
Let users track what they’ve actually used (instead of assuming everything is unused) Improve recommendations based on real usage Make comparisons more personalized depending on user needs

Log in or sign up for Devpost to join the conversation.