Inspiration
In long-term care, a bowel problem is usually the first sign that something is wrong and the last thing anyone charts properly. Around 70% of nursing-home residents have chronic constipation, roughly half report having had a fecal impaction, and 90% of US nursing homes run below expected staffing. State inspection reports are full of findings like "no documentation of a bowel movement from April 1–7, 15–22, 25–30." The bowel chart is a paper tick-box filled in by the busiest person in the building, and the stuff it misses turns into falls, delirium, dehydration admissions and C. diff outbreaks a few days later.
We wanted the chart to fill itself in, and then check itself against the resident's own record. Yes, the name is a pun. We stand by it.
What it does
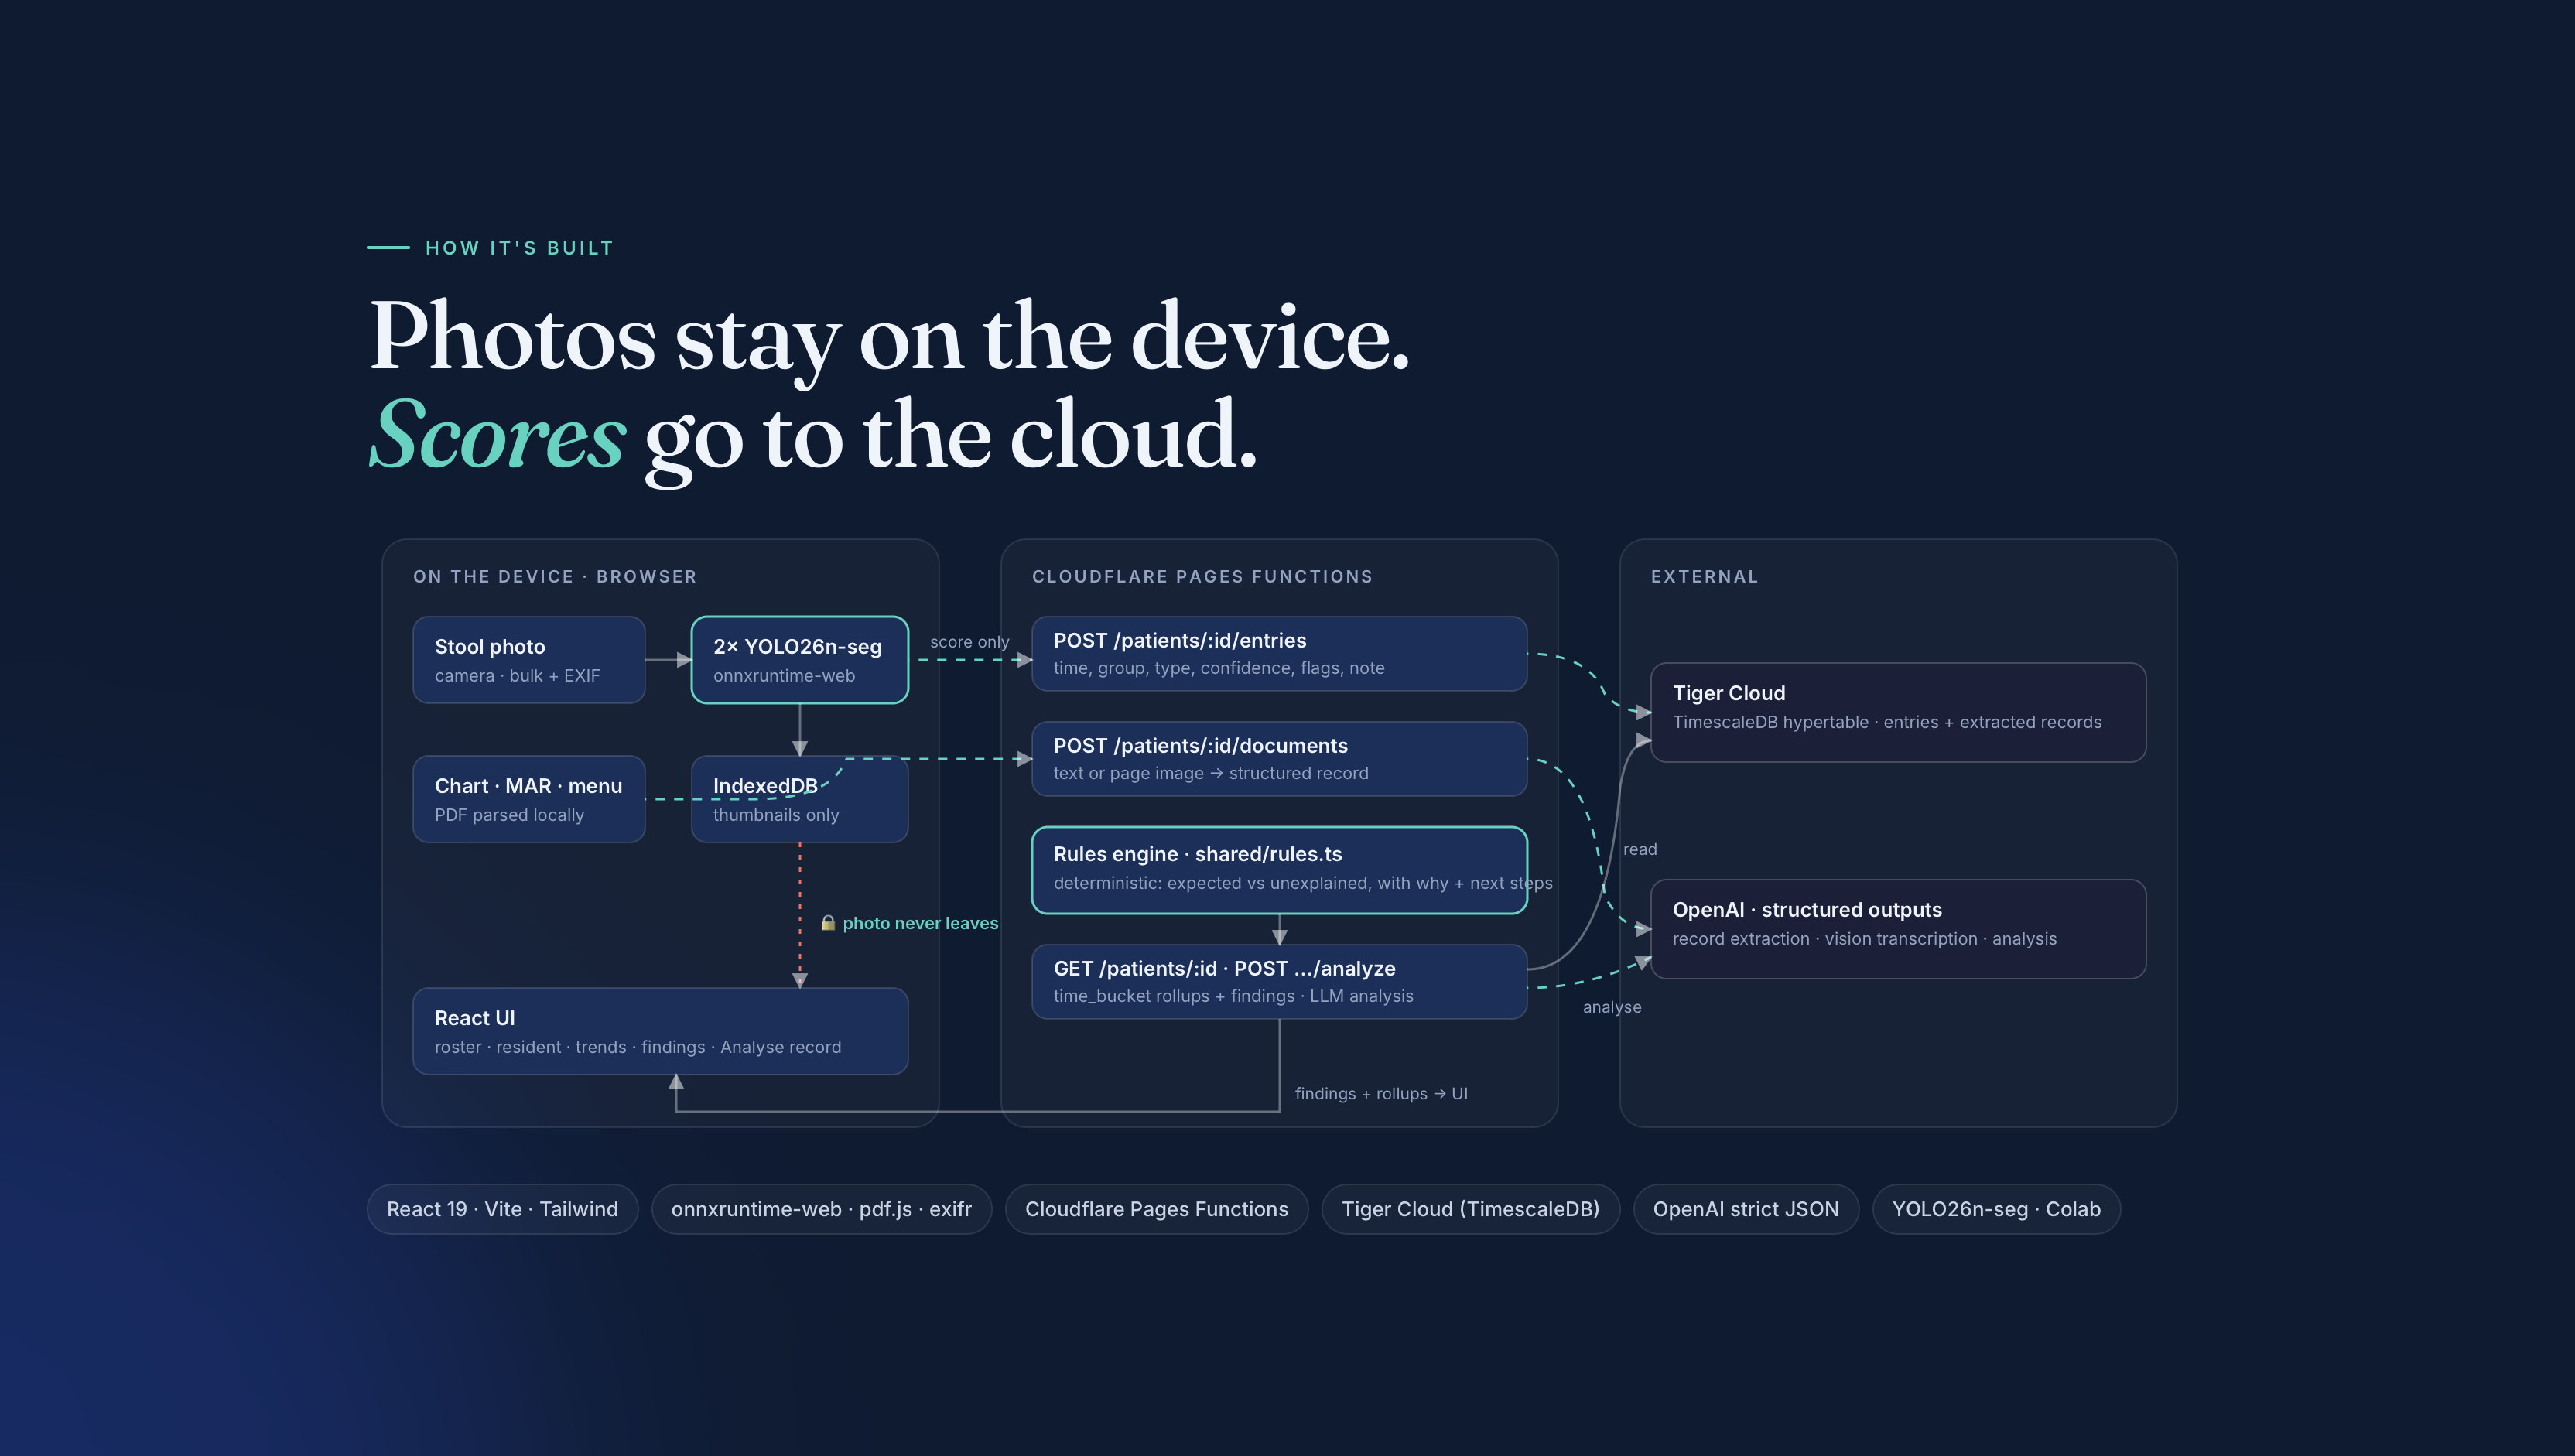
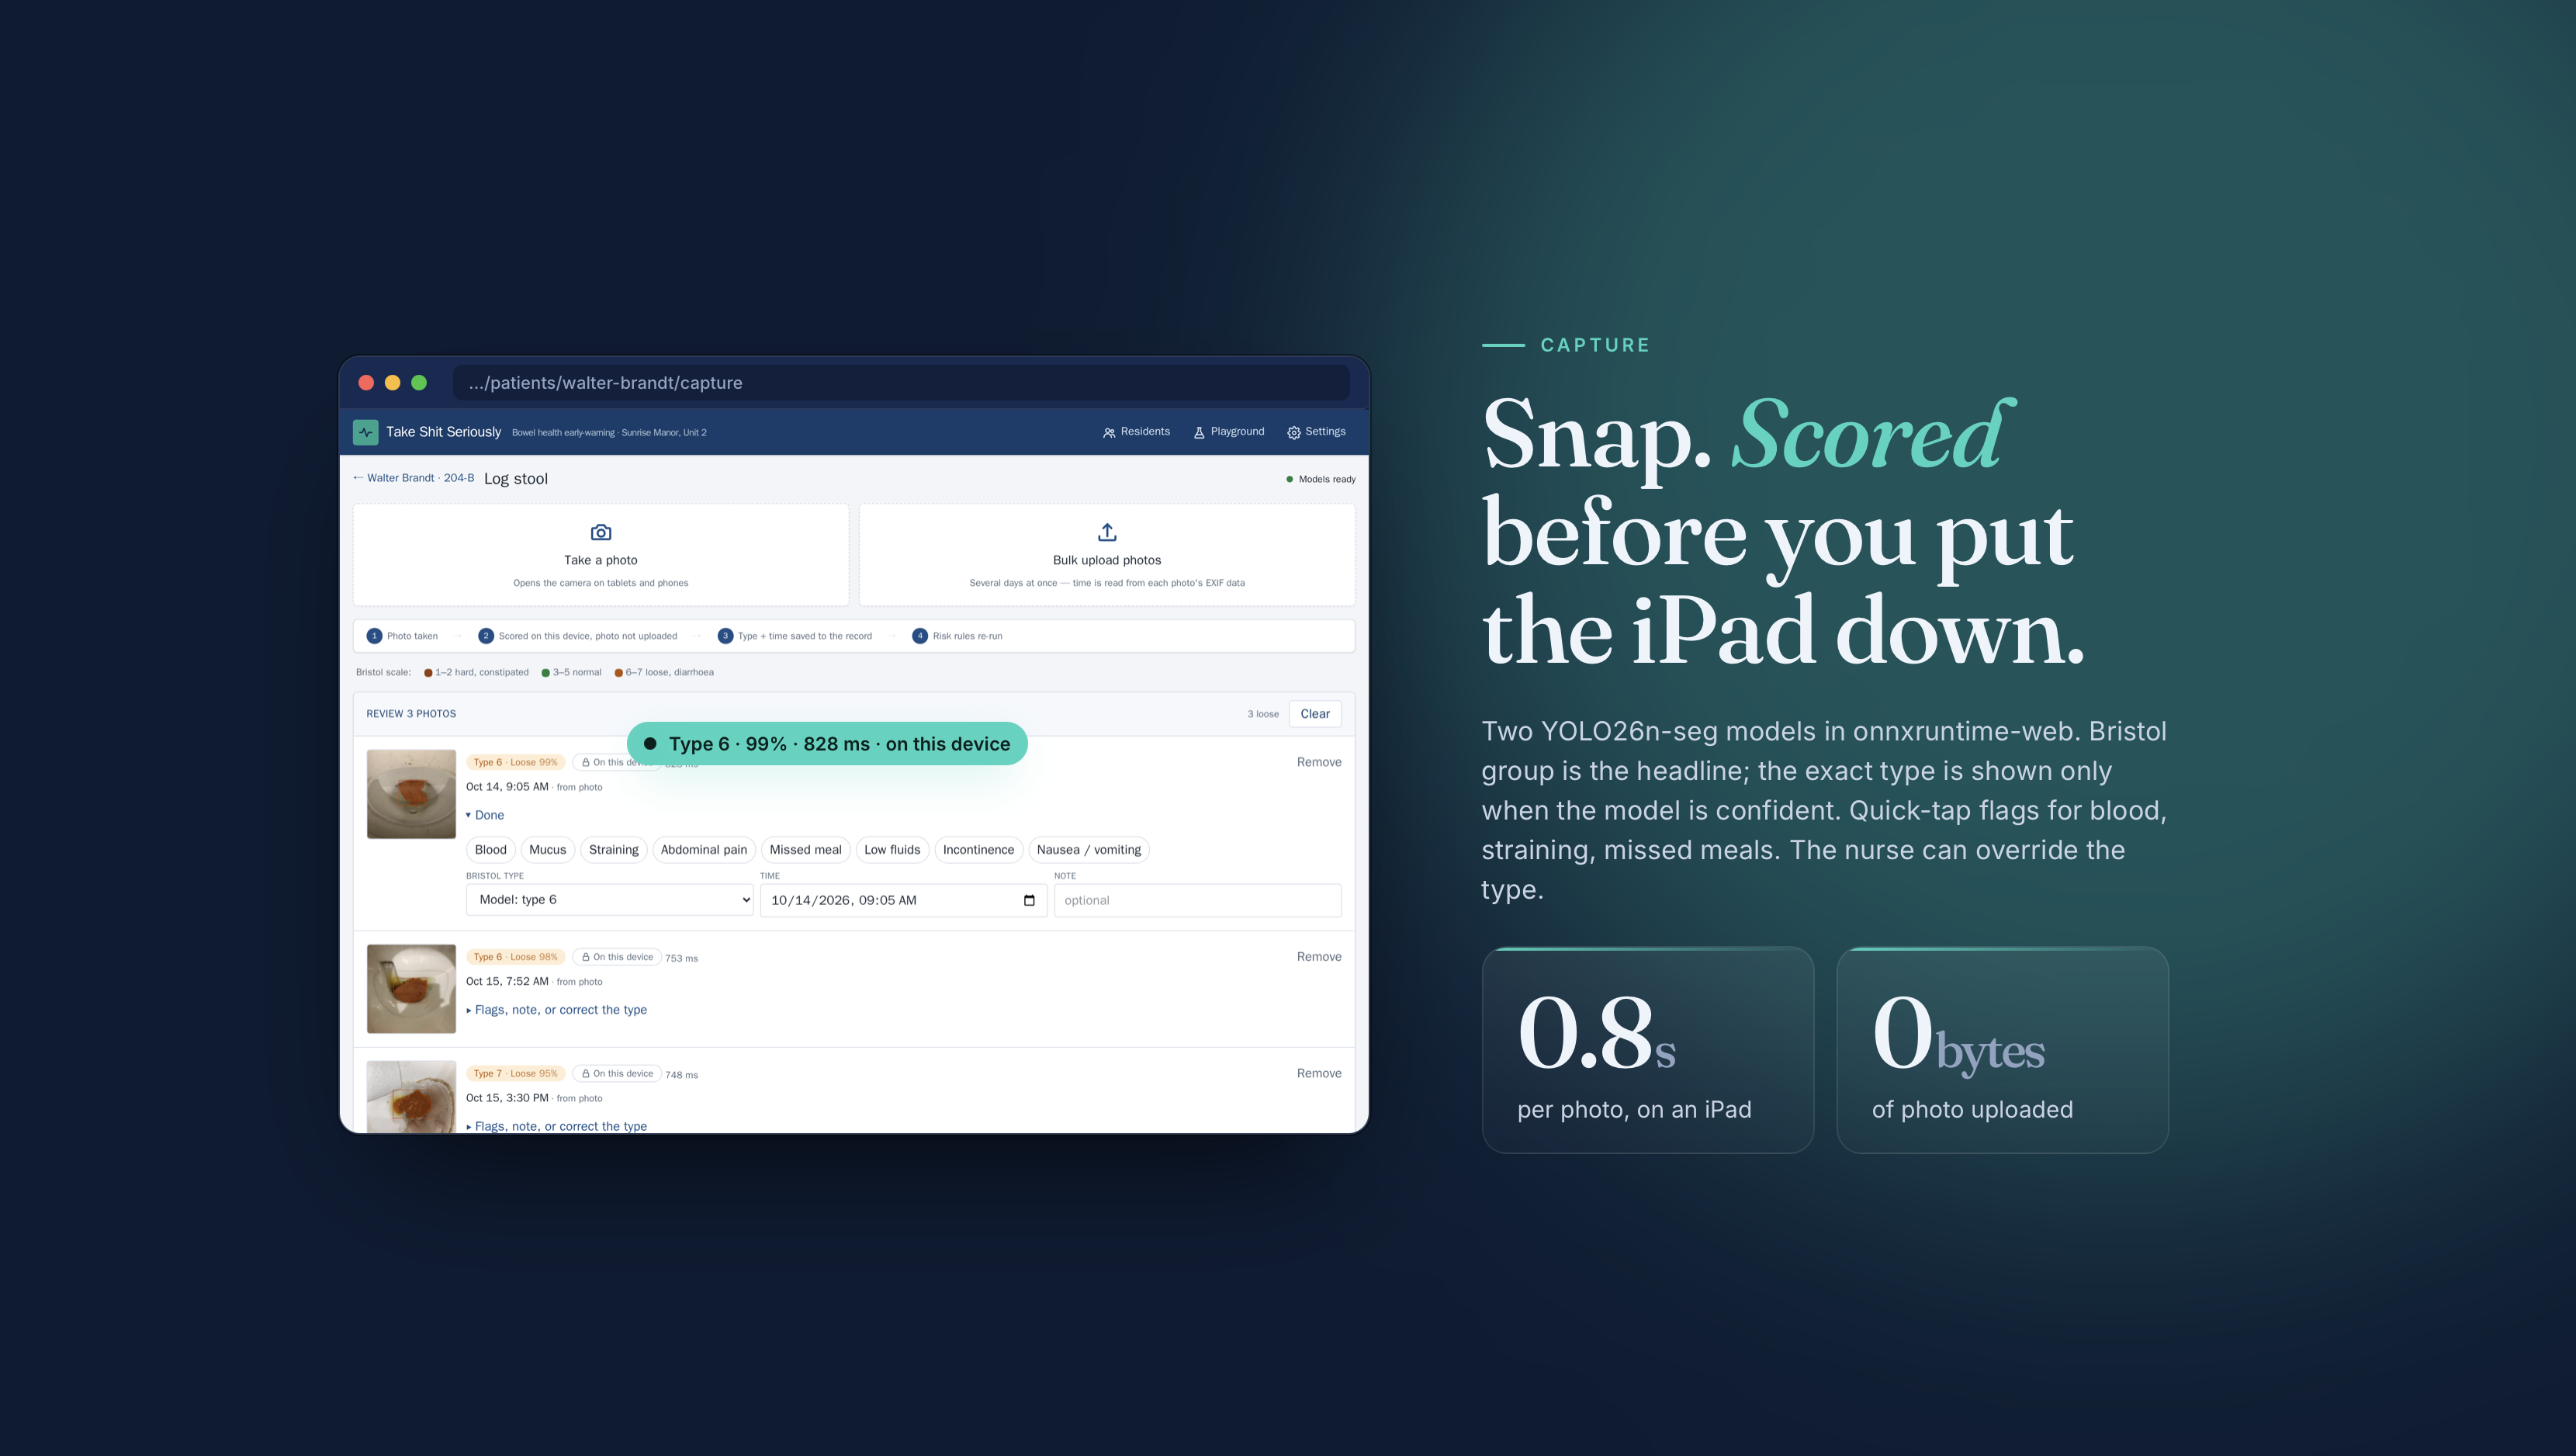
A CNA snaps a stool photo on the unit iPad (or bulk-uploads a few days at once). Two small segmentation models score it on the device: Bristol group (constipated / normal / loose) plus the exact type when confident. The photo never leaves the device; only the score, time and quick-tap flags (blood, straining, missed meal...) are saved.
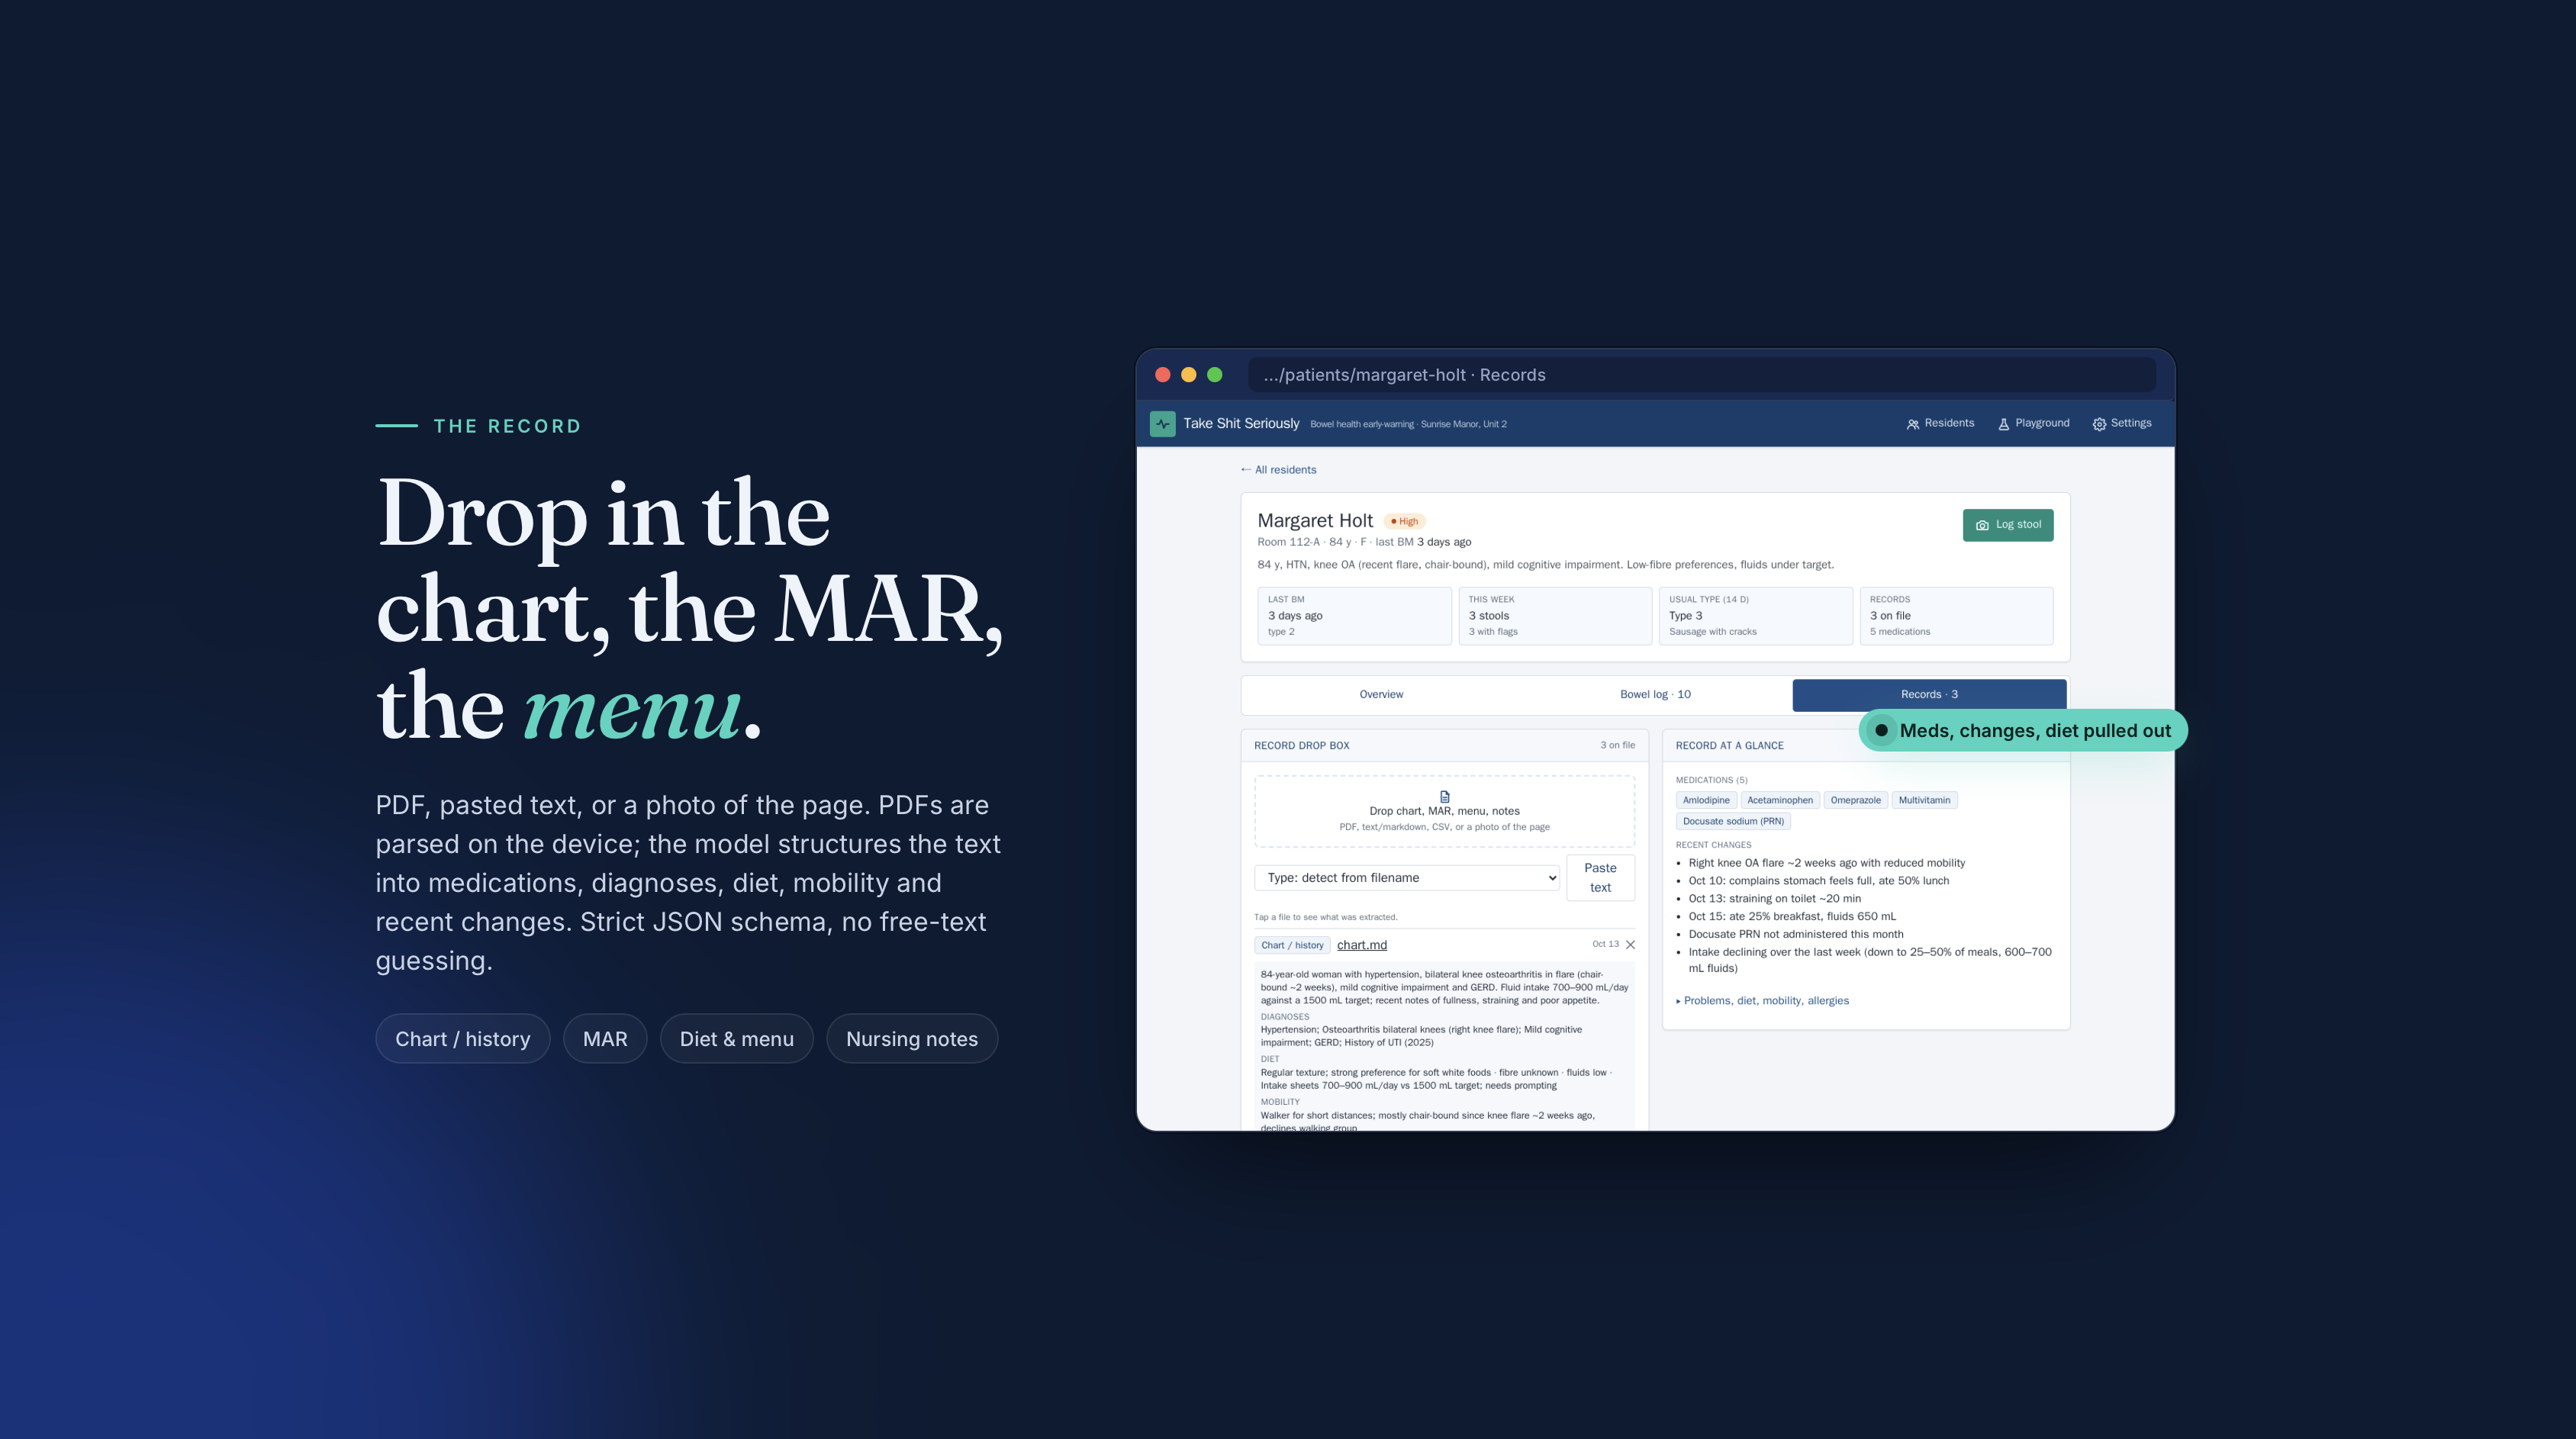
The resident's chart, MAR and menu get dropped into a record box. They're parsed on the device or sent as an image, and an LLM structures them into medications, diagnoses, diet, mobility and recent changes.
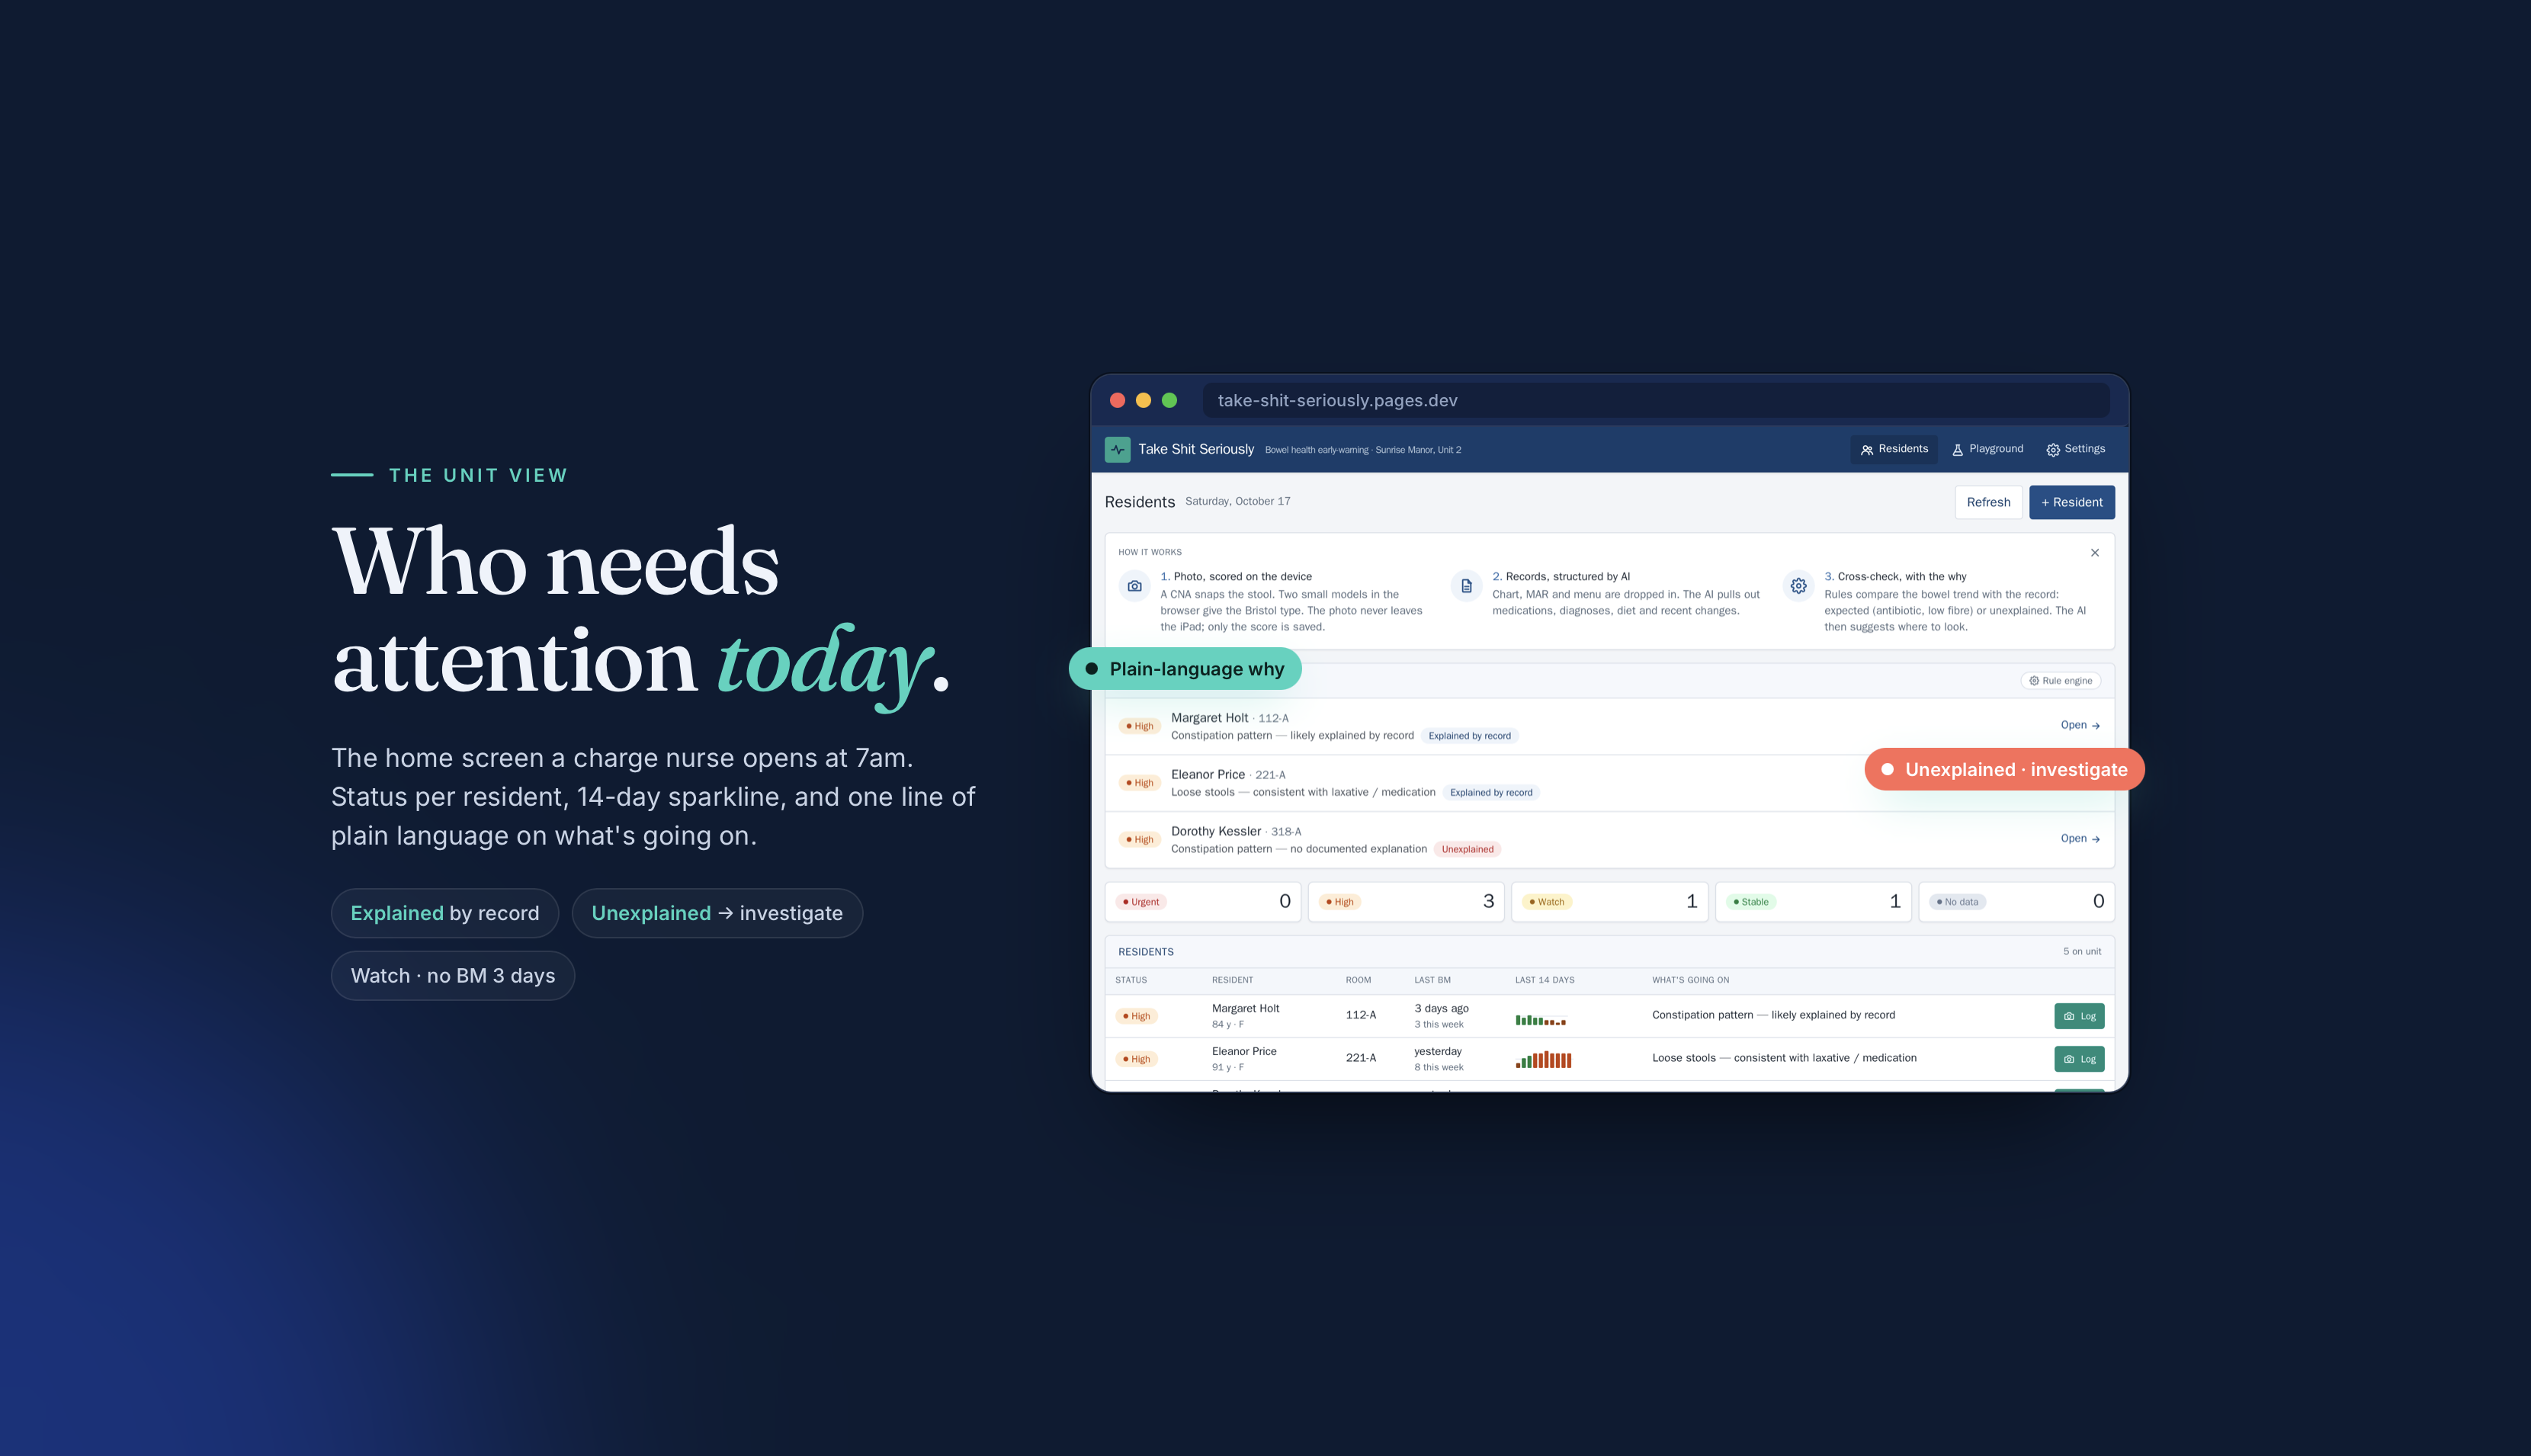
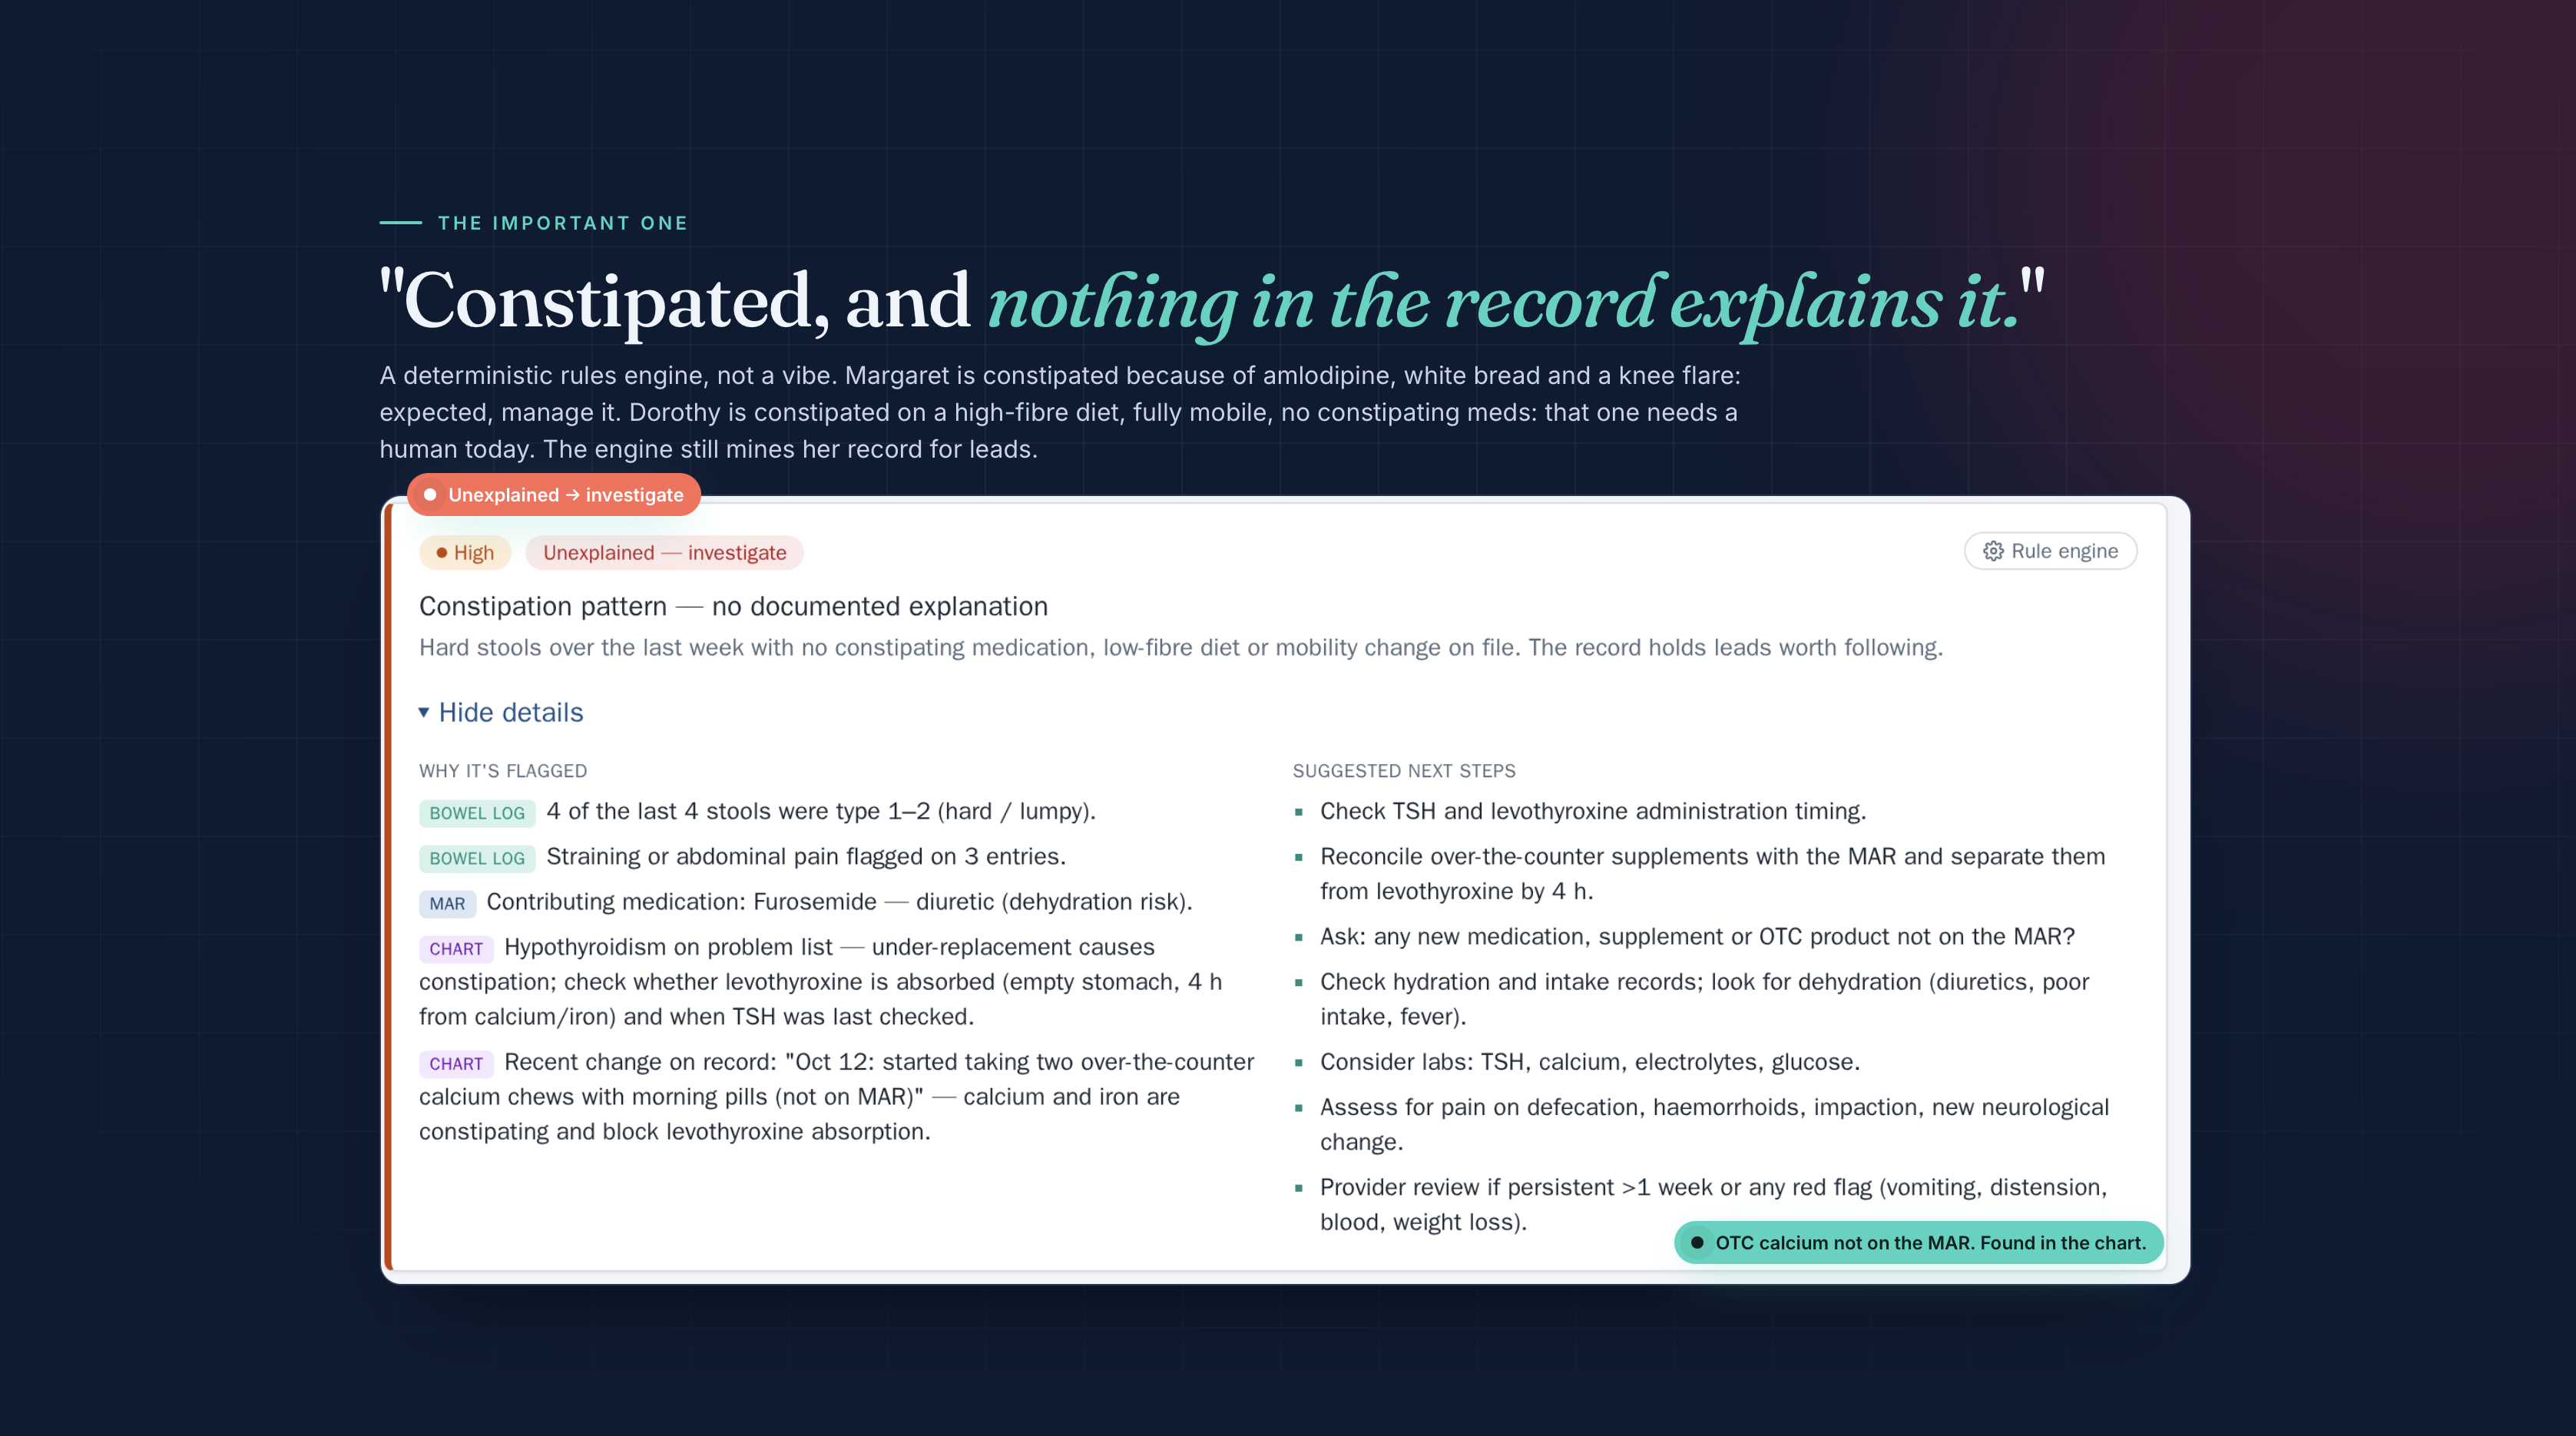
Then a deterministic rules engine cross-checks the bowel log against the record and says one of two things, with a plain-language why and next steps:
- Explained by record. Hard stools, but she's on amlodipine, eats white bread and has been chair-bound since a knee flare. Manage it.
- Unexplained, investigate. Hard stools on a high-fibre diet, fully mobile, no constipating meds. This is the one that needs a human today. The engine still mines the record for leads (in our demo: OTC calcium chews not on the MAR, taken with levothyroxine).
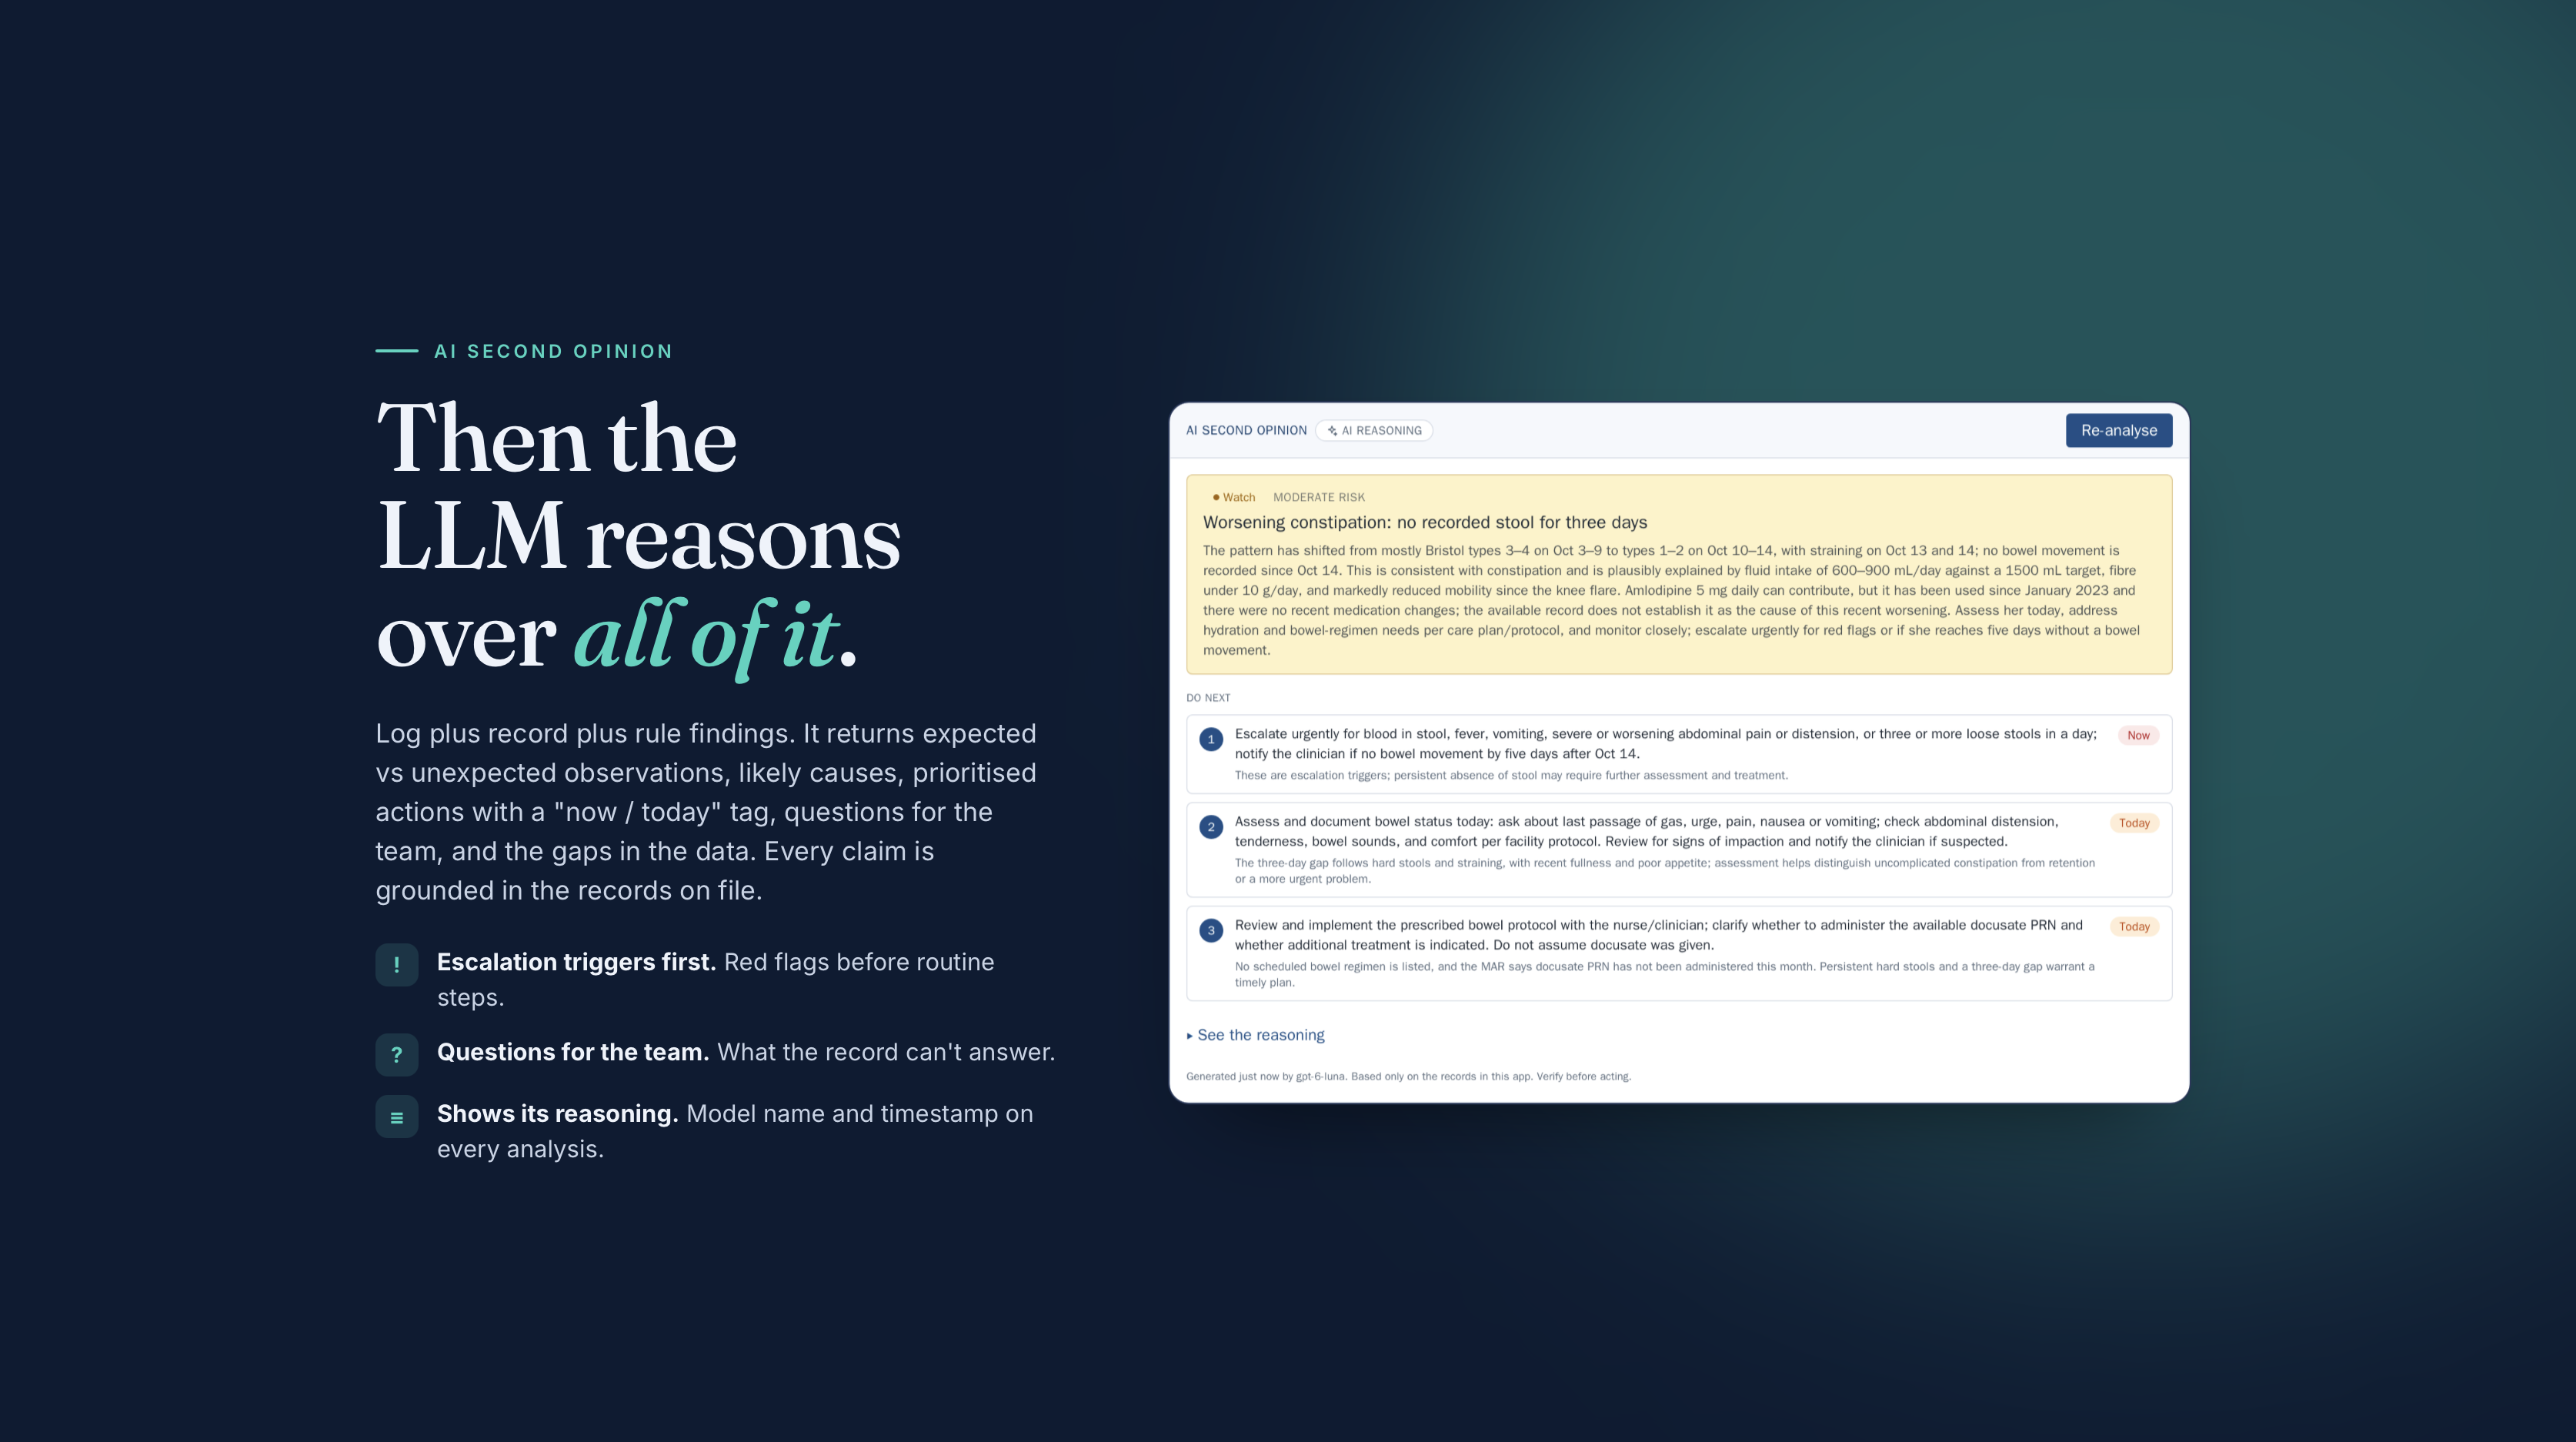
- "Analyse record" asks the LLM to reason over log + record + rule findings and return expected vs unexpected observations, likely causes, prioritised actions, questions for the team and data gaps. Trends live in a TimescaleDB hypertable with per-day rollups. The UI is deliberately PointClickCare-shaped so a CNA needs zero training, and it works on iPad, phone and laptop.
Live demo: https://pleasetakeshitseriously.photo
How we built it
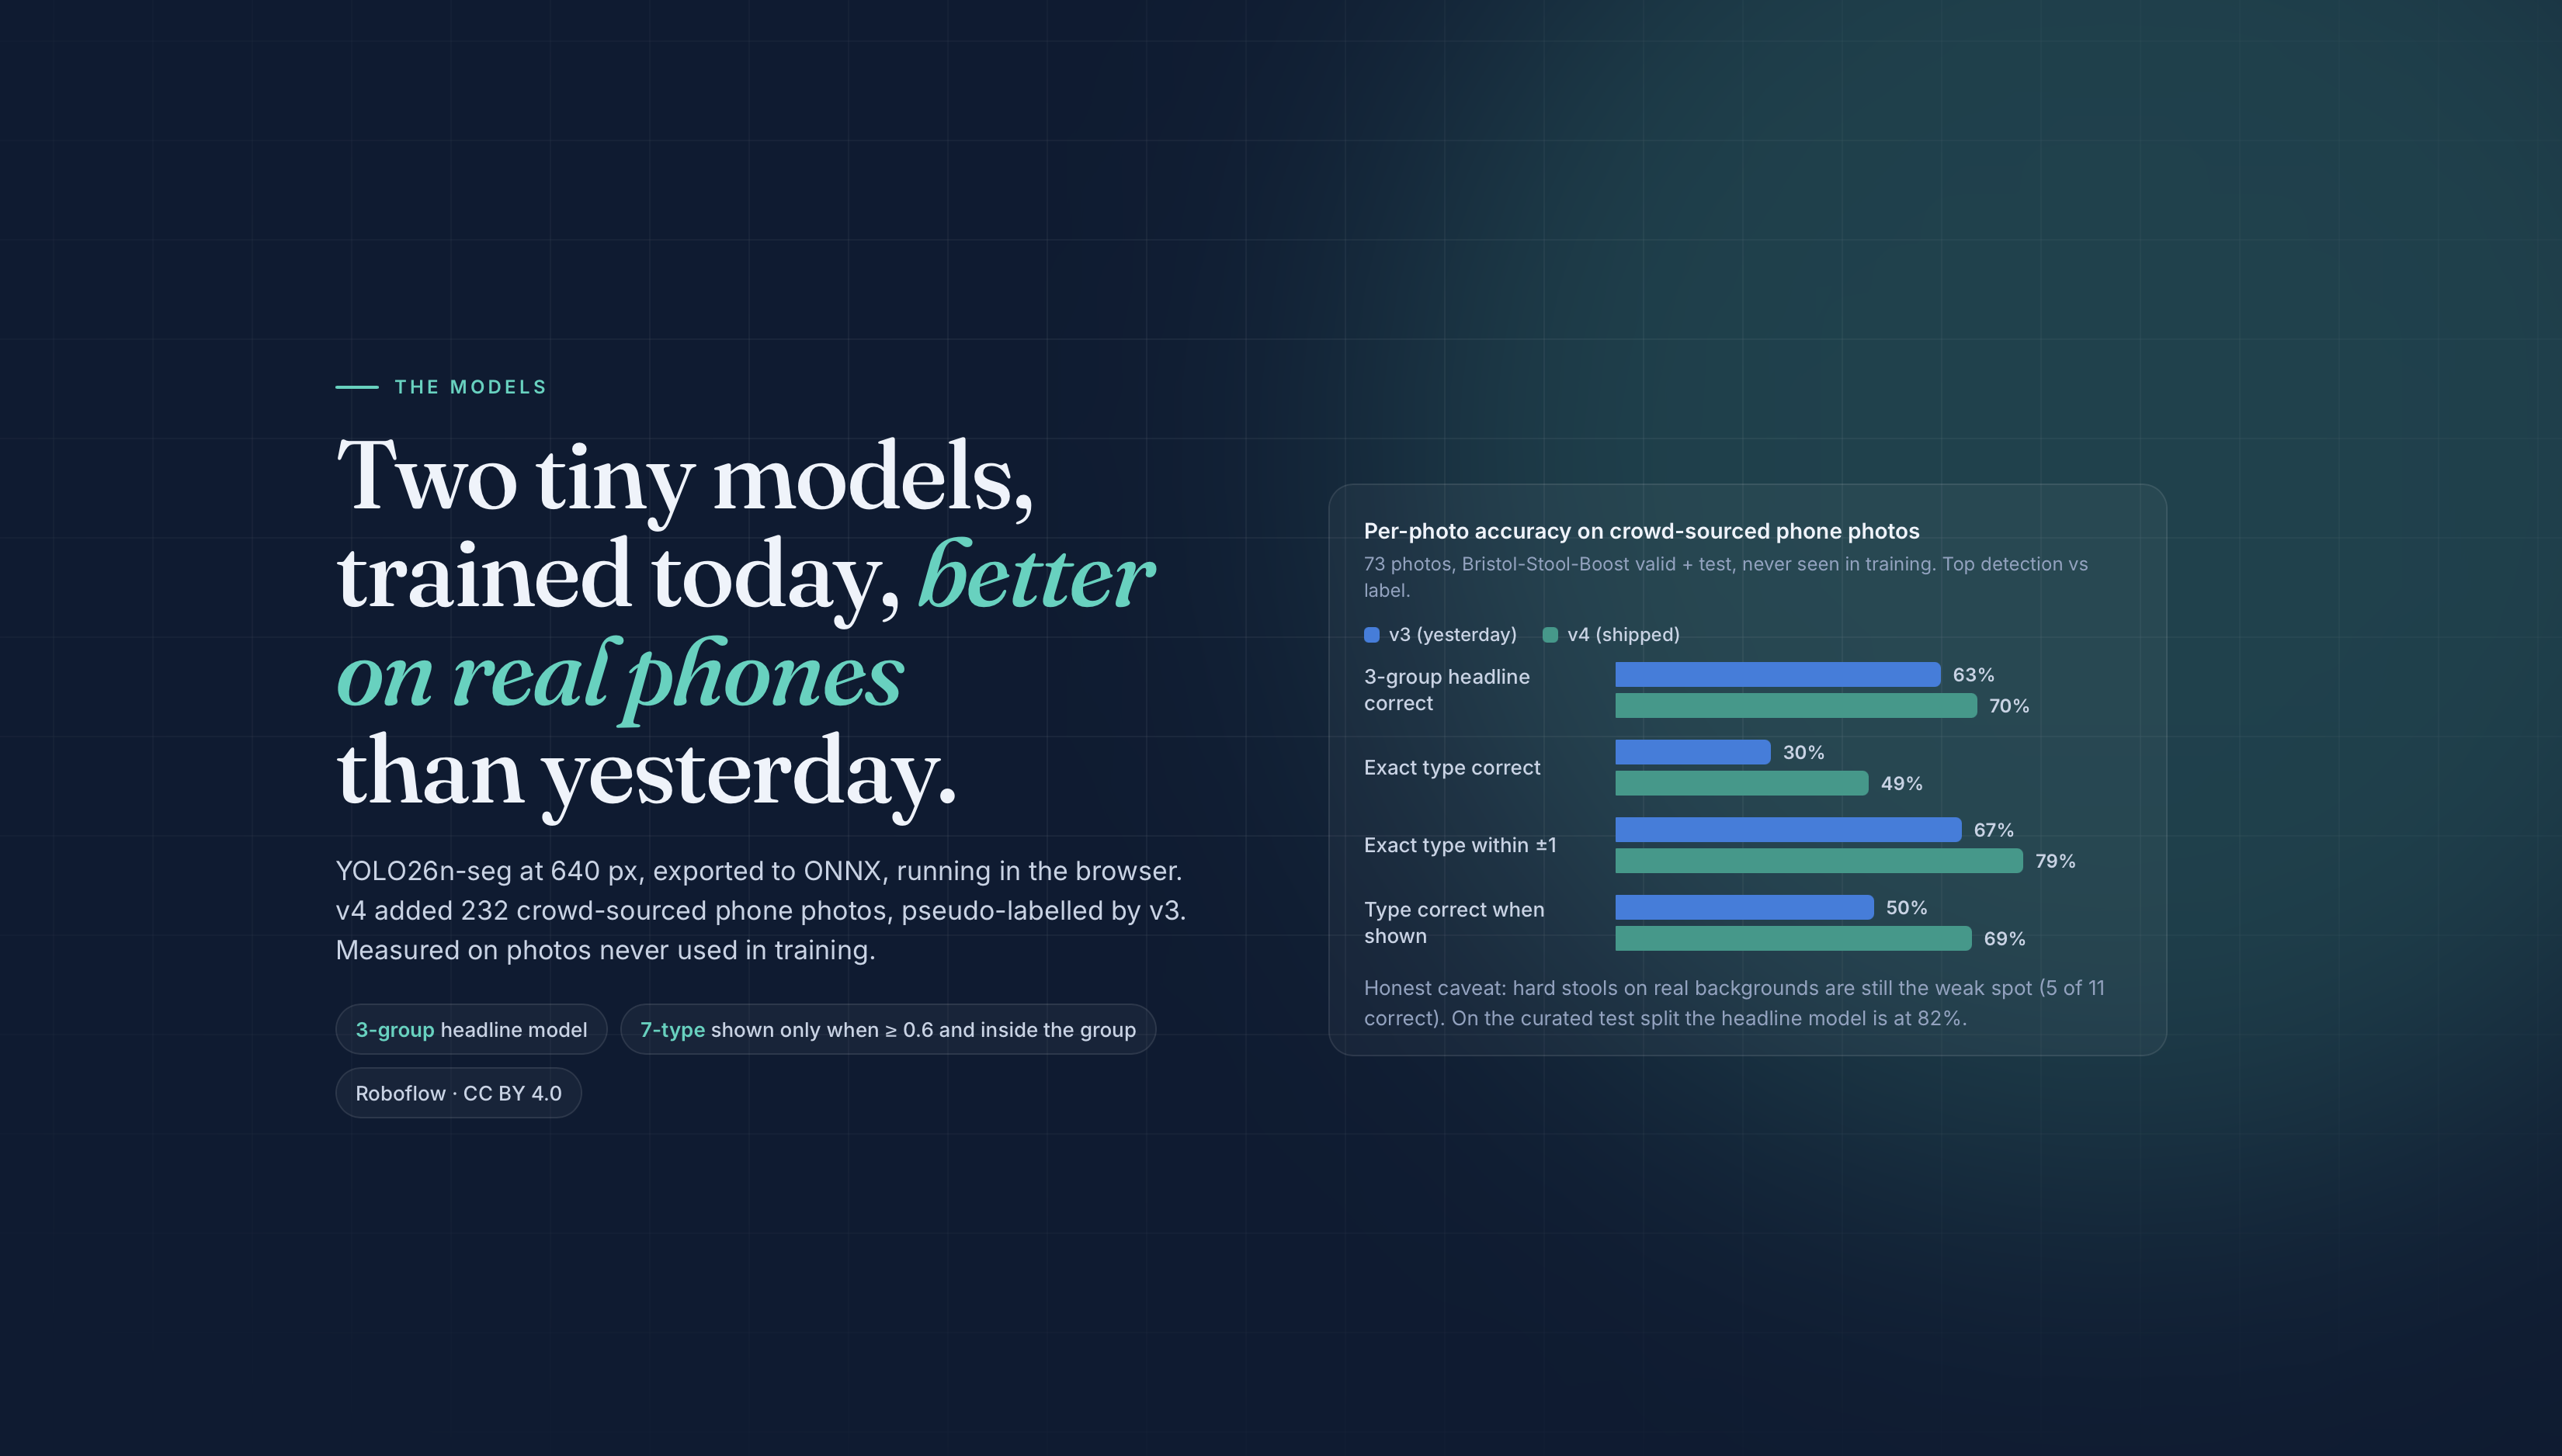
- Models: two YOLO26n-seg models (3-group headline + 7-type) trained on Google Colab at 640 px, exported to ONNX, running in the browser with onnxruntime-web. ~0.8 s per photo on a tablet.
- Data: the smartgut "stool classification" dataset from Roboflow Universe (CC BY 4.0), de-duplicated (294 duplicates removed) and re-split, plus 232 crowd-sourced phone photos whose masks we pseudo-labelled with our v3 model.
- Frontend: React 19 + TypeScript, Vite, Tailwind, React Router, Recharts. pdf.js parses chart PDFs on the device; exifr pulls capture times from photo EXIF; thumbnails stay in IndexedDB.
- Backend: Cloudflare Pages Functions. A shared TypeScript rules engine runs server-side. OpenAI with strict structured outputs for record extraction, vision transcription and the analysis.
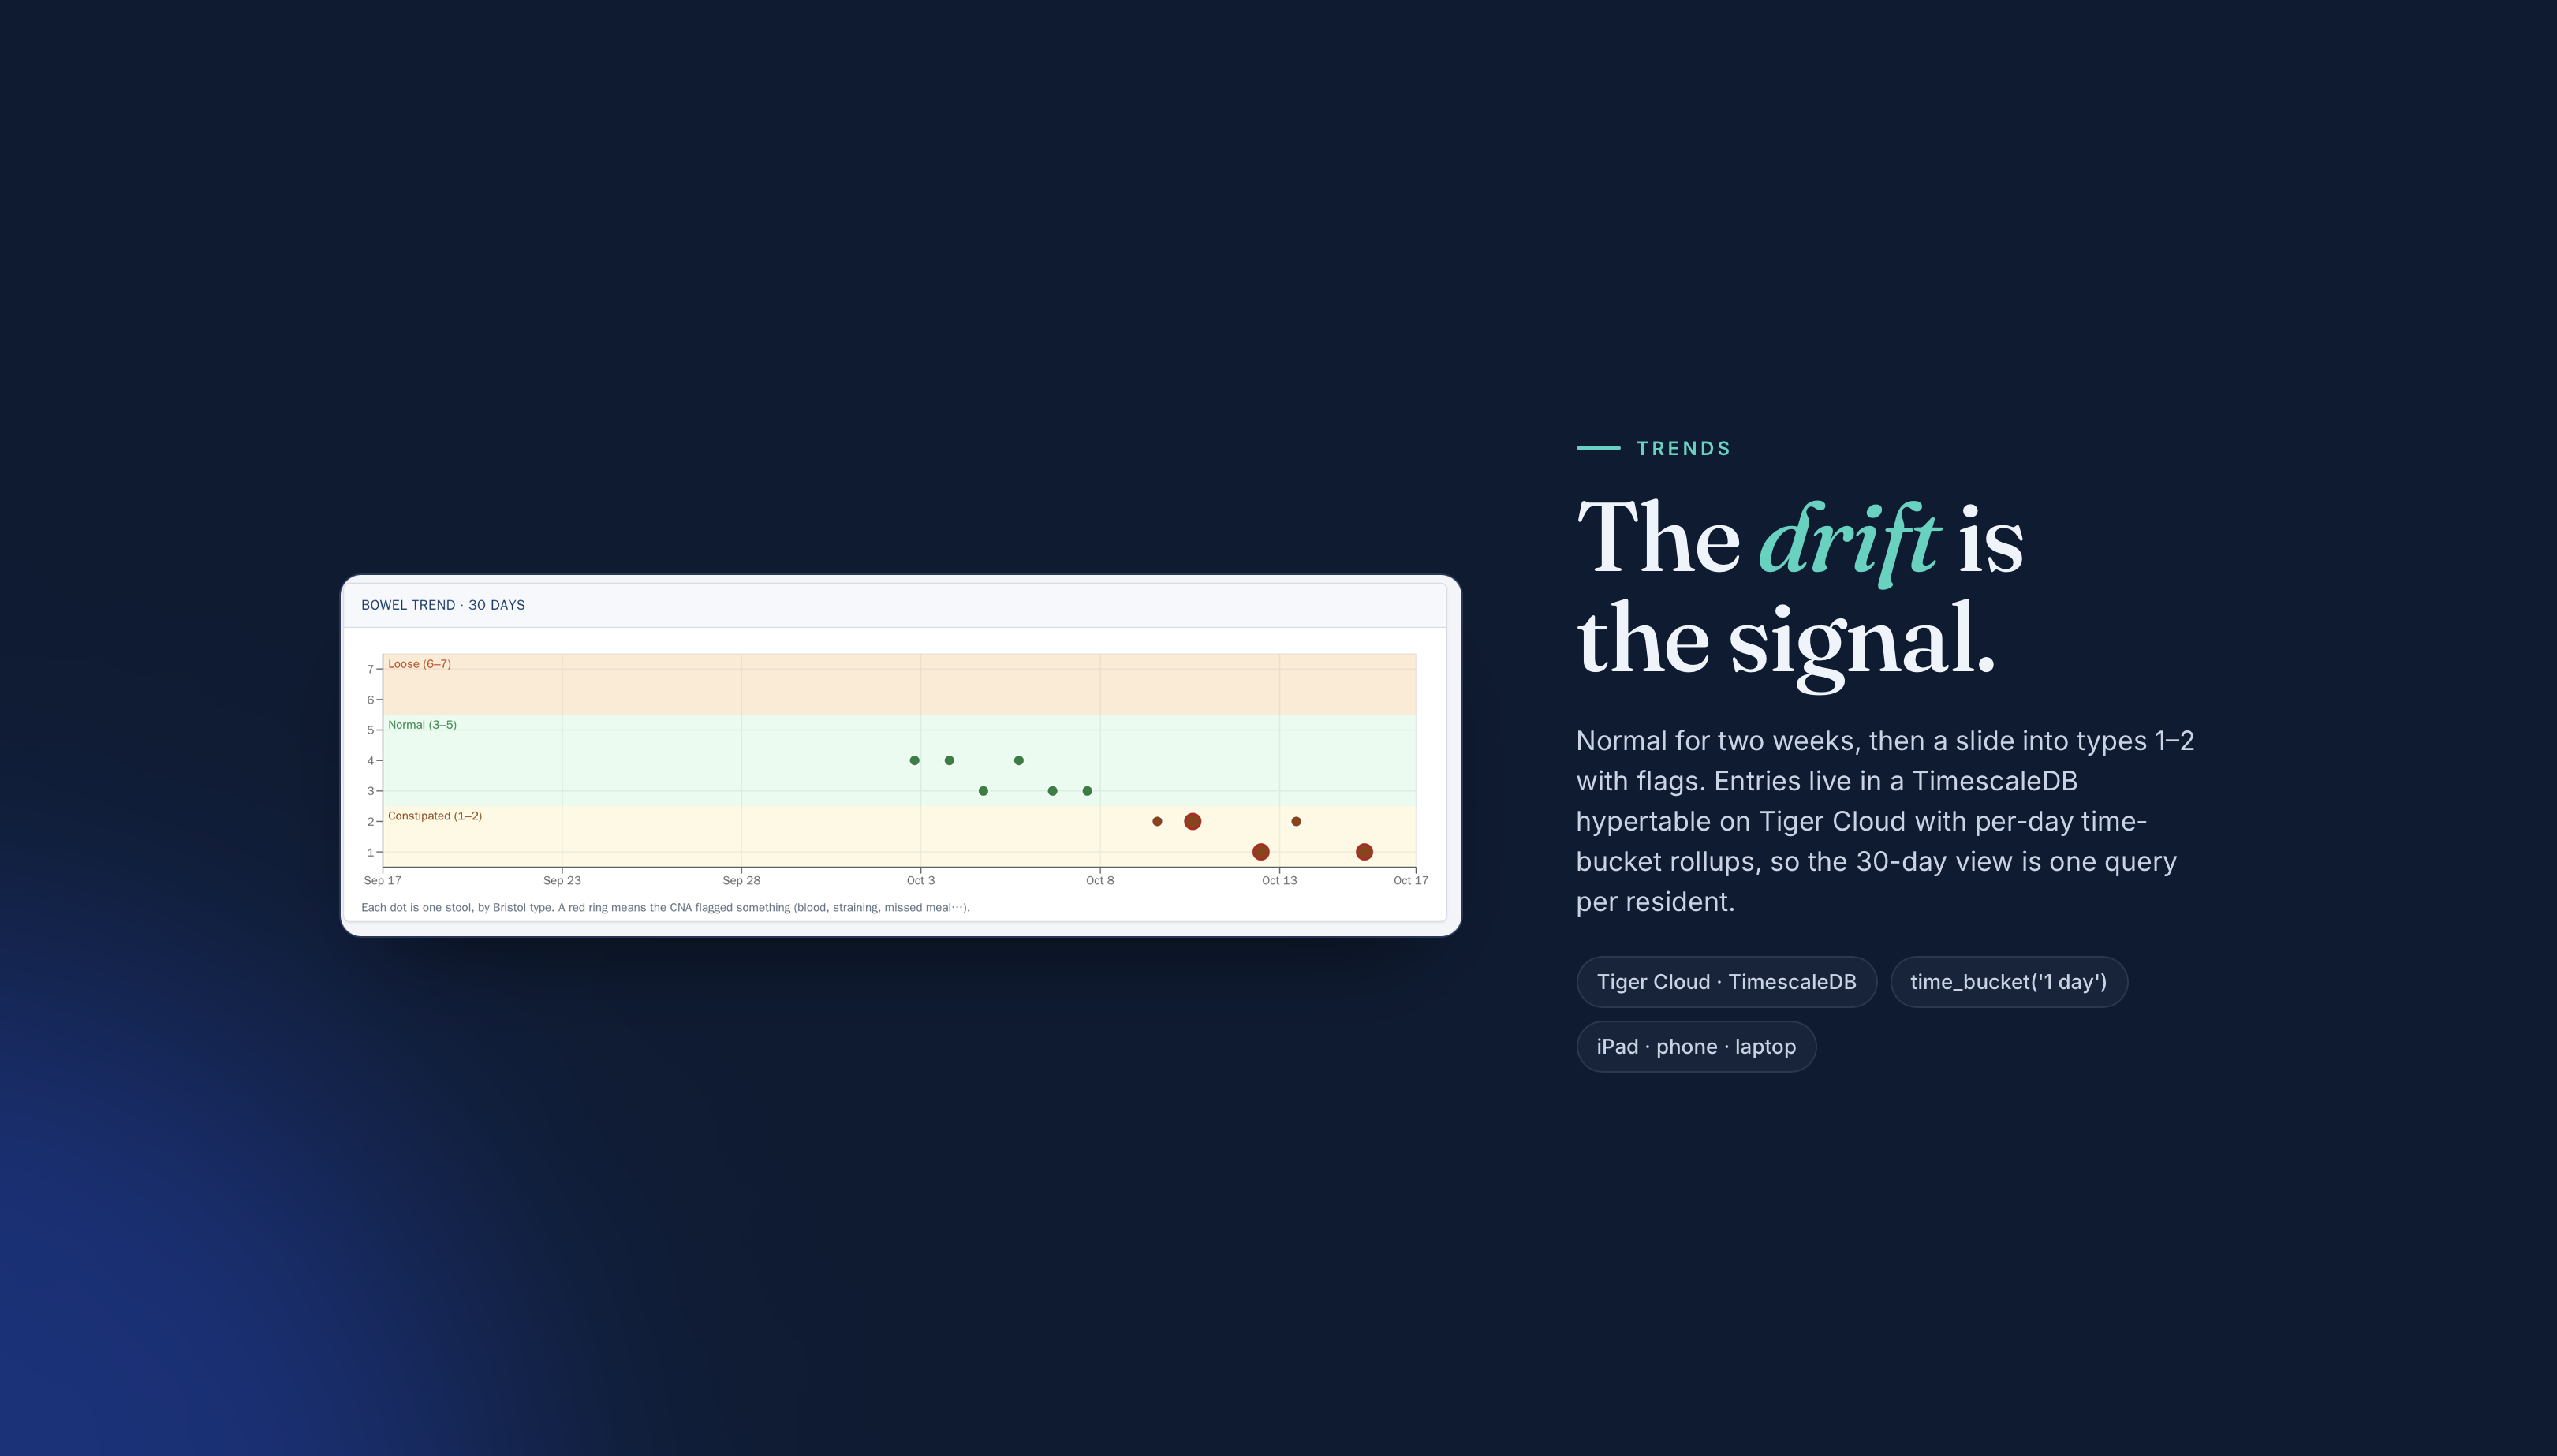
- Database: Tiger Cloud (managed TimescaleDB). Stool entries are a hypertable; the 30-day trend is one time_bucket('1 day') query per resident.
- Demo data: five synthetic residents with charts, MARs, menus and EXIF-dated photos, plus a seed endpoint so judges can load them in one click.
Challenges we ran into
- Adjacent Bristol types look the same. A 7-class detector plateaued around 0.65 mAP50 because types 3 vs 4 or 5 vs 6 are near-indistinguishable at this data size. Merging into three groups (constipated / normal / loose) as the headline model, and only showing the exact type when it's confident and agrees with the group, fixed the user-facing problem.
- Curated datasets lie about real phones. Our v3 model hit 83% on the curated test split and 63% on crowd-sourced phone photos. Real backgrounds, real lighting, real toilets. We pseudo-labelled real photos with v3 and retrained.
- Duplicates in the training data. The Roboflow set had hundreds of near-duplicate images across splits, which inflated every number. We de-duplicated and re-split before trusting anything.
- Running segmentation in a browser on a tablet. Getting the WASM runtime, 640 px preprocessing and mask decoding fast enough to feel instant, while keeping the photo entirely on the device.
- Making the LLM trustworthy enough for a nurse. Strict JSON schemas, rules first and LLM second, every claim grounded in the records on file, and a model name + timestamp on every analysis.
Accomplishments that we're proud of
- Real-world accuracy went from 63% to 70% (3-group) and 30% to 49% (exact type) in one retrain, measured on photos the model had never seen.
- Zero stool photos ever leave the device. Six fields per entry reach the server.
- The "unexplained" finding actually works on the demo residents, and the leads it surfaces (calcium blocking levothyroxine, a diuretic, a thyroid under-replacement) are the kind of thing a good nurse would catch on a good day.
- It looks like software a care team already uses, and runs on the iPad already on the unit
What we learned
- Honest evaluation matters more than a high number. Measure on the hard set, report the weak spots (hard stools on real backgrounds: 5 of 11 correct), and design the UI around the model's actual confidence.
- Deterministic rules plus an LLM beats either alone. The rules are auditable and never need a network call; the LLM is good at reasoning across a messy record once the rules have framed the question.
- Privacy-by-architecture is easier than privacy-by-policy. Putting the model in the browser removed an entire category of problems.
- A lot about bowels.
What's next for TakeSh*tSeriously
- EHR integration. Push entries into PointClickCare / MatrixCare as bowel-chart rows and pull the MAR instead of dropping it in.
- More real photos. A consented pilot on one unit is the fastest way to fix hard-stool accuracy on real backgrounds.
- Unit-level alerts. Two loose-stool residents on one hall in 48 hours is an outbreak question, not a resident question.
- Hydration and intake signals alongside the bowel log, since dehydration is where the cascade ends.
- Regulatory homework. This is decision support, not a medical device, and we'd want to keep it that way until the evidence says otherwise.
Built With
- claude
- cloudflare
- colab
- godaddy
- openai
- python
- react
- tailwind
- tigerdata
- typescript
- vite
- yolo

Log in or sign up for Devpost to join the conversation.