-
-
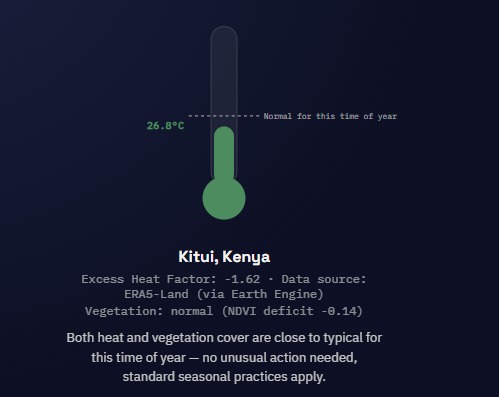
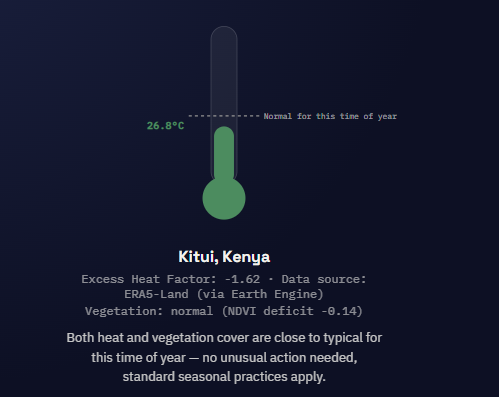
thermometer gauge on a preset region
-
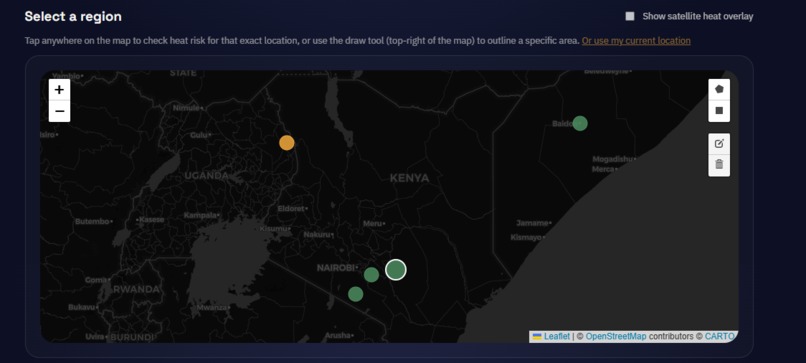
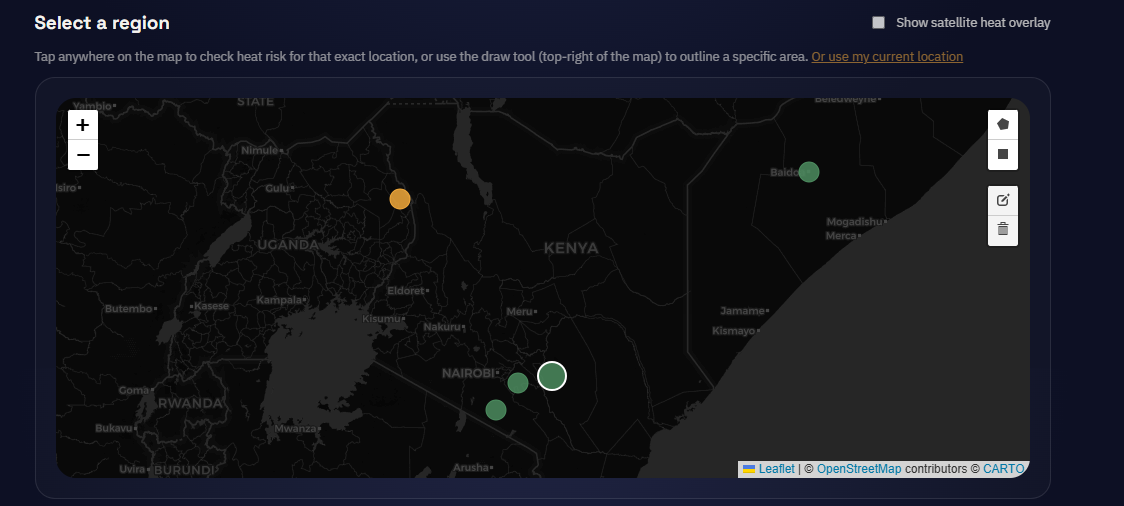
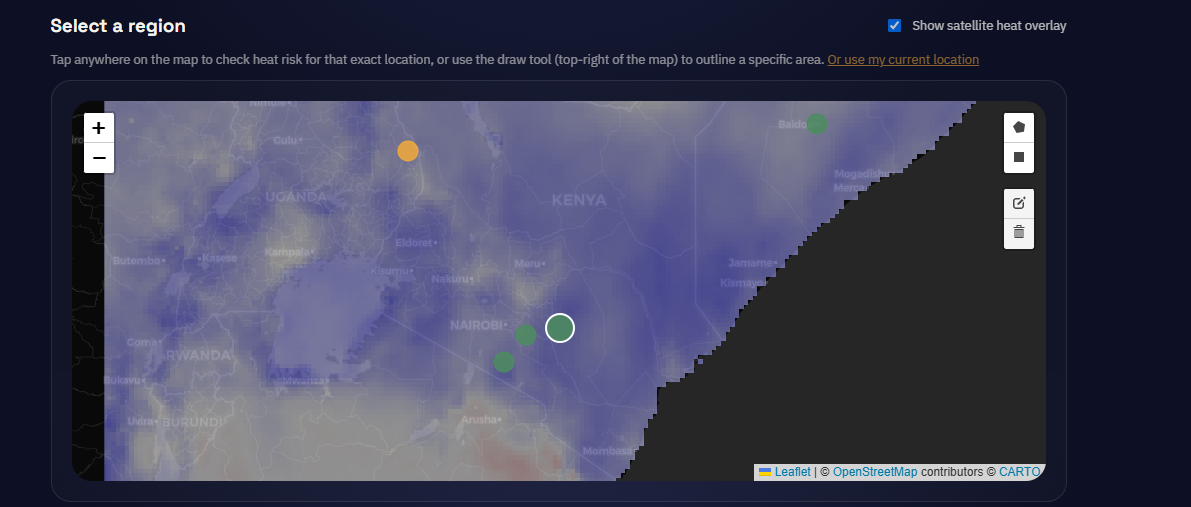
map
-
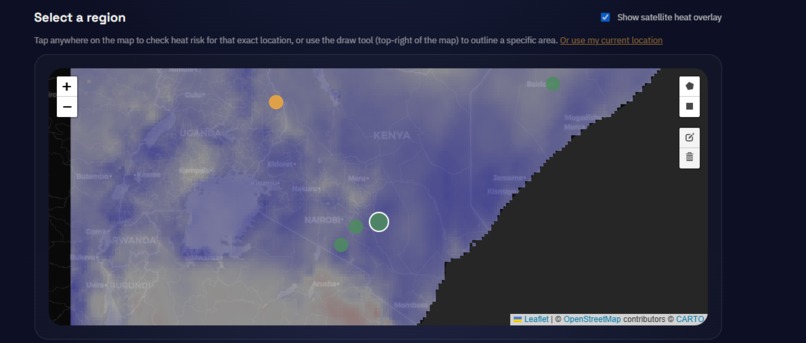
satellite heat overlay
-
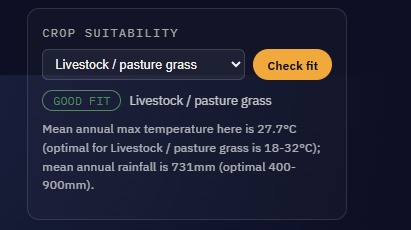
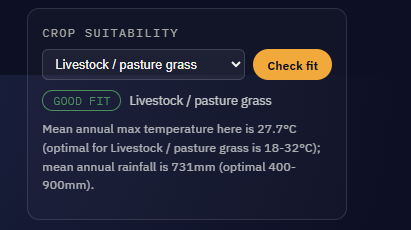
crop suitability
-
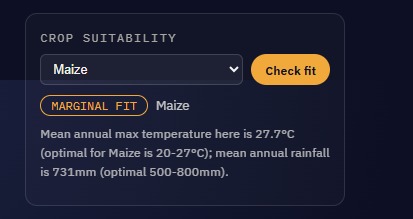
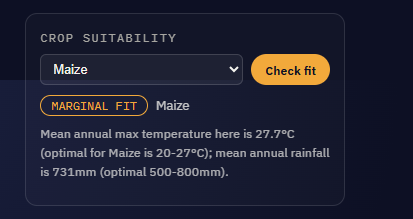
crop suitability
-
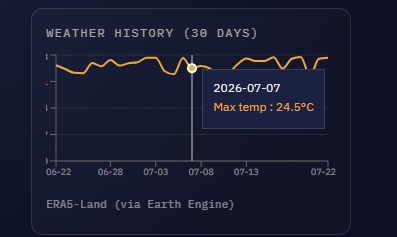
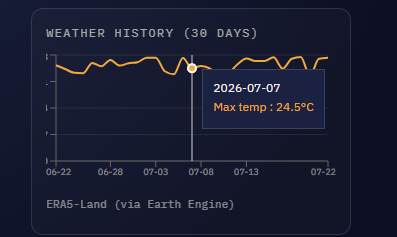
weather chart
-
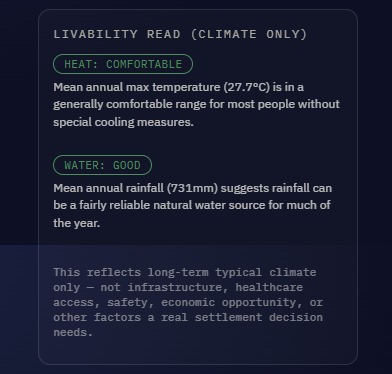
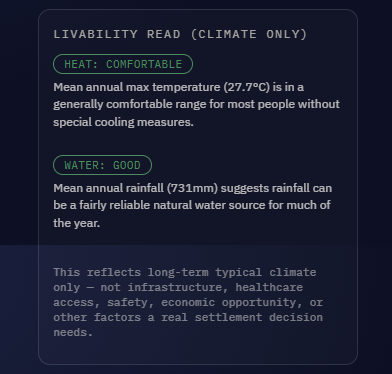
livability
-
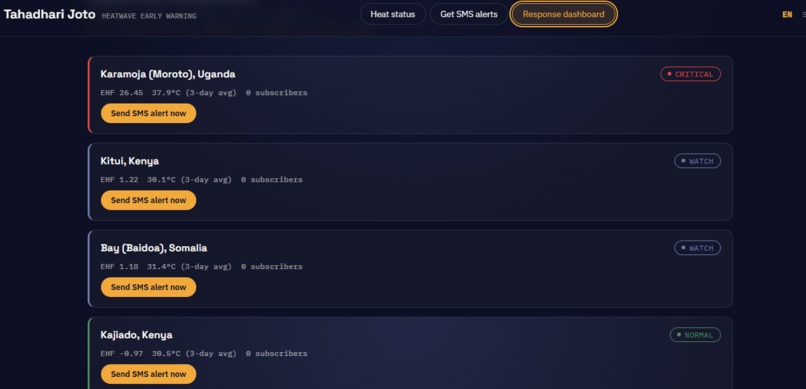
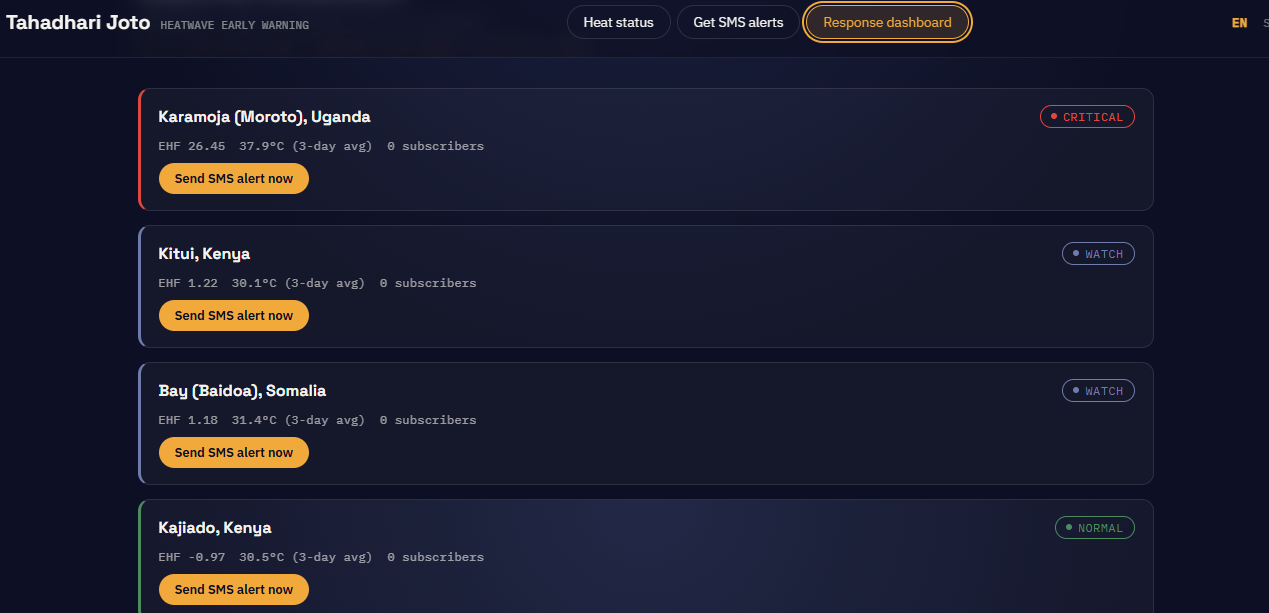
Response Dashboard
-
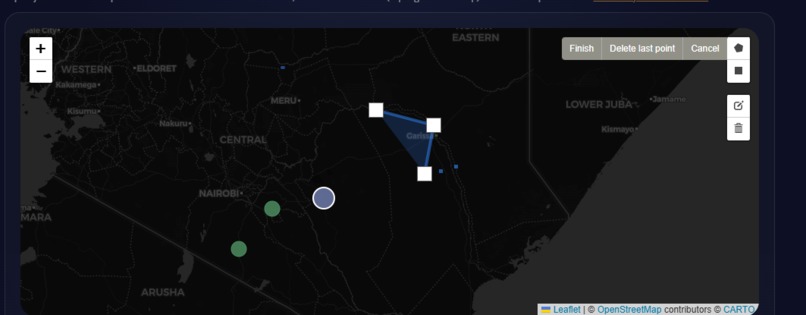
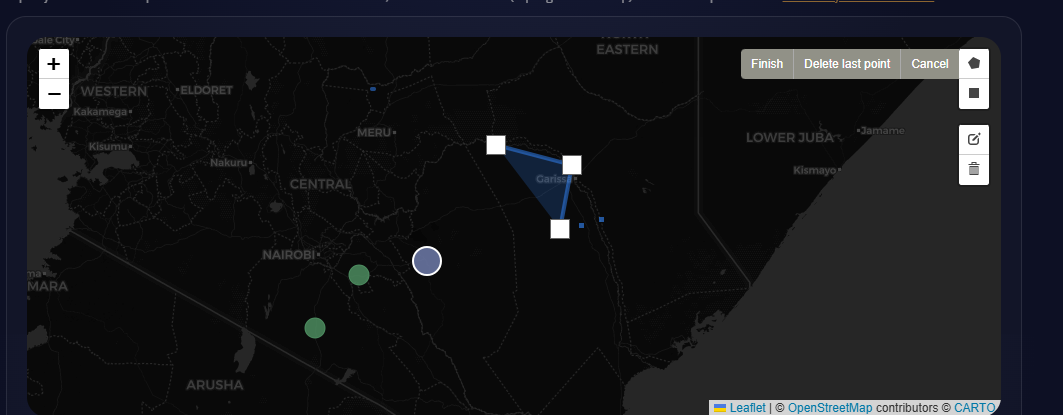
drawn polygon
-
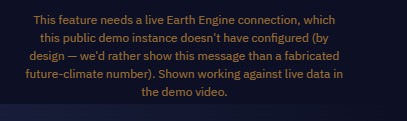
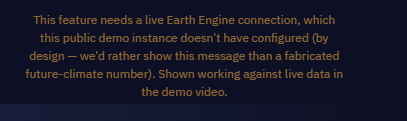
long term outlook(2045-2055)
Inspiration
Across the IGAD region, heat and vegetation stress often show up in satellite data days before they actually damage a crop or kill livestock. The data exists — it's public, it's continuously updated, it's sitting in Google Earth Engine right now. What doesn't exist for most farmers and pastoralists is a way to get that data in a form they can act on, in time, without needing a smartphone, a data plan, or the ability to read a satellite imagery dashboard. That gap — real signal, no delivery path — is what Tahadhari Joto ("heat caution" in Kiswahili) was built to close.
What it does
Tahadhari Joto detects heatwaves using the Excess Heat Factor (the same method Australia's Bureau of Meteorology uses operationally), comparing recent temperature against each location's own 20-year climate history rather than one flat threshold everywhere. It combines that with an independent vegetation-stress signal from MODIS satellite data, because the same heat is far more dangerous to crops that are already moisture-stressed. A rule-based diagnosis engine turns both signals into one plain-language recommendation, and subscribed farmers get that recommendation by SMS — no smartphone required.
Any location can be checked three ways: click the map, use your device's GPS, or draw the exact area you care about. Beyond real-time alerts, the platform helps with planning: a crop suitability advisor rates how well a location's climate fits a chosen crop, a livability panel gives an honest climate-only read on an area, a 30-day history chart shows the trend behind today's number, and a long-term outlook pulls real NASA CMIP6 projections out to the 2045-2055 decade.
How we built it
A Python gee_engine module owns every Earth Engine query, cleanly
separated from a FastAPI backend that handles HTTP, caching, and SMS
delivery via Africa's Talking, and a React + Leaflet frontend for the
map, dashboard, and decision-support panels. Every satellite-dependent
feature has a documented rule-based or mock fallback, so the app degrades
gracefully instead of breaking when a live query fails.
Challenges we ran into
- A network SSL interception issue blocked Earth Engine auth entirely during setup — traced to network-level HTTPS inspection, not our code.
- Google Cloud's service-usage permission layer is separate from
normal API auth — a valid service account key still needs an explicit
serviceUsageConsumerrole grant before Earth Engine will accept calls. - FAO/GAUL administrative boundaries turned out to be out of date for Kenya — the dataset organizes the country by pre-2013 provinces, not its current 47 counties, which silently broke geometry lookups for every Kenyan region until we switched to buffered-circle geometry built directly from coordinates instead of matching boundary names.
- Satellite data has real ingestion lag — querying "today" can return an empty collection, so the model now finds the most recent date that actually has data and says so explicitly in the response.
- A subtle React/Leaflet bug kept resetting our polygon-drawing tool after every second click — caused by an unrelated state update re-triggering a plugin-teardown effect. Fixed by storing the callback in a ref instead of a dependency array.
Accomplishments that we're proud of
Building a heatwave index adapted from real published meteorological methodology instead of an arbitrary threshold; giving people three genuinely different ways to pick any location instead of a fixed preset list; and being explicit, in the code and in the UI itself, about exactly where our models are documented starting points rather than finished science — including a livability feature that states its own limitations directly in its response rather than only in documentation.
What we learned
That the "boring" infrastructure work — data-lag handling, permission models, graceful degradation — takes as much engineering care as the headline feature, and that being upfront about a model's limitations (rather than hiding them) makes the whole system more trustworthy, not less impressive.
What's next for tahadhari-joto
USSD support alongside SMS for two-way interaction without a push message; proper per-region calibration of our severity thresholds using historical data instead of fixed cutoffs; crop-growth-stage-aware risk scoring; a multi-model CMIP6 ensemble instead of a single model; and a genuine short-term weather forecast layer, which is a different kind of data source from everything we've built so far and a clear next step rather than something we quietly skipped.
Built With
- africa's-talking
- css
- era5-land
- fastapi
- github
- google-earth-engine
- javascript
- leaflet-draw
- leaflet.js
- modis
- nasa-cmip6
- python
- react
- recharts
- render
- vercel
- vite

Log in or sign up for Devpost to join the conversation.