-
-
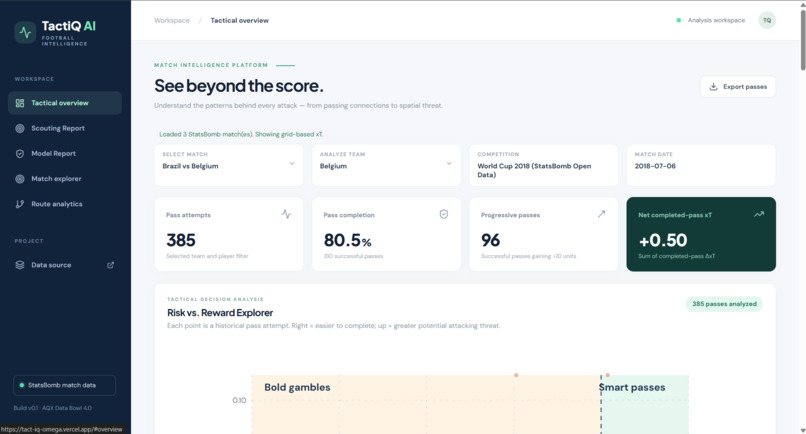
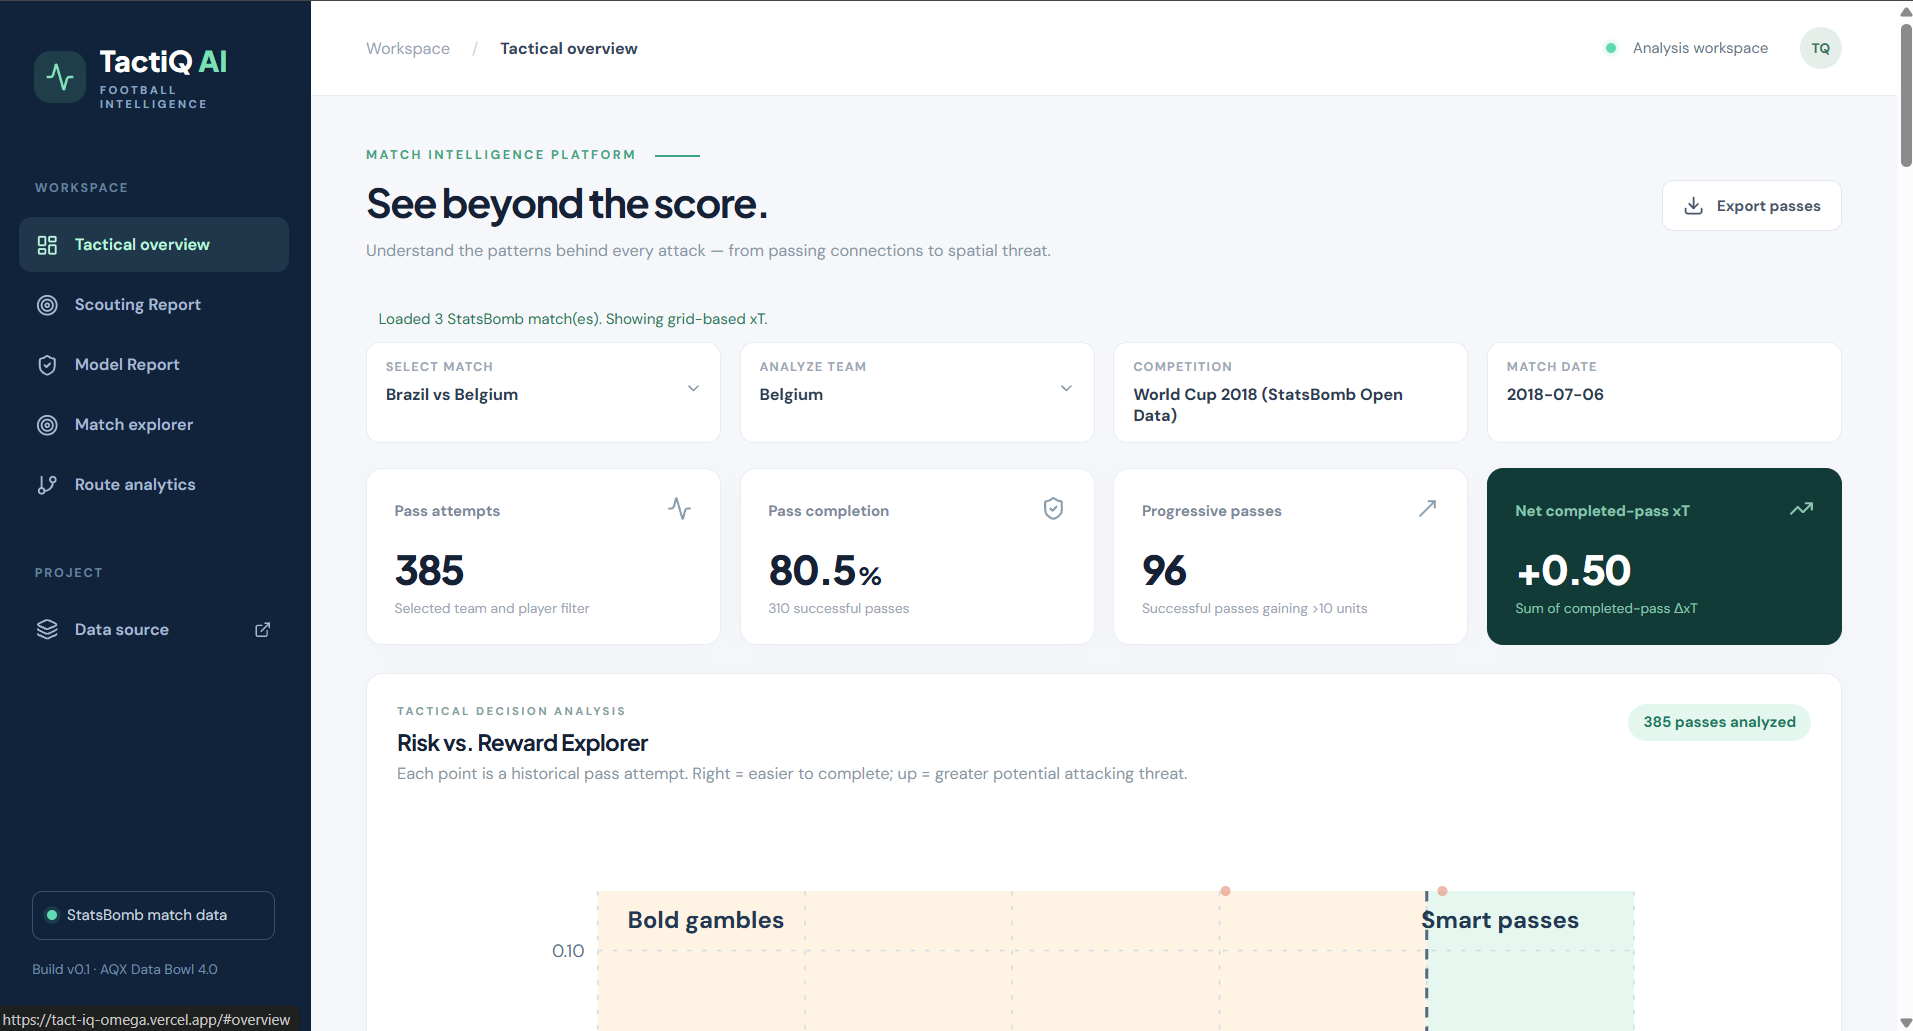
The Dashboard
-
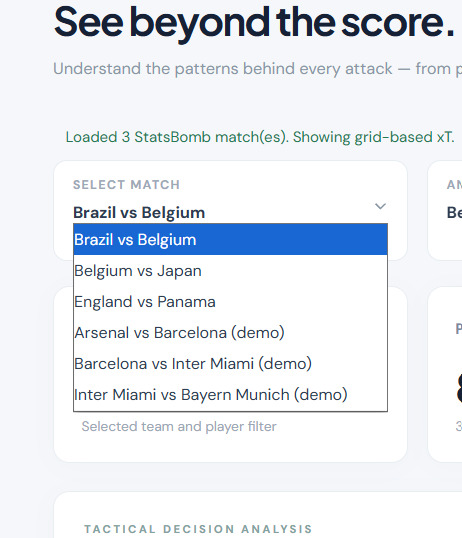
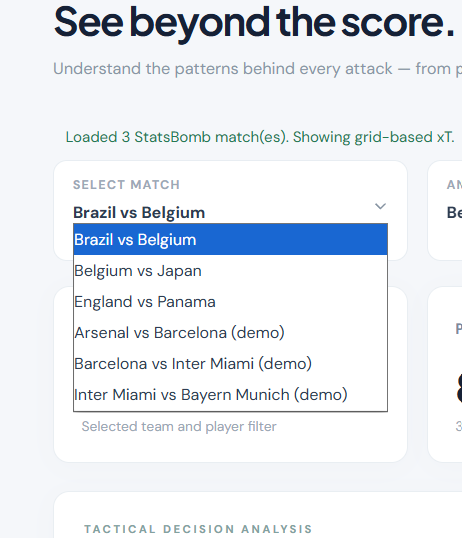
Choosing the match and teams
-
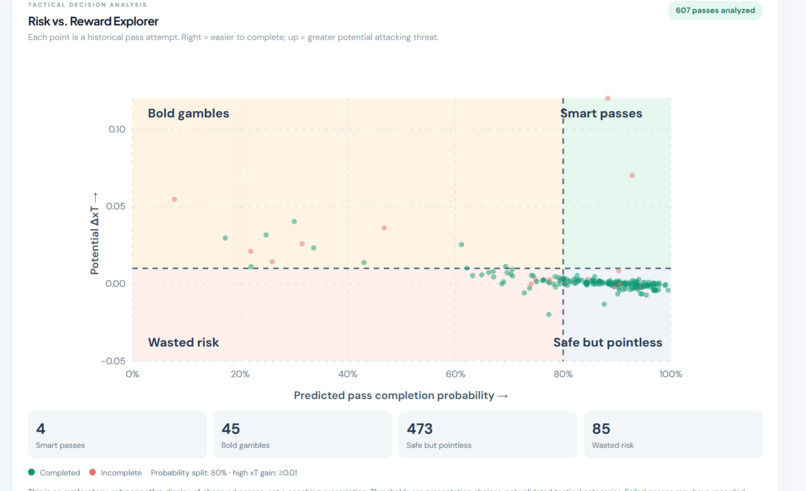
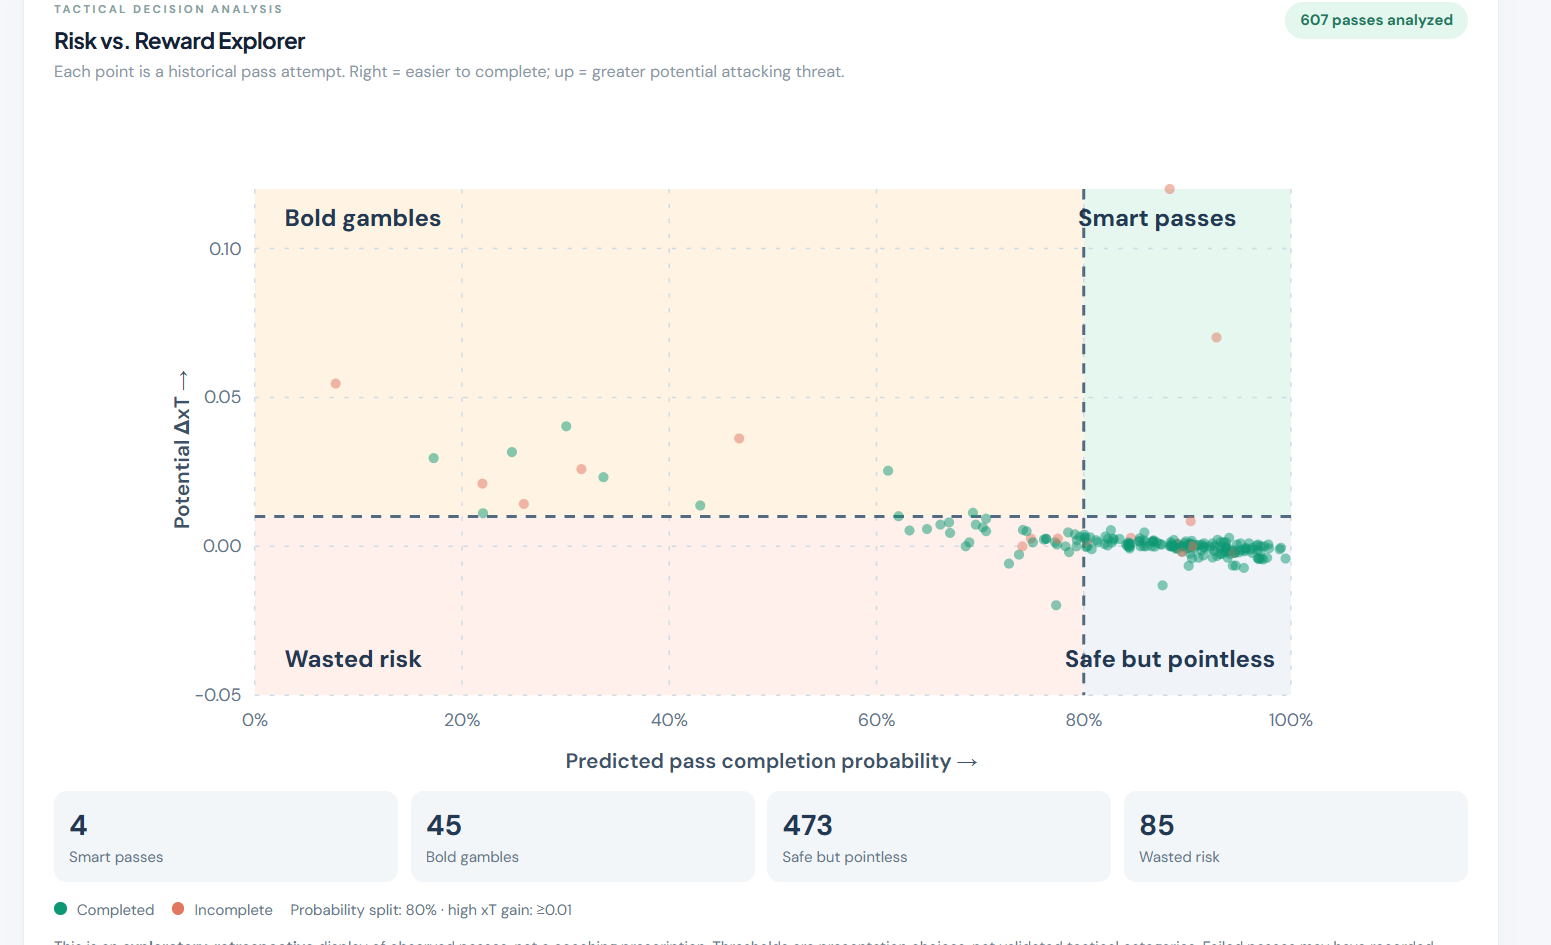
compares historical pass-completion probabilities with potential attacking threat gains, helping identify different patterns of passing risk
-
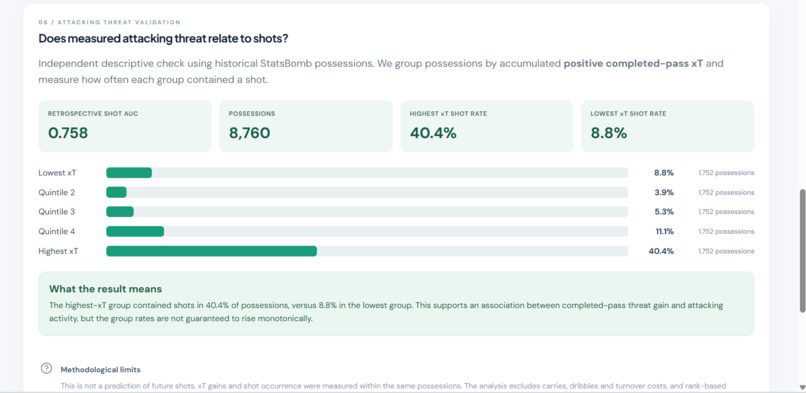
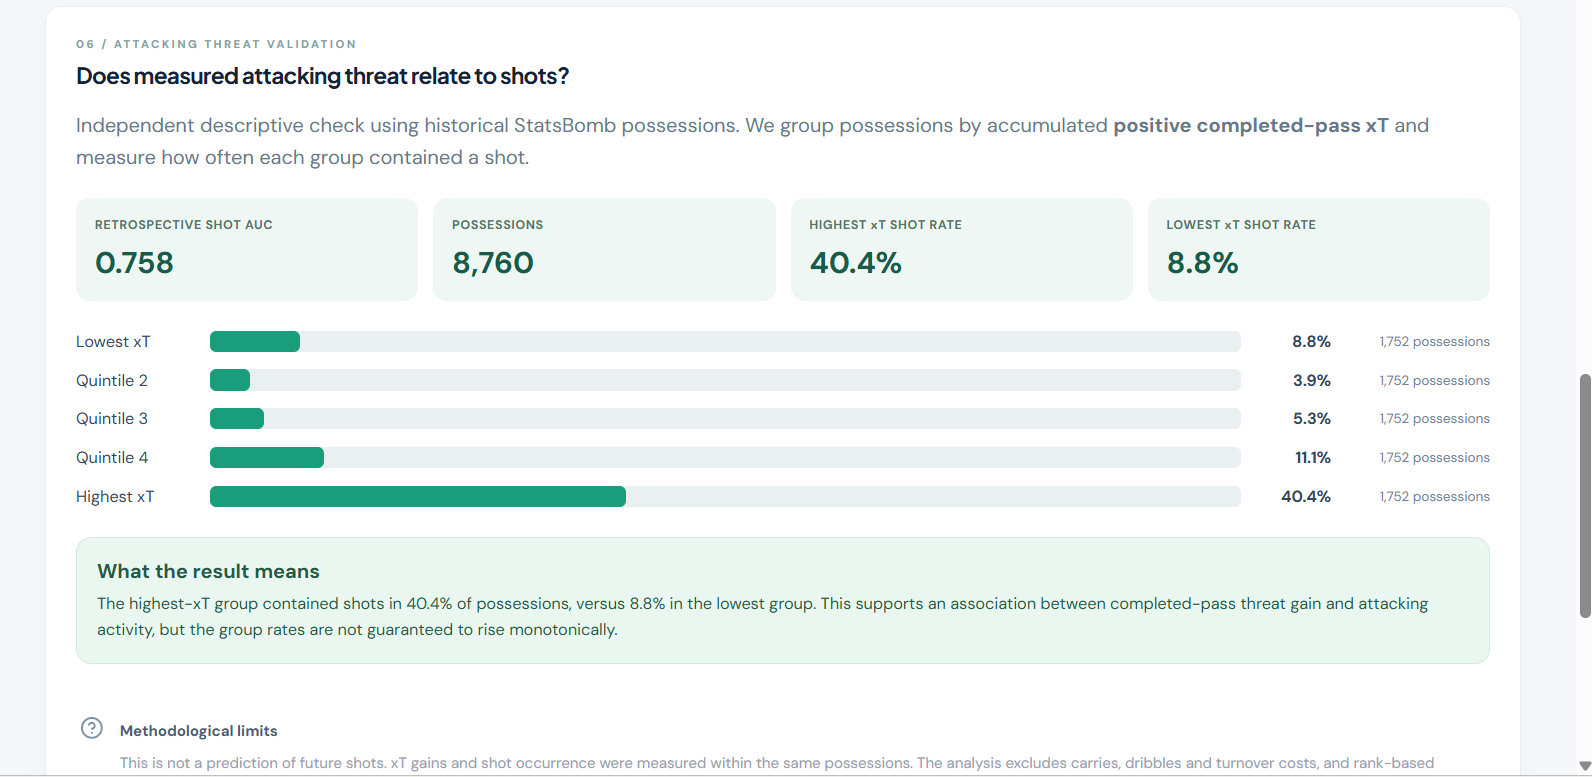
provides useful evidence of an association between passing threat and attacking activity
-
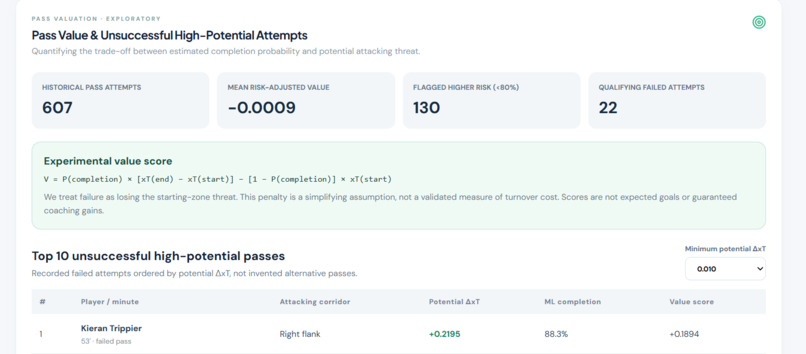
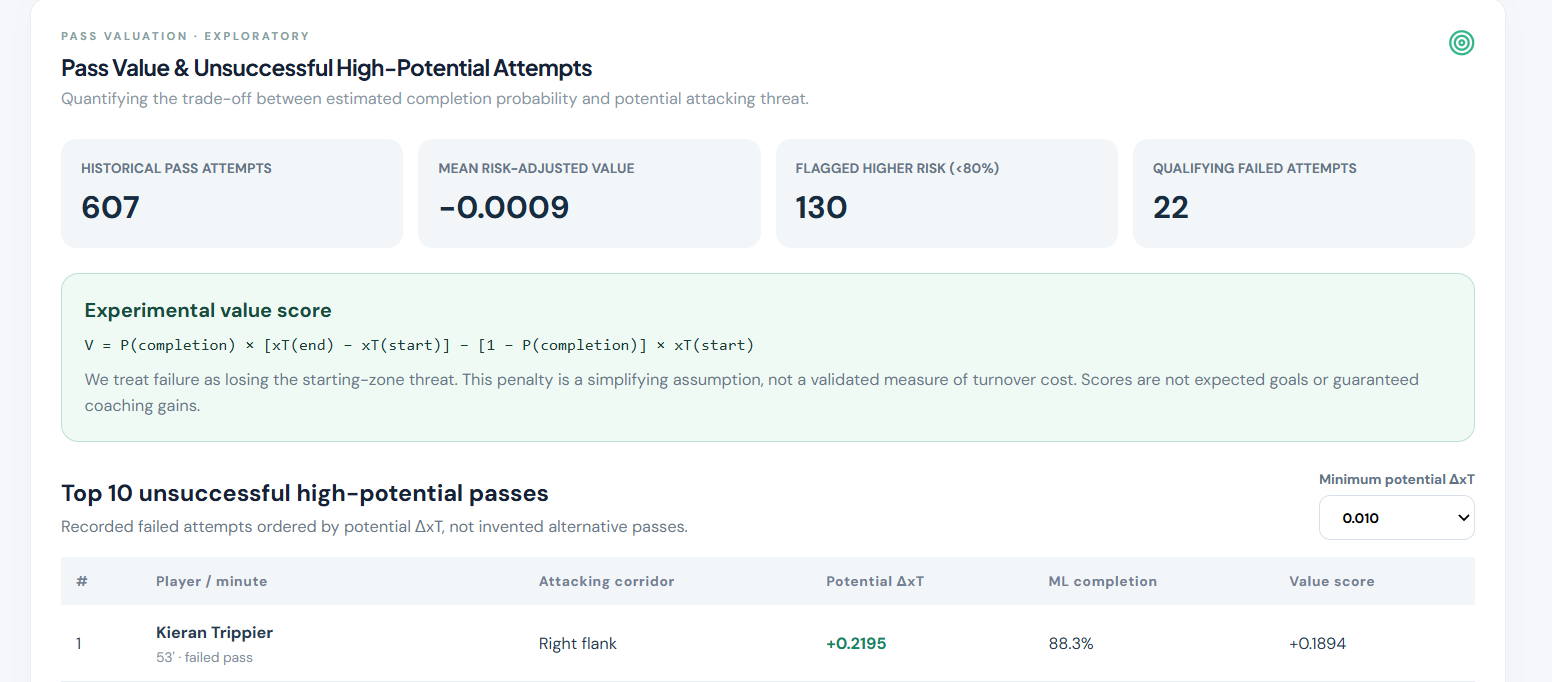
Visual of Pass values and unsuccessful high potential attempts
-
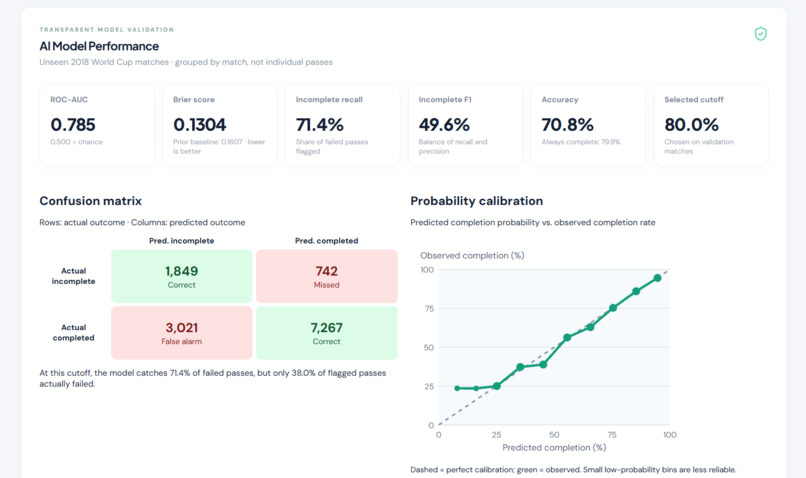
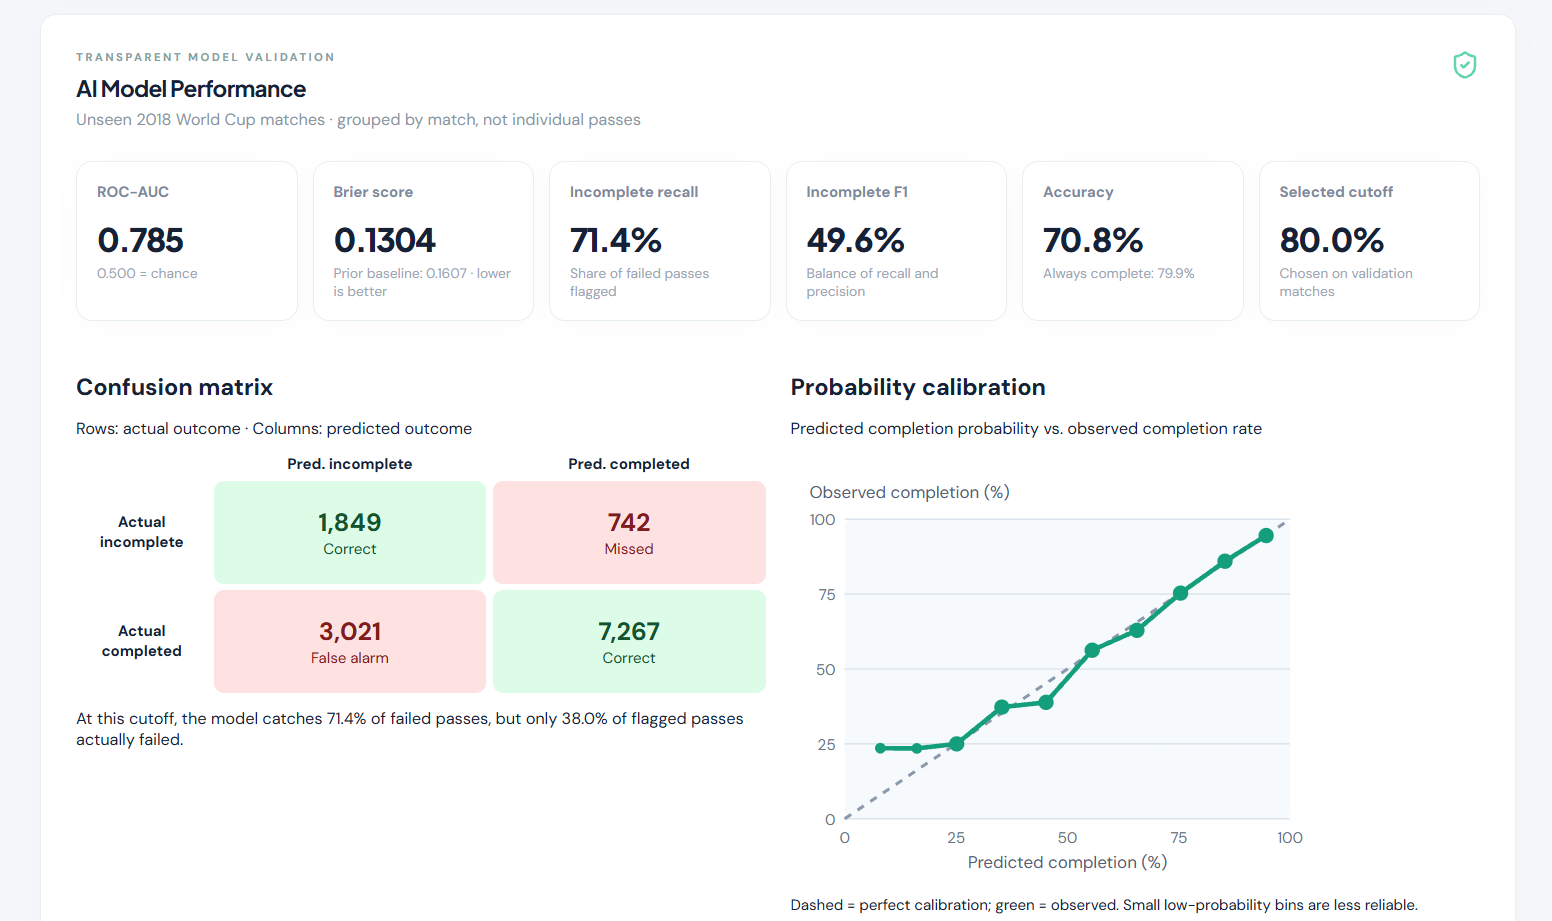
AI model Performance
-
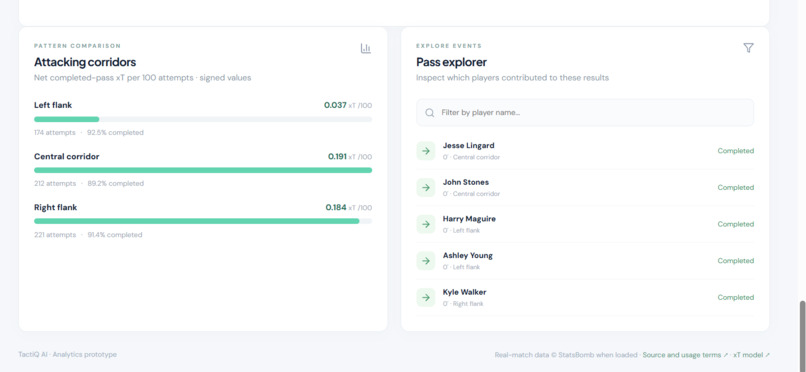
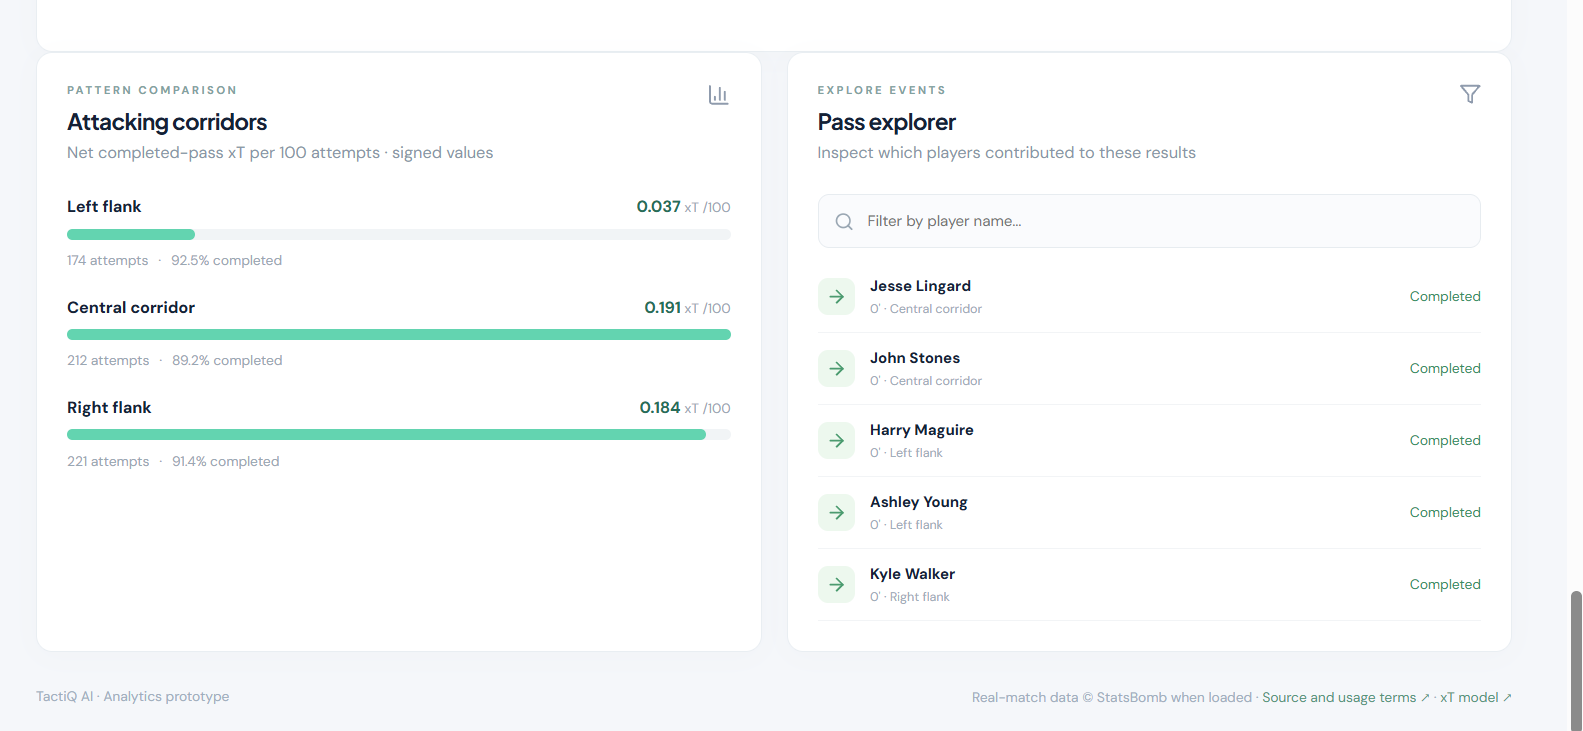
Visual of Attacking Corridors
-
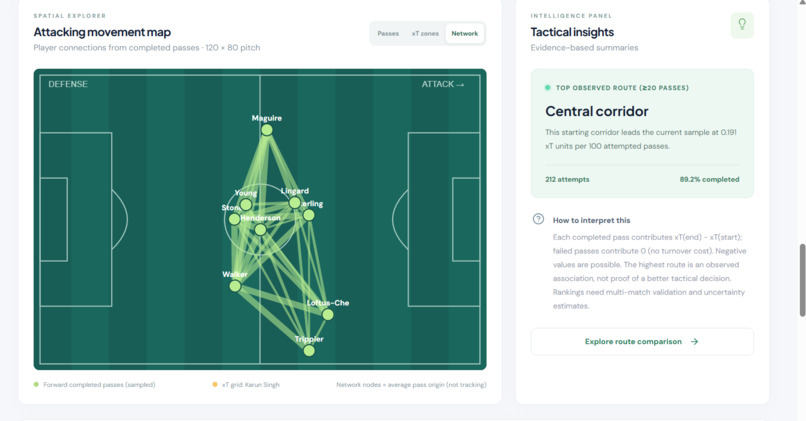
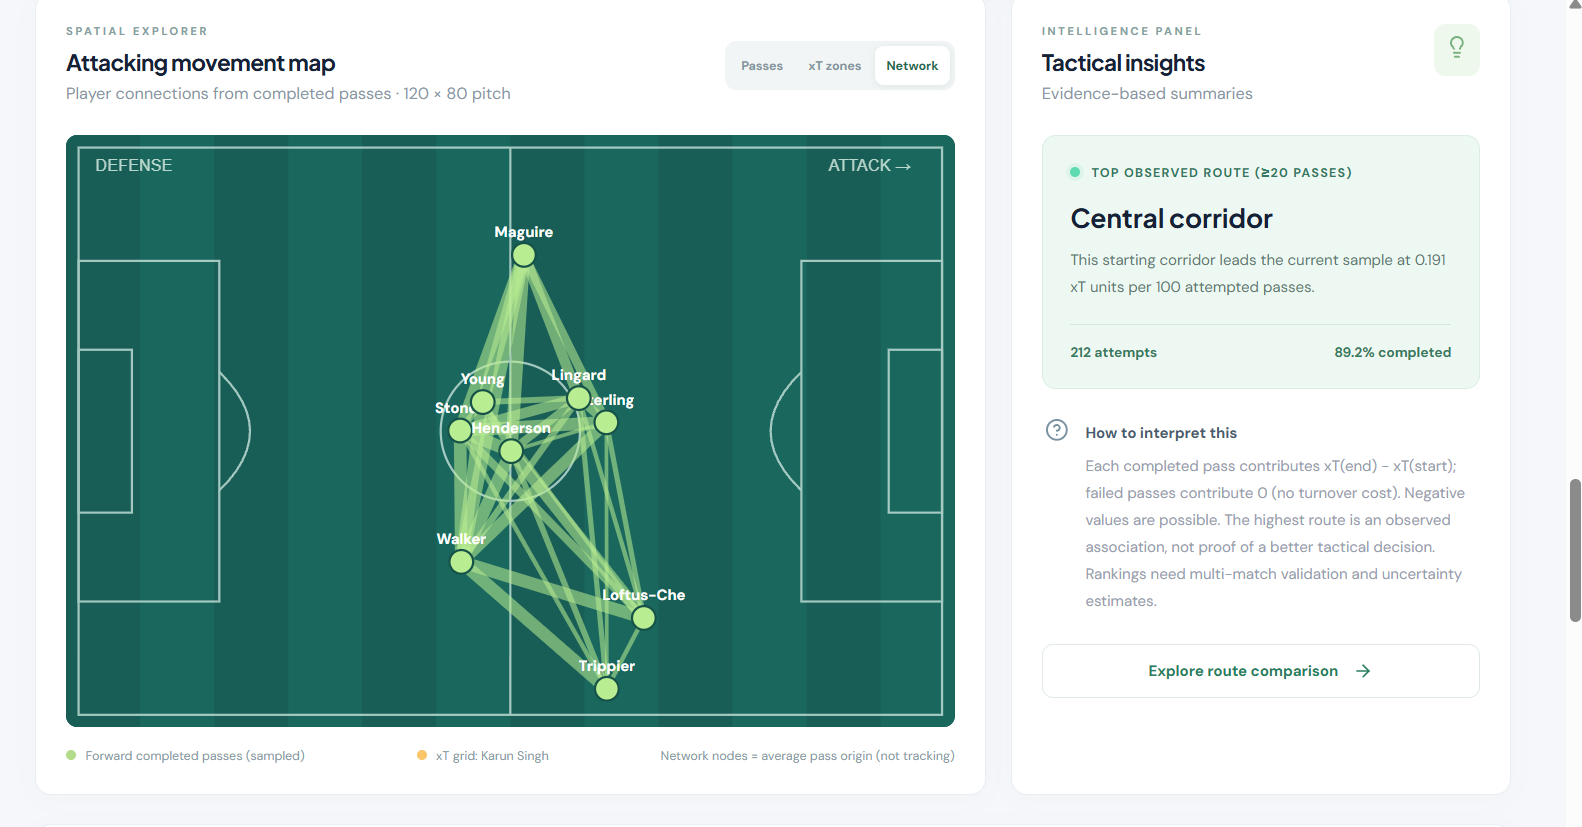
Attacking movement map
-
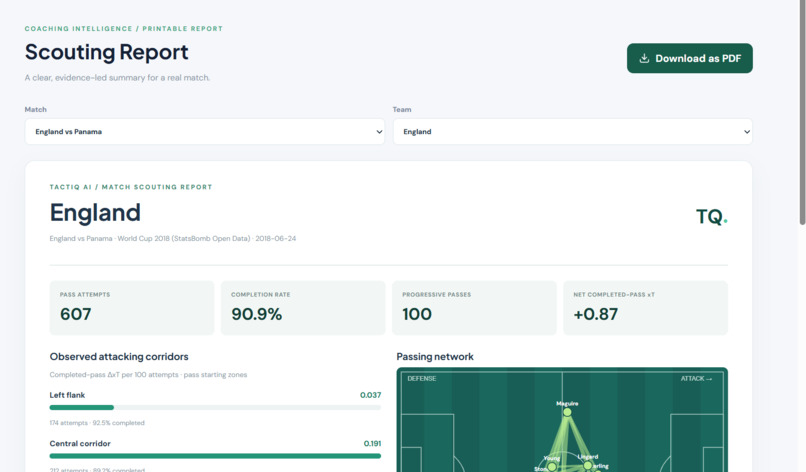
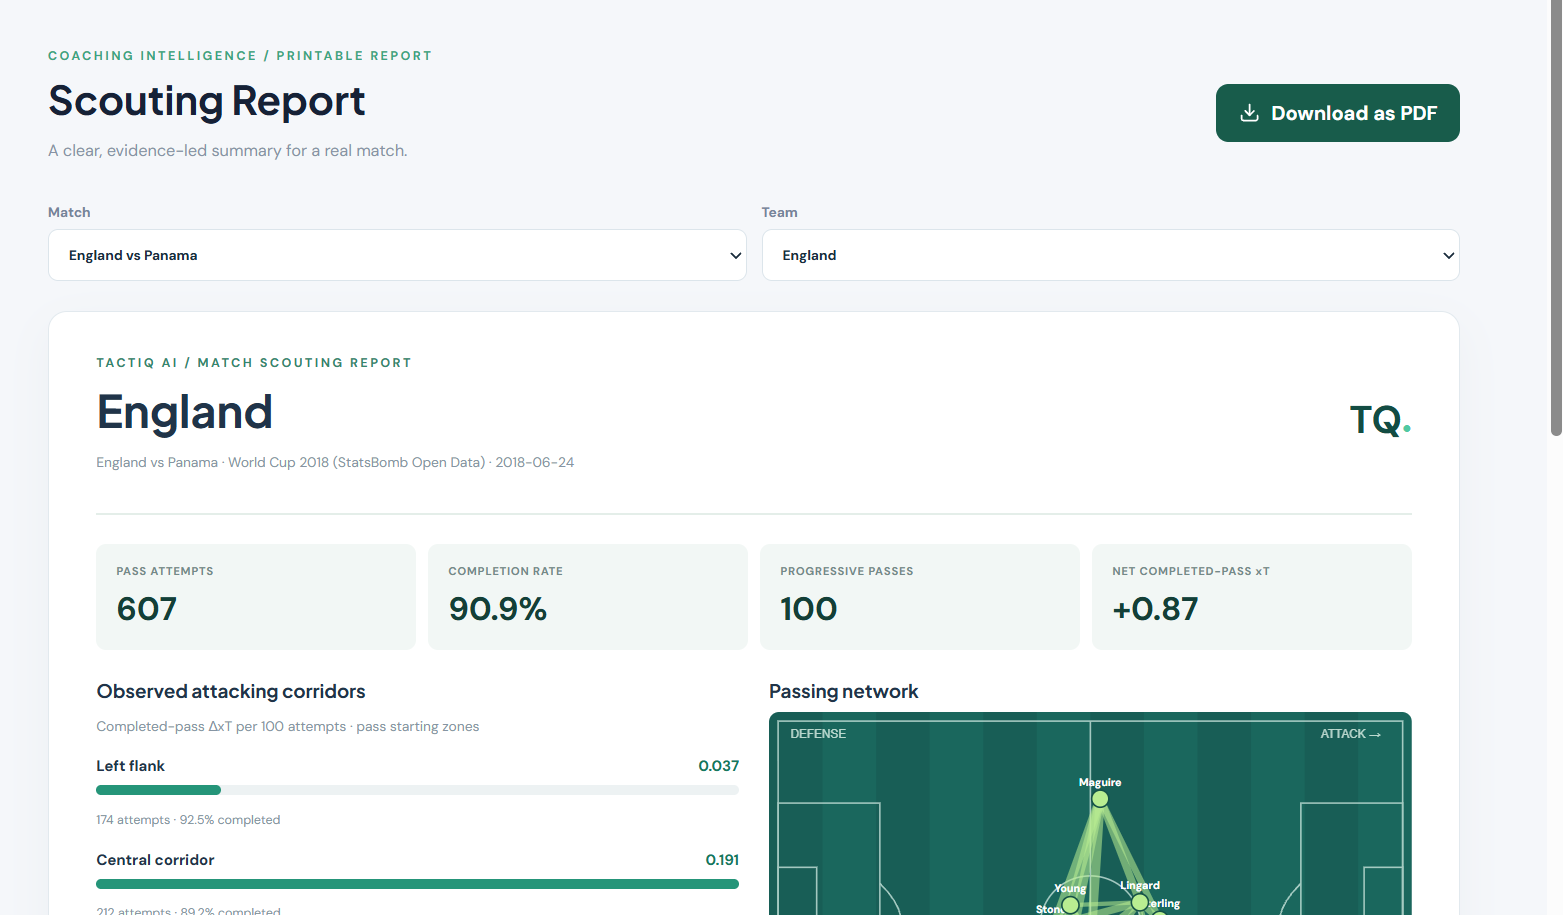
actiQ AI turns these analyses into a scouting report
-
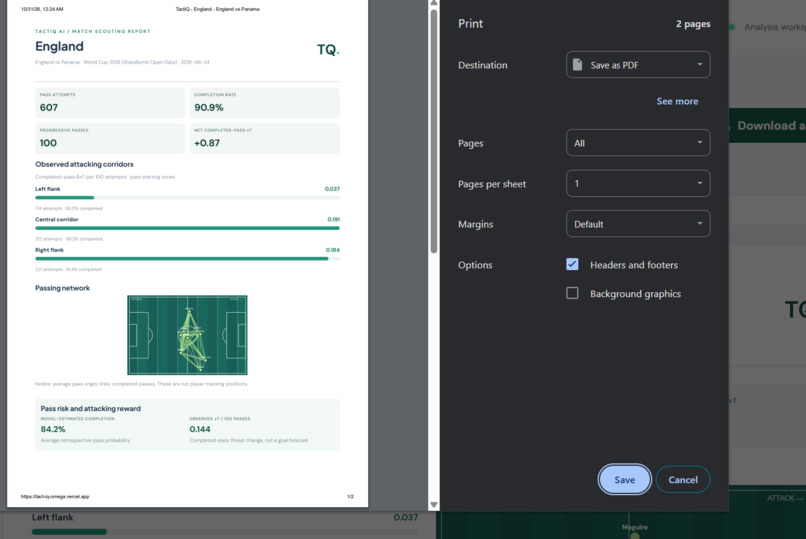
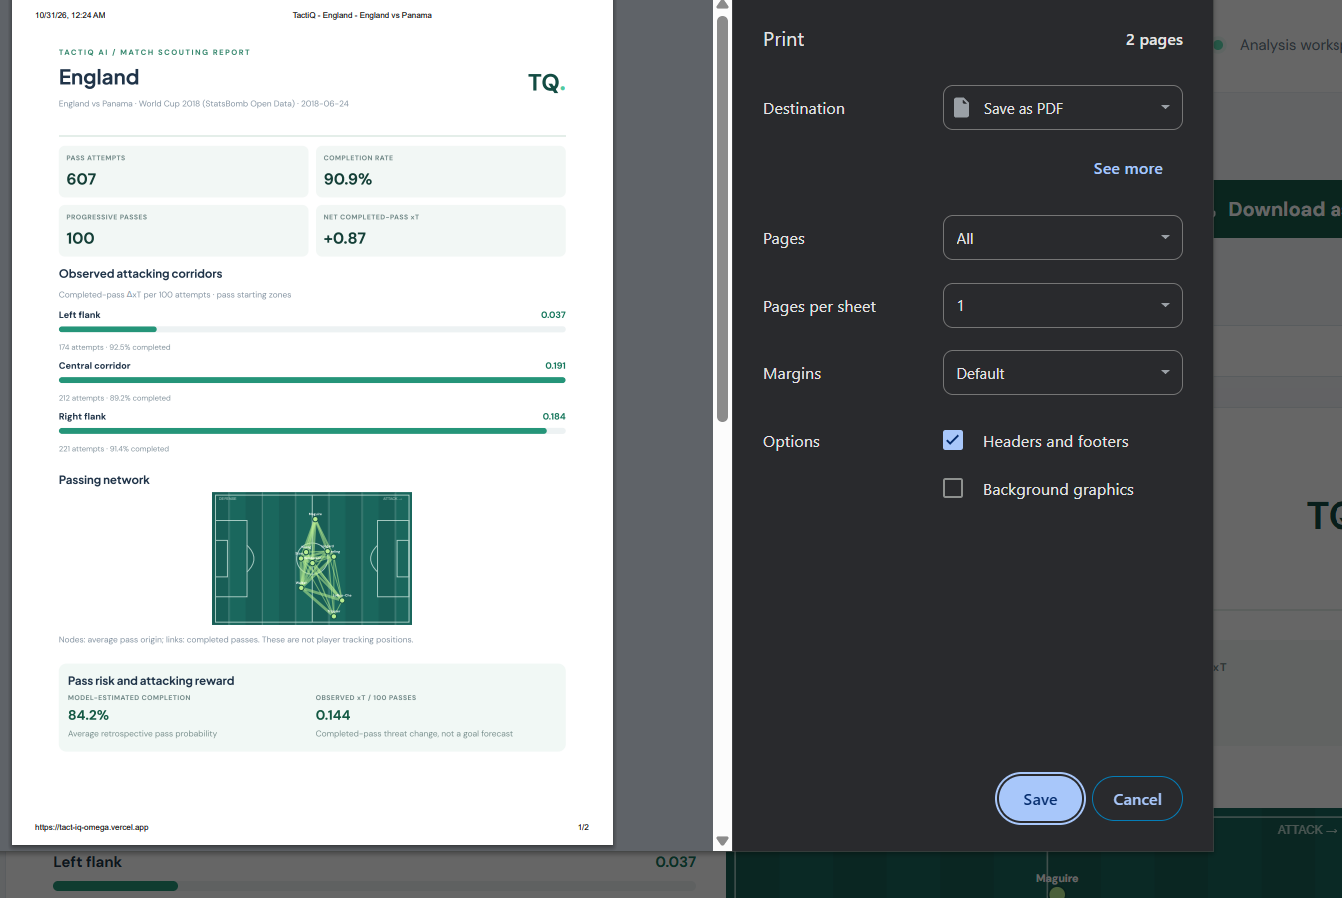
Users can save the report as a PDF for further review.
Inspiration
Football is more than goals, possession, and completed passes. A team can dominate possession and still struggle to create meaningful scoring opportunities. This made me ask a simple question: What if we could measure not just how much a team passes, but how valuable those passes actually are? Traditional football statistics tell us what happened, but they don't always explain why certain attacking strategies worked or failed. I wanted to bridge that gap by transforming raw match data into meaningful tactical insights. That's how TactiQ AI was born.
What it does
TactiQ AI is an interactive football intelligence platform I developed to help coaches, analysts, and football enthusiasts explore attacking performance beyond traditional match statistics. Using real StatsBomb 2018 FIFA World Cup event data, I combined spatial analysis, Expected Threat (xT), and machine learning to explain passing patterns and their potential attacking value. The platform includes: Interactive Match Dashboard: Explore World Cup matches, switch between teams, and examine passing accuracy, progressive passes, and attacking threat. Passing Networks and Pitch Visualization: Visualize player connections, passing movements, and dangerous attacking zones. Expected Threat (xT) Analysis: Measure how completed passes change the attacking threat associated with different areas of the pitch. AI Pass Intelligence: Estimate historical pass-completion probabilities using a trained logistic regression model. Risk vs. Reward Explorer: Compare estimated completion probability against potential threat gain and group passes into four exploratory categories. Pass Value Analysis: Calculate an experimental risk-adjusted value score and identify unsuccessful passes with potentially interesting attacking endpoints for further investigation. Automated Scouting Reports: Generate match-specific reports containing passing statistics, networks, and three data-driven tactical takeaways, with the option to export as PDF. Model Report: Examine the machine learning model's performance, calibration, confusion matrix, feature coefficients, and limitations. Threat Validation: Explore how accumulated positive passing xT relates to shot occurrence in historical possessions. Instead of simply presenting charts, my goal was to connect statistics with interpretable observations that help users identify patterns worth investigating through tactical analysis and match footage.
How I built it
I built TactiQ AI as a web-based sports analytics application, combining a React frontend with a Python-based data processing and machine learning pipeline.
- Data collection and preparation I used StatsBomb Open Data from the 2018 FIFA World Cup to obtain real match events, including pass locations, endpoints, outcomes, player information, and match minutes. Using Python, Pandas, and NumPy, I processed the data into structured formats suitable for training and visualization. My machine learning dataset included 49,267 passes across 50 matches.
- Expected Threat analysis I integrated Karun Singh's published 12 × 8 Expected Threat grid, mapping event coordinates to pitch zones and calculating the change in xT between the starting and ending locations of completed passes. This allowed me to compare attacking progression across different pitch corridors rather than relying entirely on completion percentages.
- Machine learning model I trained a standardized logistic regression classifier using Scikit-learn to estimate historical pass-completion probabilities. The model uses six features: starting x-coordinate, starting y-coordinate, horizontal displacement, vertical displacement, pass distance, and match minute. To evaluate the model more reliably, I split the data by match rather than randomly separating individual passes. I also used separate validation matches to select the classification threshold before evaluating on held-out matches. On 12,879 passes from 13 held-out matches, my model achieved: ROC-AUC: 0.7846 Brier score: 0.1304, compared with 0.1607 for a constant-prior baseline Log loss: 0.4127, compared with 0.5021 for the baseline Incomplete-pass recall: 71.36% at my validation-selected 80% completion-probability threshold My model is designed for retrospective analysis. Because it uses recorded endpoints, including on unsuccessful passes, I do not present it as a validated real-time passing recommendation system.
- Interactive frontend I developed the interface using React, TypeScript, Vite, and CSS. I built interactive pitch visualizations, passing networks, tactical comparisons, risk-versus-reward scatterplots, and detailed model evaluation charts using React components and SVG. I also implemented automatic scouting summaries and browser-based PDF export.
- Validating my football analytics I wanted to investigate whether my Expected Threat analysis was related to actual attacking outcomes. I conducted a retrospective study of 8,760 possessions, grouping them into five quintiles based on accumulated positive passing xT. Possessions in the highest-xT quintile contained shots 40.4% of the time, compared with 8.8% in the lowest quintile. The retrospective shot-discrimination AUC was 0.7575. Because xT and shot occurrence were measured within the same possessions, these results demonstrate association rather than prospective predictive performance or causality.
- Deployment I managed the project using Git and GitHub and deployed the completed application to Vercel. I also improved the responsive layout to make the dashboard accessible on mobile devices. Tech stack: React, TypeScript, Vite, CSS, Python, Pandas, NumPy, Scikit-learn, StatsBomb Open Data, Expected Threat (xT), Git, GitHub, and Vercel.
Challenges I ran into
One of my biggest challenges was turning complex football data into insights that are both meaningful and easy to understand. At first, calculating passing accuracy and displaying a passing network seemed straightforward. However, I quickly realized that high completion rates do not necessarily indicate effective attacking play. This pushed me to incorporate Expected Threat and analyze how passes contribute to spatial progression. Another major challenge was developing a machine learning model that could be evaluated fairly. A high accuracy score alone would have been misleading because completed passes were much more common than incomplete passes. I therefore evaluated my model using ROC-AUC, Brier score, log loss, precision, recall, F1-score, and comparisons against simple baselines. I also had to make a trade-off when selecting the prediction threshold. Detecting more failed passes increased the number of false alarms. I chose my threshold using validation data instead of optimizing directly on the final test set. A particularly important challenge involved understanding the limitations of event data. For an incomplete pass, the recorded endpoint might not represent where the player intended to send the ball. This means I cannot reliably simulate alternative passing decisions from these features alone. I addressed this by labeling my risk and pass-value analyses as retrospective and exploratory. Validating Expected Threat was another challenge. Rather than assuming that higher xT automatically meant better attacking performance, I tested its association with shot occurrence. I found a substantial difference between the highest and lowest xT groups, although the pattern was not perfectly monotonic across all groups. Finally, integrating the analytical pipeline into a responsive web application required me to resolve deployment issues, missing JSON data, and mobile layout problems. I worked through these issues until the core dashboard, reports, and validation results were accessible through my deployed website.
Accomplishments that I'm proud of
My biggest accomplishment is transforming TactiQ AI from an idea into a functional, publicly accessible football intelligence platform using real match data. I'm especially proud of five achievements:
- Building more than a statistics dashboard Instead of stopping at possession and passing percentages, I combined spatial analysis, machine learning, Expected Threat, and exploratory pass valuation into one platform.
- Training and evaluating my own machine learning model I developed a pass-completion model using nearly 50,000 historical passes and evaluated it on unseen matches. Achieving a 0.7846 ROC-AUC and improving probability scores over a simple baseline was an important milestone.
- Validating my Expected Threat analysis I analyzed 8,760 possessions and found that the highest positive-xT group had a substantially higher observed shot rate than the lowest group. I'm particularly proud of this validation work because it connects my analytical metric with measurable match events while acknowledging the limitations of the study.
- Making football analytics explainable I created a dedicated Model Report showing probability calibration, feature coefficients, classification errors, and evaluation metrics. I also built scouting reports that translate match data into understandable tactical observations.
- Deploying a complete interactive prototype independently I built and deployed TactiQ AI as a solo project, from data processing and machine learning to frontend development and deployment. Seeing the application work outside my development environment was one of the most rewarding milestones.
What I learned
Building TactiQ AI taught me that good sports analytics is not just about building models or producing attractive visualizations. It is about asking the right questions, testing assumptions, and communicating results responsibly. From the machine learning side, I learned why choosing the right evaluation metrics matters. My dataset contained more completed than incomplete passes, which showed me why accuracy alone can give an incomplete picture of model quality. I gained practical experience with data preprocessing, feature engineering, match-grouped training and evaluation, classification thresholds, calibration, and model interpretation. From the football analytics side, I learned how Expected Threat provides a different perspective on attacking performance. Two teams can complete a similar number of passes while generating different levels of attacking progression. I also learned that correlation does not imply causation. Even when high-xT possessions are associated with more shots, that does not prove that an individual passing decision caused the outcome. On the development side, I strengthened my skills in React, TypeScript, Python integration, data visualization, GitHub workflows, responsive design, and Vercel deployment. Most importantly, I learned to be transparent about what my models can and cannot tell me.
What's next for TactiQ AI
My current prototype demonstrates how historical football event data can be transformed into interactive tactical insights. My next goal is to make the analysis richer, more reliable, and more useful in real football environments.
- Incorporate richer tactical features I want to extend my models with defensive pressure, player positioning, pass height, game state, and additional contextual information when suitable datasets are available.
- Move toward real-time tactical intelligence My current model is retrospective. A future version could use pre-pass information and player tracking data to evaluate available passing options without relying on recorded post-event endpoints.
- Expand Expected Threat modeling I plan to incorporate carries and other on-ball actions, study turnovers more carefully, and evaluate attacking threat across additional competitions and seasons.
- Add deeper player and team comparisons I want to introduce player scouting profiles, passing performance benchmarks, multi-match team comparisons, and uncertainty-aware rankings.
- Improve AI-generated tactical explanations I aim to make the scouting reports more contextual, allowing analysts to ask questions about passing patterns and receive explanations grounded in the underlying match data. Ultimately, my vision is to develop TactiQ AI into an accessible football intelligence platform that helps people move beyond the scoreboard and better understand the decisions and patterns shaping the game.
Built With
- css3
- csv
- git
- github
- html5
- javascript
- json
- logisticregression
- numpy
- python
- react
- scikit-learn
- svg
- typescript
- vercel
- vite

Log in or sign up for Devpost to join the conversation.