Inspiration
STEM is deeply visual. Students are often expected to understand circuits, graphs, cell diagrams, geometry figures, and other visual models in order to learn core concepts. But for blind and low-vision students, a standard diagram does not provide the same educational value because it is usually designed for sighted learners.
Accessible tactile diagrams exist, but they are often slow, manual, and difficult to create at scale. That means many students do not get the opportunity to interact with diagrams in the same way their sighted peers do. I built Tactilify to make STEM diagrams more accessible, faster to adapt, and easier for teachers, students, and support staff to use.
What it does
Tactilify turns STEM diagrams into accessible learning materials for blind and low-vision students.
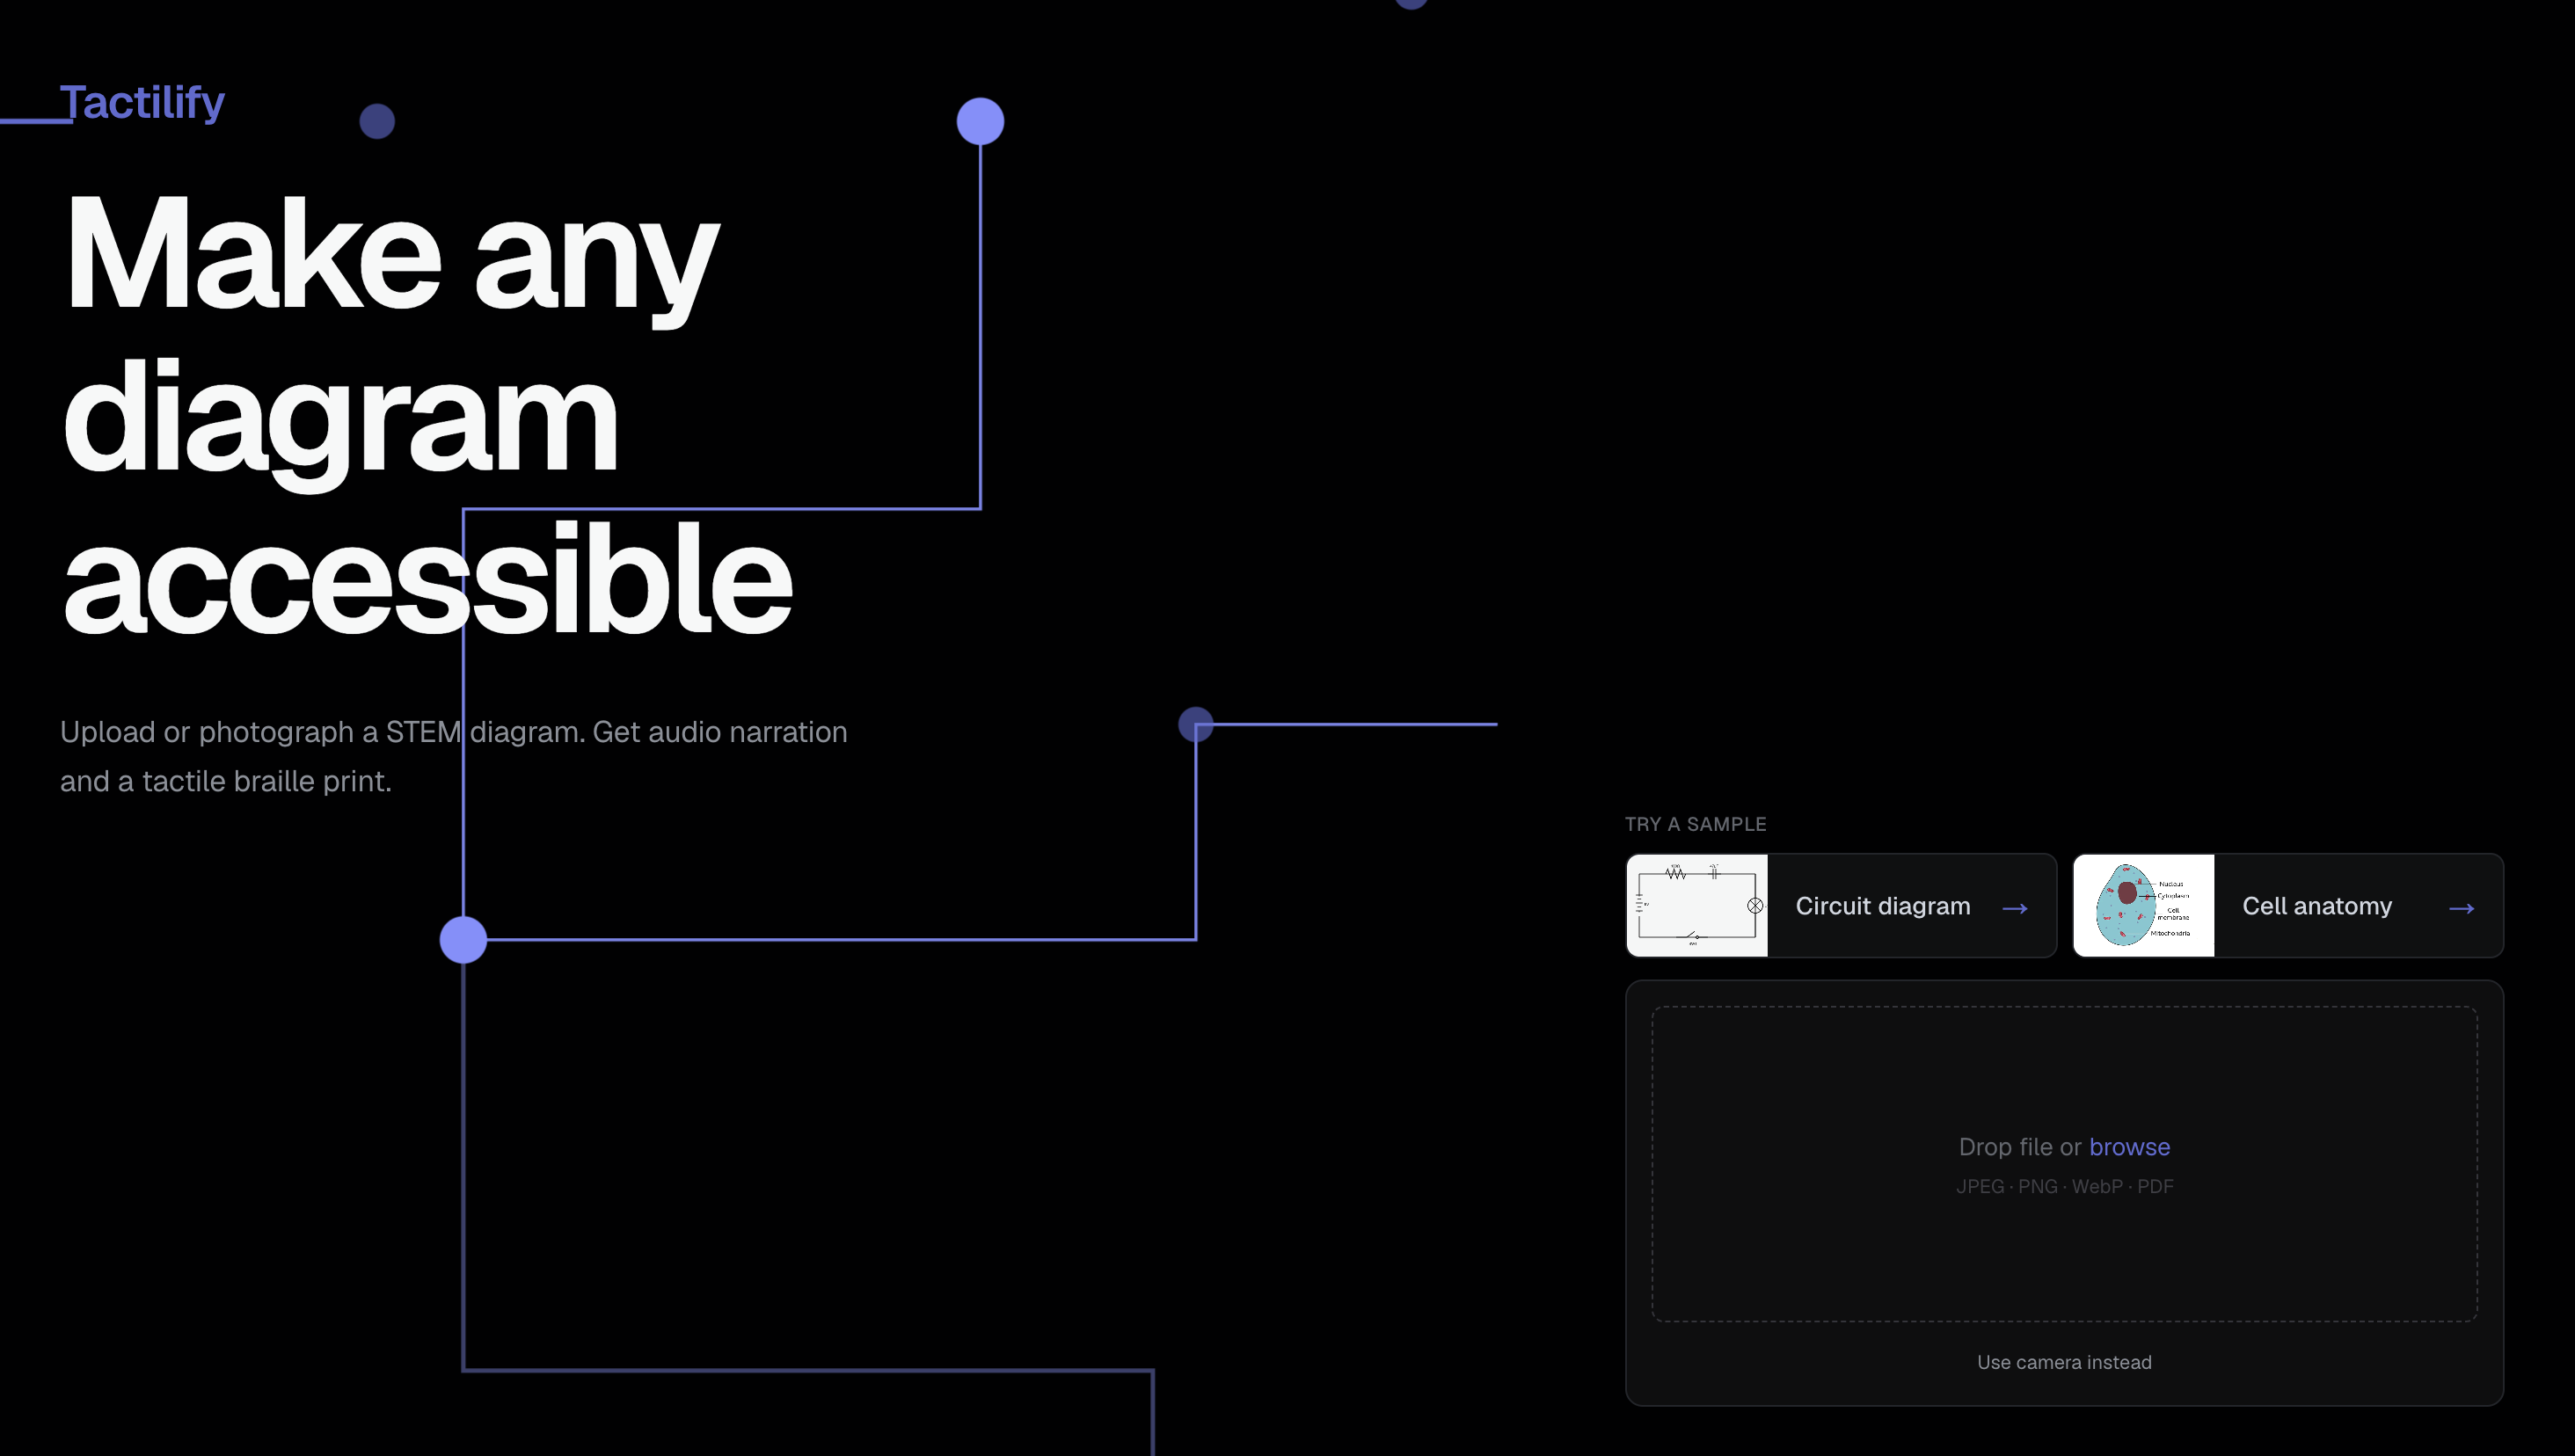
Users can upload or photograph a STEM diagram, such as a circuit diagram or cell anatomy diagram. Tactilify analyzes the image, identifies the type of diagram, and maps out the important spatial and conceptual relationships. AI then generates two accessible outputs: an audio walkthrough of the original diagram and a printable tactile SVG diagram designed for exploration by touch.
The tactile SVG simplifies unnecessary visual decoration, preserves key educational information, includes Braille labels, and follows BANA-aligned tactile graphic principles such as spacing, clarity, and touch-readability. Tactilify also includes a custom, AI powered SVG editor, allowing teachers or users to add, remove, and adjust labels before downloading or printing the final diagram on swell paper.
How we built it
I built Tactilify as a web application using Next.js, React, TypeScript, Tailwind, and shadcn for the frontend. For file handling and image processing, I used tools like pdfjs-dist, sharp, file-type, and canvas-related libraries. I used the Anthropic Claude API to analyze STEM diagrams, extract structure, reason about spatial and conceptual relationships, and generate both the audio walkthrough content and the tactile-ready SVG output.
A major part of the project was prompt engineering the AI to think beyond simple image description. Instead of only asking the model to describe what it sees, I designed the system to identify educationally meaningful components, remove unnecessary visual details, preserve important relationships, and generate outputs that are useful for tactile exploration.
I also built a custom, extended SVG editor using Fabric.js as a simple base so that the generated diagrams are not treated as final, perfect AI outputs. Teachers and users can review the diagram, add or remove labels themselves or with the help of AI, and improve the output before printing or sharing it. I also used accessibility-focused tools such as axe and jsx-a11y to help make the application itself more accessible.
Challenges I ran into
The hardest challenge was turning a visual STEM diagram into a simplified tactile diagram without losing educational meaning. A tactile graphic cannot just be a direct copy of the original image. It needs enough spacing, clear labels, simplified shapes, and a structure that can be followed by touch alone.
I also ran into the challenge of AI inconsistency. Sometimes the model would hallucinate parts of a diagram, include too much visual clutter, or generate SVGs that were not clean enough for tactile use. This made it clear that AI alone was not enough. Although proper prompt engineering and image preprocessing was important, the human validation layer became an important part of the product because educators need to be able to review, correct, and improve the output.
Another challenge was thinking through product edge cases as a solo builder. I had to consider what happens if a user uploads the wrong file type, reruns an analysis, hits an error, leaves and comes back, or expects their work to be saved. Building Tactilify meant thinking not just like an engineer, but also like a product manager, designer, accessibility advocate, and user.
Accomplishments that I'm proud of
I'm proud that Tactilify addresses a real accessibility gap in STEM education. Instead of building another flashcard or quiz generator, we created a tool with a niche but focused educational use case: helping blind and low-vision students access diagrams that are usually locked behind visual formats.
I'm especially proud of building an end-to-end workflow: upload a STEM diagram, generate an audio walkthrough, create a tactile SVG, edit the diagram, and download a printable output. We tested the tool on circuit diagrams and cell anatomy diagrams, showing that Tactilify can support multiple types of STEM visuals.
I'm also proud of the custom-made, AI powered svg editor I built. Since accessibility work needs reliability and care, I wanted Tactilify to give users control instead of pretending AI output is always perfect.
What we learned
I learned that accessibility is not just about describing an image. For STEM diagrams, accessibility requires structure, spatial reasoning, simplification, and careful preservation of educational meaning. A good tactile diagram needs to be understandable by touch, not just visually similar to the original.
I also learned a lot about building AI-powered applications with non-deterministic outputs. Since AI can be inconsistent, we had to think carefully about validation, retries, formatting, and user editing. The project taught us that responsible AI products should not only generate outputs, but also create ways for humans to verify and improve them.
Because this was built solo, I also learned how to balance product design, engineering, accessibility research, and testing at the same time. I had to constantly ask: “What would a teacher expect here?” and “What would a blind or low-vision student need from this output?”
What's next for Tactilify
Next, I want to make Tactilify more reliable, more customizable, and easier to use in real classrooms. I would like to add LMS integrations so teachers can generate and share accessible diagrams directly through platforms they already use.
I also want to add stronger AI validation features, such as automatically checking whether diagrams have enough spacing, whether Braille labels are placed clearly, and whether the tactile output may be too cluttered. Another future direction is adding subject-specific templates for diagrams like circuits, biology diagrams, graphs, and geometry figures so that outputs can be more accurate for each STEM domain.
Longer term, I would like to test Tactilify with teachers, accessibility specialists, and blind or low-vision students to get real feedback. The goal is to make Tactilify not just an AI tool, but a practical classroom accessibility platform that helps every student learn STEM through diagrams, whether or not they can see them.
AI Tools Used
Claude Anthropic API and SDK
Github
Built With
- next.js
- react
- tailwind

Log in or sign up for Devpost to join the conversation.