Inspiration
Football teams are often described using broad labels such as “possession-based,” “direct,” “high pressing,” or “counterattacking.” These descriptions are useful, but they are also subjective and often difficult to compare across teams.
I wanted to build a system that represents tactical style using measurable match-event data instead of relying only on labels or opinions.
The goal became Tactical Style Fingerprint: a tool that converts football event data into a small set of interpretable tactical dimensions, compares teams mathematically, and then uses AI to explain why two teams appear similar or different.
What it does
The application currently analyses all 20 teams from the 2015/16 Premier League using StatsBomb Open Data.
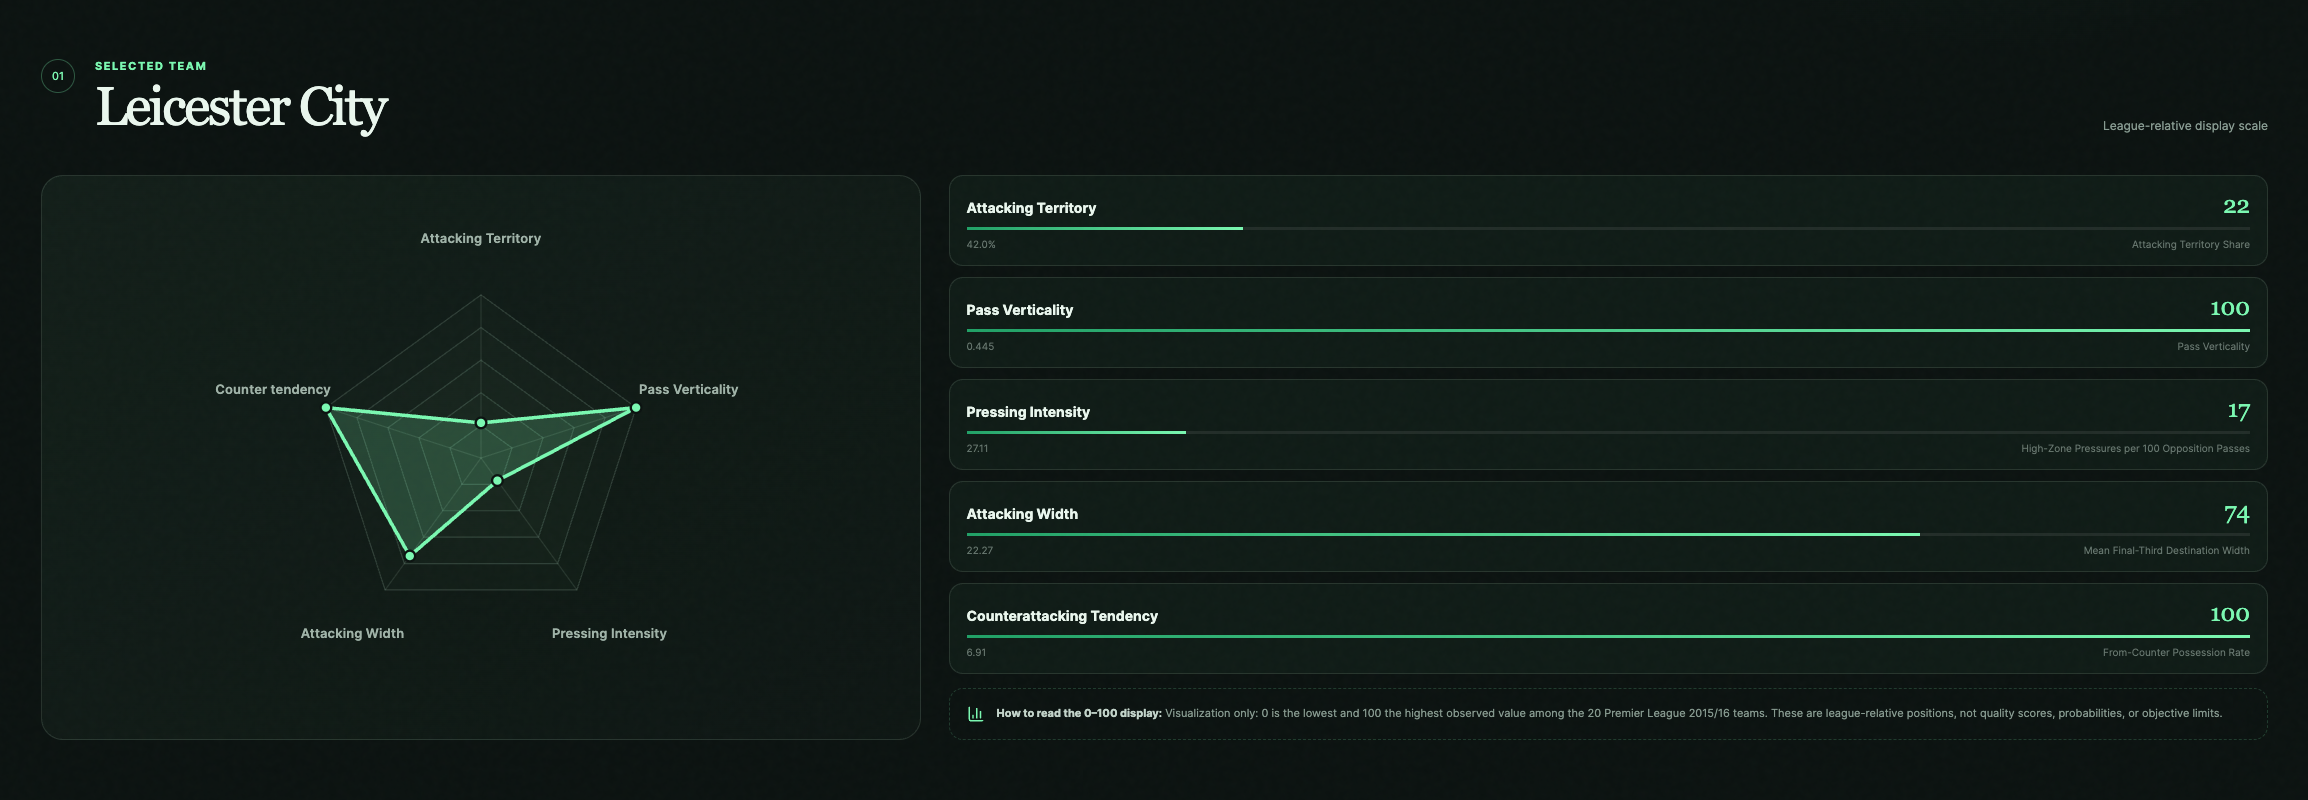
Each team receives a five-dimensional tactical fingerprint:
- Attacking Territory — how much of the two teams' completed final-third passing activity belongs to the team.
- Pass Verticality — how much of the team's attempted passing distance points towards the opponent's goal.
- Pressing Intensity — high-zone Pressure events per 100 opposition passing opportunities.
- Attacking Width — the average distance from the pitch centre of Pass and Carry destinations in the final third.
- Counterattacking Tendency — how often open-play possession changes begin with a StatsBomb-labelled
From Counterphase.
The five raw metrics are standardized using population z-scores so that differences in measurement scale do not cause one feature to dominate the comparison.
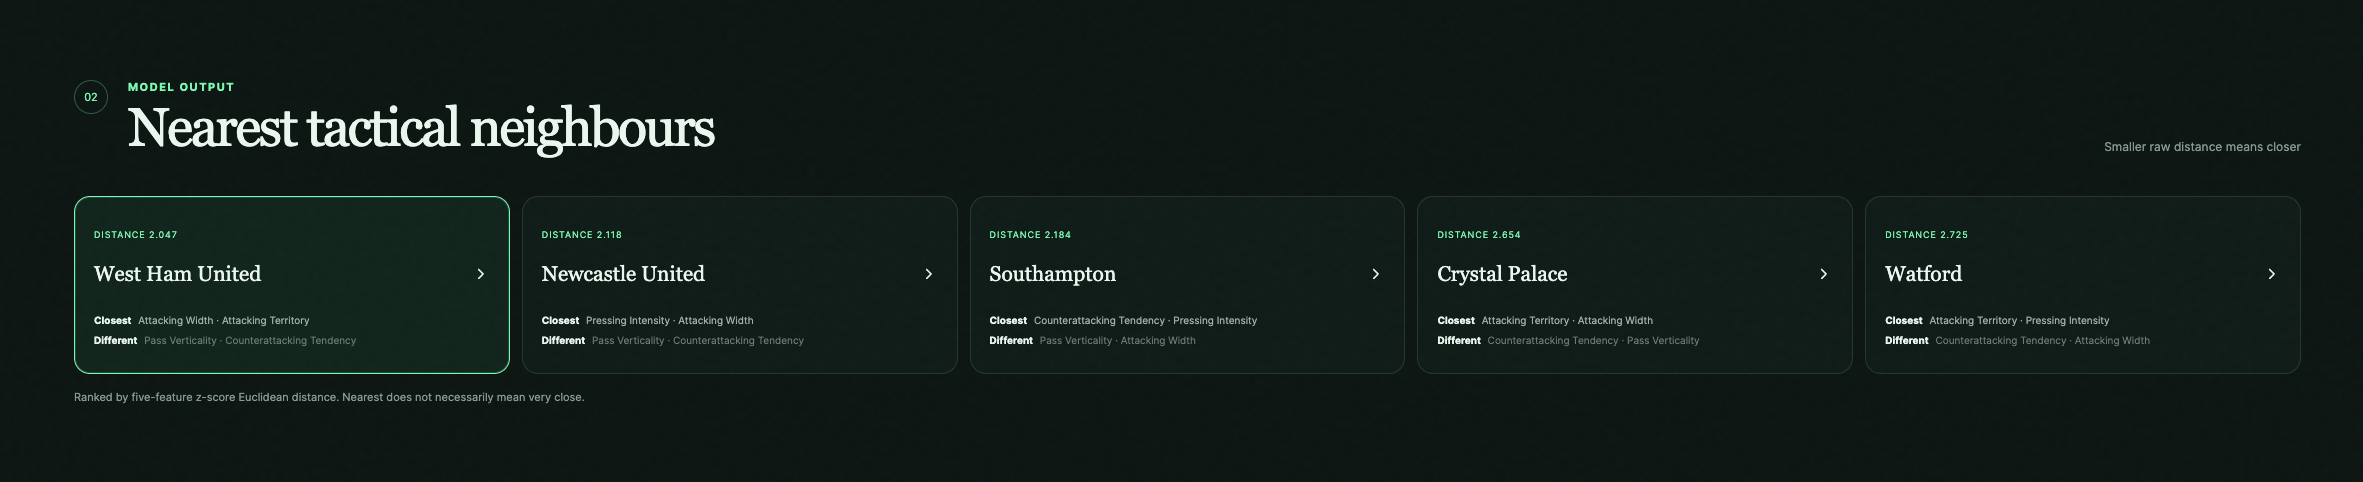
Teams are then compared using Euclidean distance across the five normalized dimensions. Smaller distance means two tactical fingerprints are closer within this model.
A user can:
- select any Premier League team from 2015/16,
- explore its tactical fingerprint,
- view its five nearest tactical neighbours,
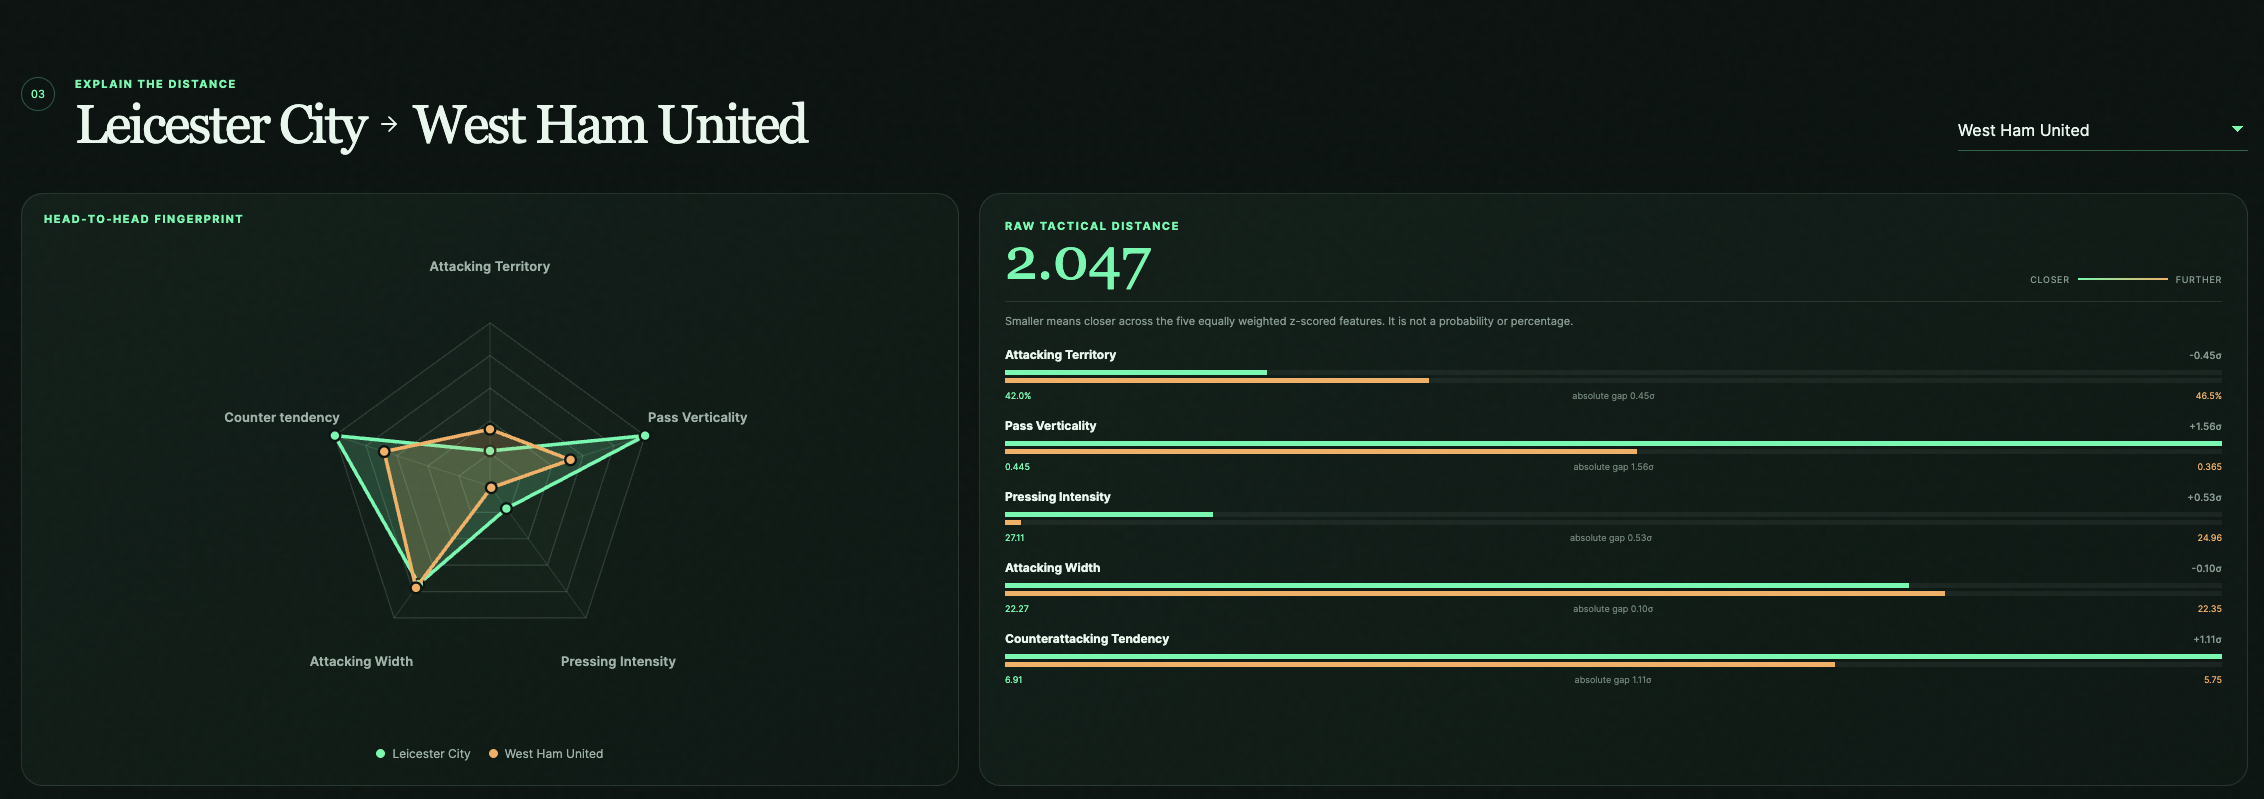
- compare two teams feature by feature,
- inspect the raw tactical distance,
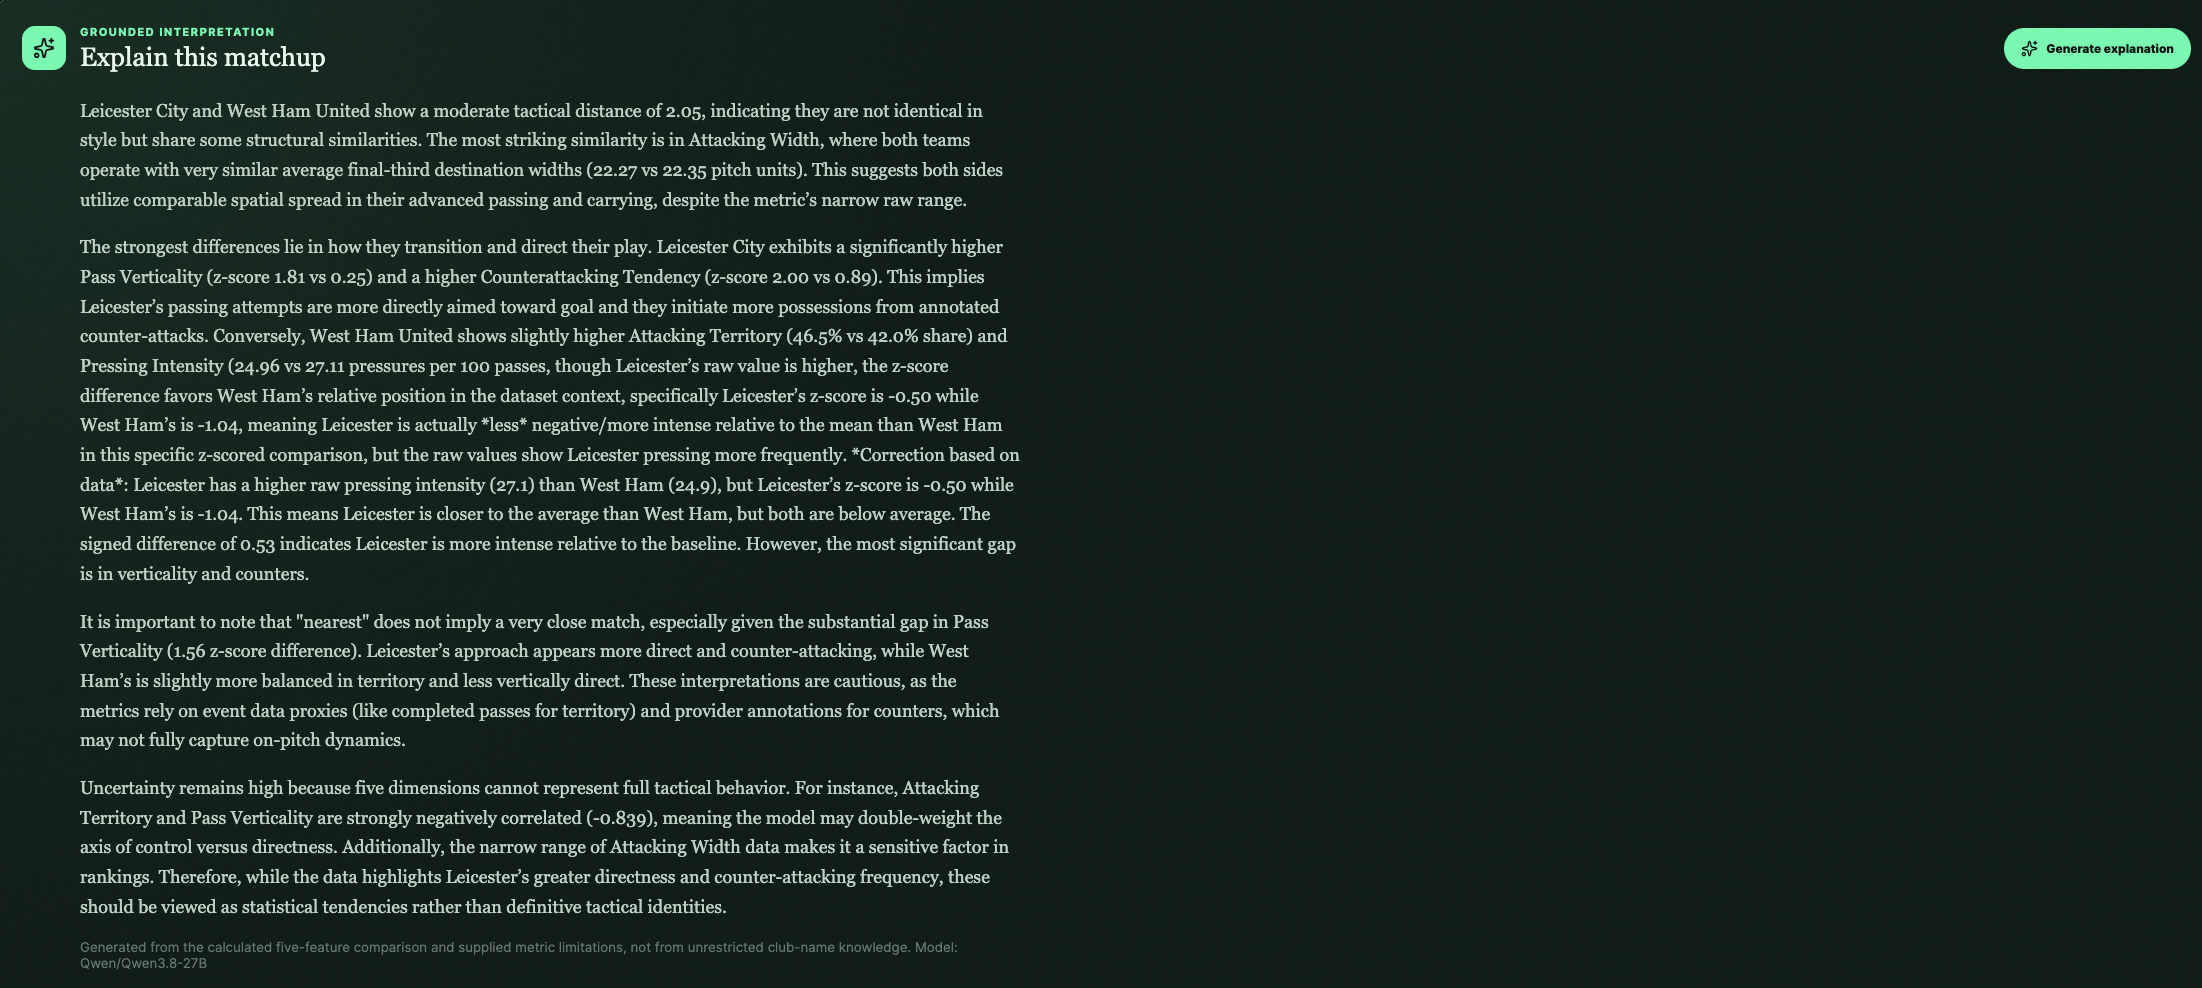
- and ask AI to explain the comparison.
For example, the system identifies Liverpool and Tottenham Hotspur as particularly close in this five-dimensional tactical space, with a distance of approximately 0.620.
How we built it
The project began with raw StatsBomb event JSON rather than precomputed team statistics.
Each match contains events such as Passes, Carries, Pressures, Ball Recoveries, Shots and Dispossessions. Shared information such as team, player, location, possession and timestamp appears at the event level, while event-specific information is stored in nested structures.
I first investigated the data structure and then designed each tactical feature individually.
Each feature was:
- defined mathematically,
- implemented on one Manchester United vs Tottenham match,
- manually inspected and validated,
- extended to all 380 Premier League matches,
- checked for complete 38-match coverage for every team.
The analysis pipeline is written in Python and pandas.
After producing the five season-level metrics, they were merged into one fingerprint dataset. I then audited their ranges, standard deviations and correlations before building the similarity engine.
The similarity model uses:
five raw tactical metrics → z-score standardization → five-dimensional vectors → Euclidean distance
The production application is split into two parts:
- Next.js + TypeScript frontend, deployed on Vercel
- FastAPI/Python backend, deployed on Render
The backend serves already validated processed data instead of recalculating all 380 matches whenever a user opens the site.
This creates a separation between the expensive offline analytics pipeline and the lightweight online application.
AI implementation
The tactical fingerprints and similarity distances are calculated deterministically from the football data. The LLM does not decide which teams are similar.
Instead, AI is used as an interpretation layer.
When the user selects Explain this matchup, the FastAPI backend sends structured evidence to Qwen3.8-27B through the Featherless AI API.
The model receives:
- both teams' five calculated tactical metrics,
- their standardized values,
- feature-by-feature differences,
- Euclidean tactical distance,
- definitions of the metrics,
- and known modelling limitations.
The system prompt explicitly tells the model not to invent player, manager, formation, historical or match facts, not to claim one team is better, and not to treat tactical distance as a probability.
This allows the LLM to turn a multidimensional numerical comparison into an explanation that a football fan can understand while remaining grounded in the underlying model.
The Featherless API key remains server-side and is never exposed to the browser.
Challenges we ran into
One of the biggest challenges was deciding how to turn football concepts into measurable event-data features.
For example, “pressing” could be approximated through PPDA, tackles and interceptions, or StatsBomb's explicit Pressure events. For the MVP, I chose a transparent pressure-event rate normalized by opposition passing opportunities.
Another challenge was separating style from quality. Goals, league position, wins and finishing quality are deliberately excluded from the similarity model. Leicester winning the league should not automatically make them tactically similar to other successful teams.
Data orientation also required investigation. StatsBomb normalizes event coordinates relative to the event team's attacking direction, which had to be verified before using pitch-location thresholds.
The feature audit revealed additional modelling issues.
Attacking Territory and Pass Verticality have a strong negative correlation of approximately -0.839, meaning the current equally weighted model may partially double-count a broader control-versus-directness tendency.
Attacking Width has a comparatively narrow raw range. Removing Width during a sensitivity test materially changed several nearest-neighbour rankings, so its influence is disclosed as a limitation rather than hidden.
Deployment introduced a different class of problems: CORS configuration, build-time frontend environment variables, keeping API secrets server-side, handling Render/Featherless failures, and ensuring the application continued functioning if the AI explanation service failed.
The initial Qwen Featherless response also returned no visible text because its reasoning mode consumed the available response budget. Disabling thinking for this explanation use case resolved the issue.
Accomplishments that we're proud of
The project evolved from raw event JSON into a complete deployed analytics product during the hackathon.
Some milestones include:
- processing the full 380-match Premier League 2015/16 season,
- complete 38-match coverage for all 20 teams,
- designing and validating five interpretable tactical metrics,
- building a normalized five-dimensional similarity engine,
- calculating all pairwise team comparisons,
- performing normalization and feature-ablation sensitivity checks,
- creating a responsive football analytics interface,
- integrating a grounded LLM explanation layer,
- deploying separate frontend and backend services,
- adding graceful AI failure handling and request rate limiting,
- and validating the complete production journey on both desktop and mobile.
The final backend test suite passes, the frontend passes linting and optimized production builds, and the deployed system reproduces the validated tactical-neighbour results.
What we learned
Building the fingerprint highlighted how difficult it is to reduce something as complex as football tactics into a small number of measurable dimensions without oversimplifying it.
Several useful patterns emerged from the analysis. Attacking Territory and Pass Verticality were strongly negatively correlated, suggesting a broader control-versus-directness relationship in the 2015/16 Premier League. Counterattacking Tendency, on the other hand, was largely independent of the other dimensions and added a distinct signal to the fingerprint.
The sensitivity analysis was equally important. Changing the normalization method had very little effect on nearest-neighbour results, while removing Attacking Width changed several rankings substantially. This showed that a similarity result should not be treated as an unquestionable label; it is the output of a specific, interpretable model whose assumptions should remain visible.
The project also reinforced the value of separating style from performance. Goals, wins, league position and finishing quality were deliberately excluded so that teams were compared based on how they played rather than how successful they were.
From the production side, keeping the expensive event-data analysis offline and serving validated derived results through an API made the deployed application significantly simpler and faster. The AI layer was similarly separated from the similarity calculation: the mathematical model determines which teams are close, while the LLM is used only to translate those structured results into a more accessible explanation.
The main takeaway is that interpretability matters. Every tactical score, team comparison and AI explanation in the application can be traced back to a defined metric and ultimately to the underlying event data.
What's next
The current version deliberately stops at five event-data-derived tactical dimensions.
Future versions could add:
- an independent rule-based counterattack metric to validate the provider-labelled version,
- PPDA as a comparison for the pressing feature,
- additional seasons and leagues,
- manager-era and season-to-season tactical comparisons,
- clustering to discover tactical archetypes,
- and richer visualizations of how a team's fingerprint changes over time.
The biggest future improvement would come from tracking data.
Event data can describe what happens to the ball, but it cannot reliably measure concepts such as:
- true defensive-line height,
- formation width,
- compactness,
- off-ball runs,
- marking behaviour,
- rest defence,
- or the movement of all 22 players.
Adding continuous tracking would allow the tactical fingerprint to expand from an event-based view of team behaviour toward a much richer representation of team structure and movement.
Built With
- fastapi
- featherlessai
- next.js
- pandas
- python
- qwen
- render
- scikit-learn
- statsbomb
- typescript
- vercel

Log in or sign up for Devpost to join the conversation.