-
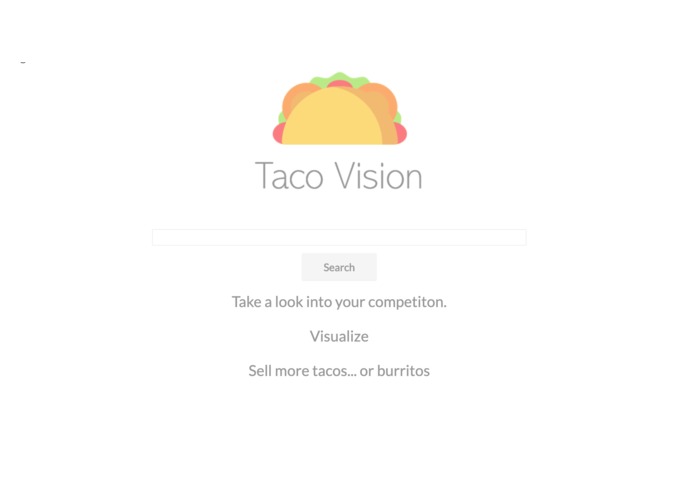
homepage
-
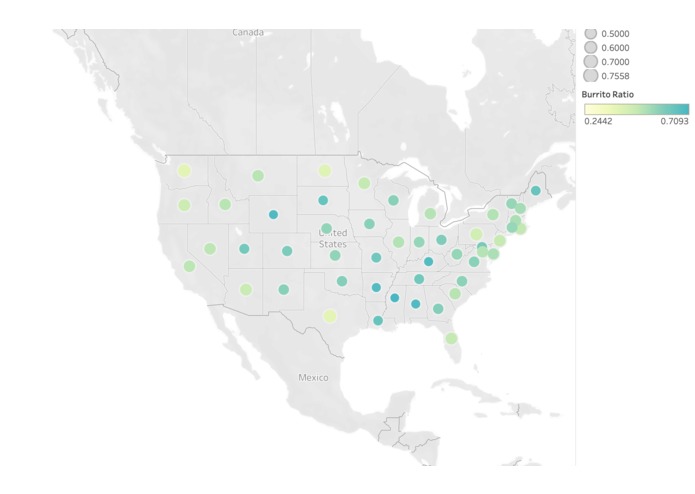
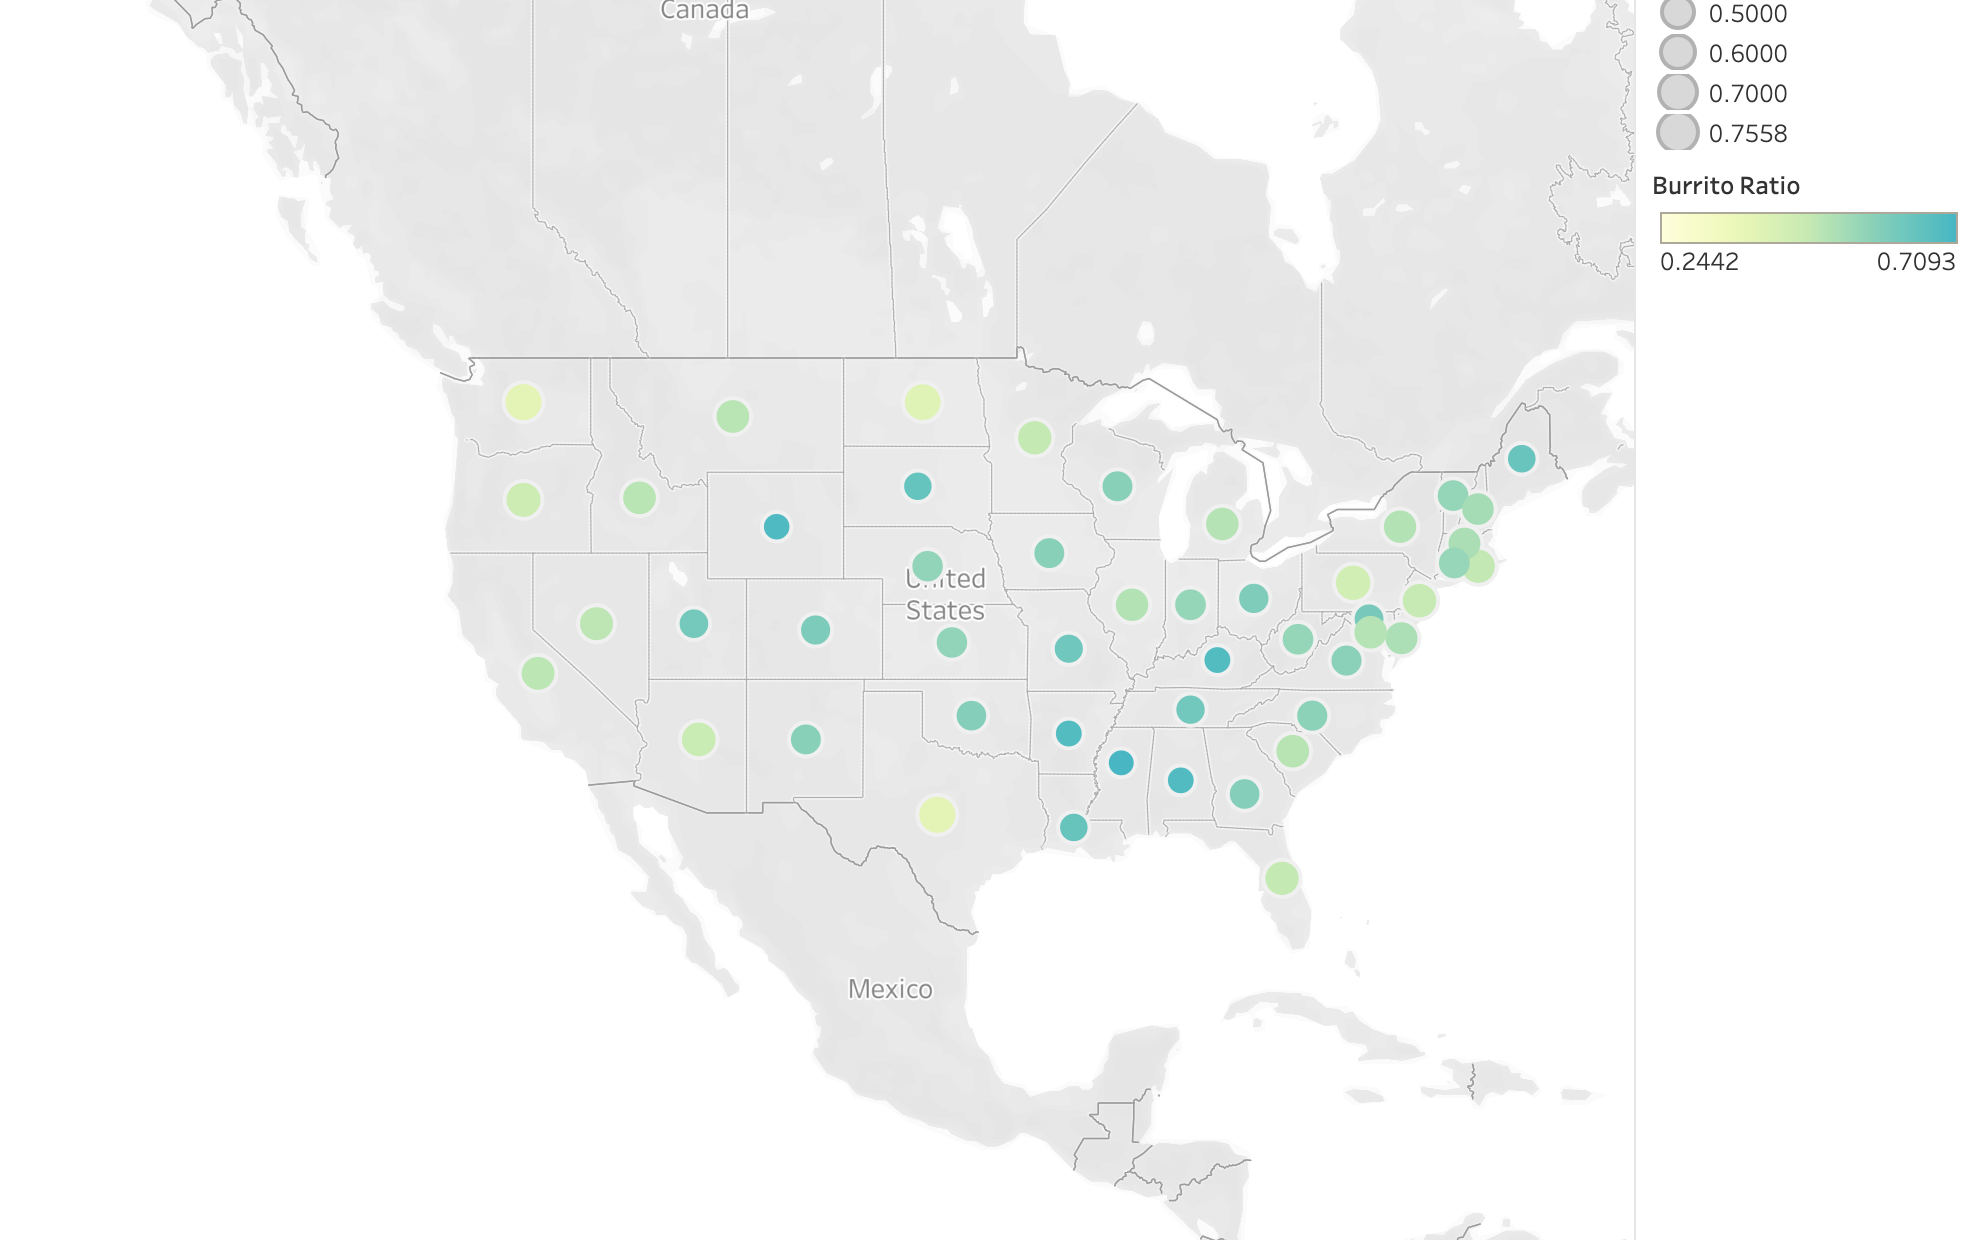
Tableau-based visualization
-
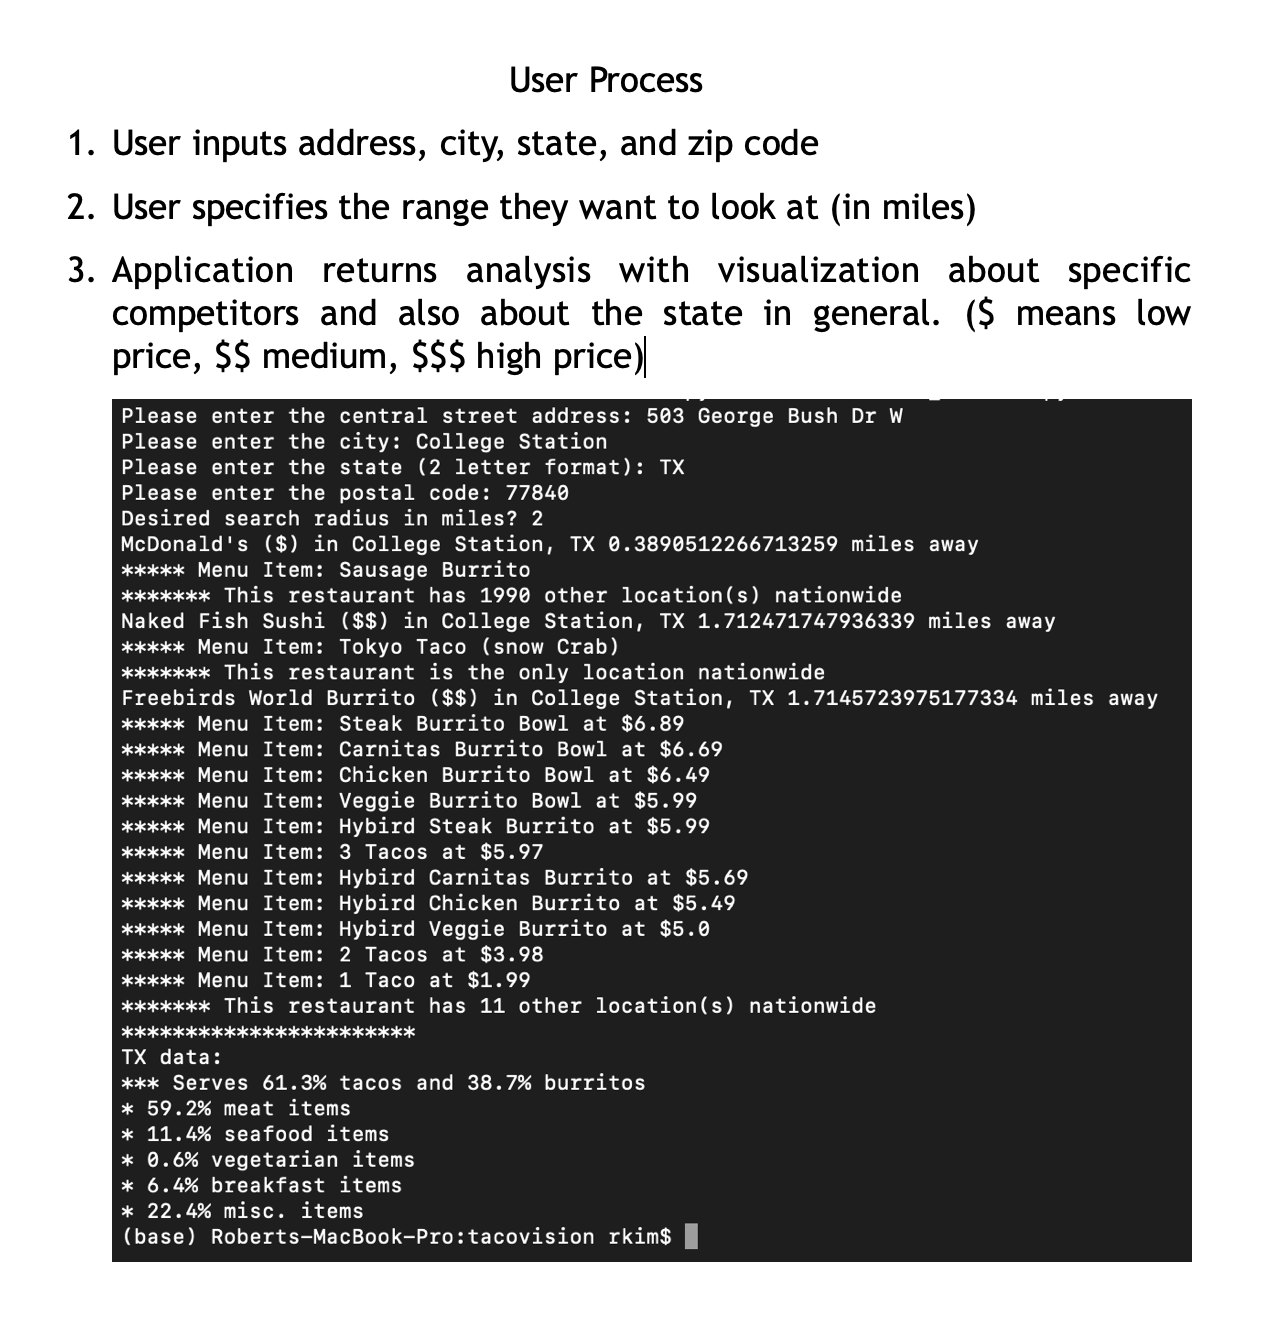
user-experience
-
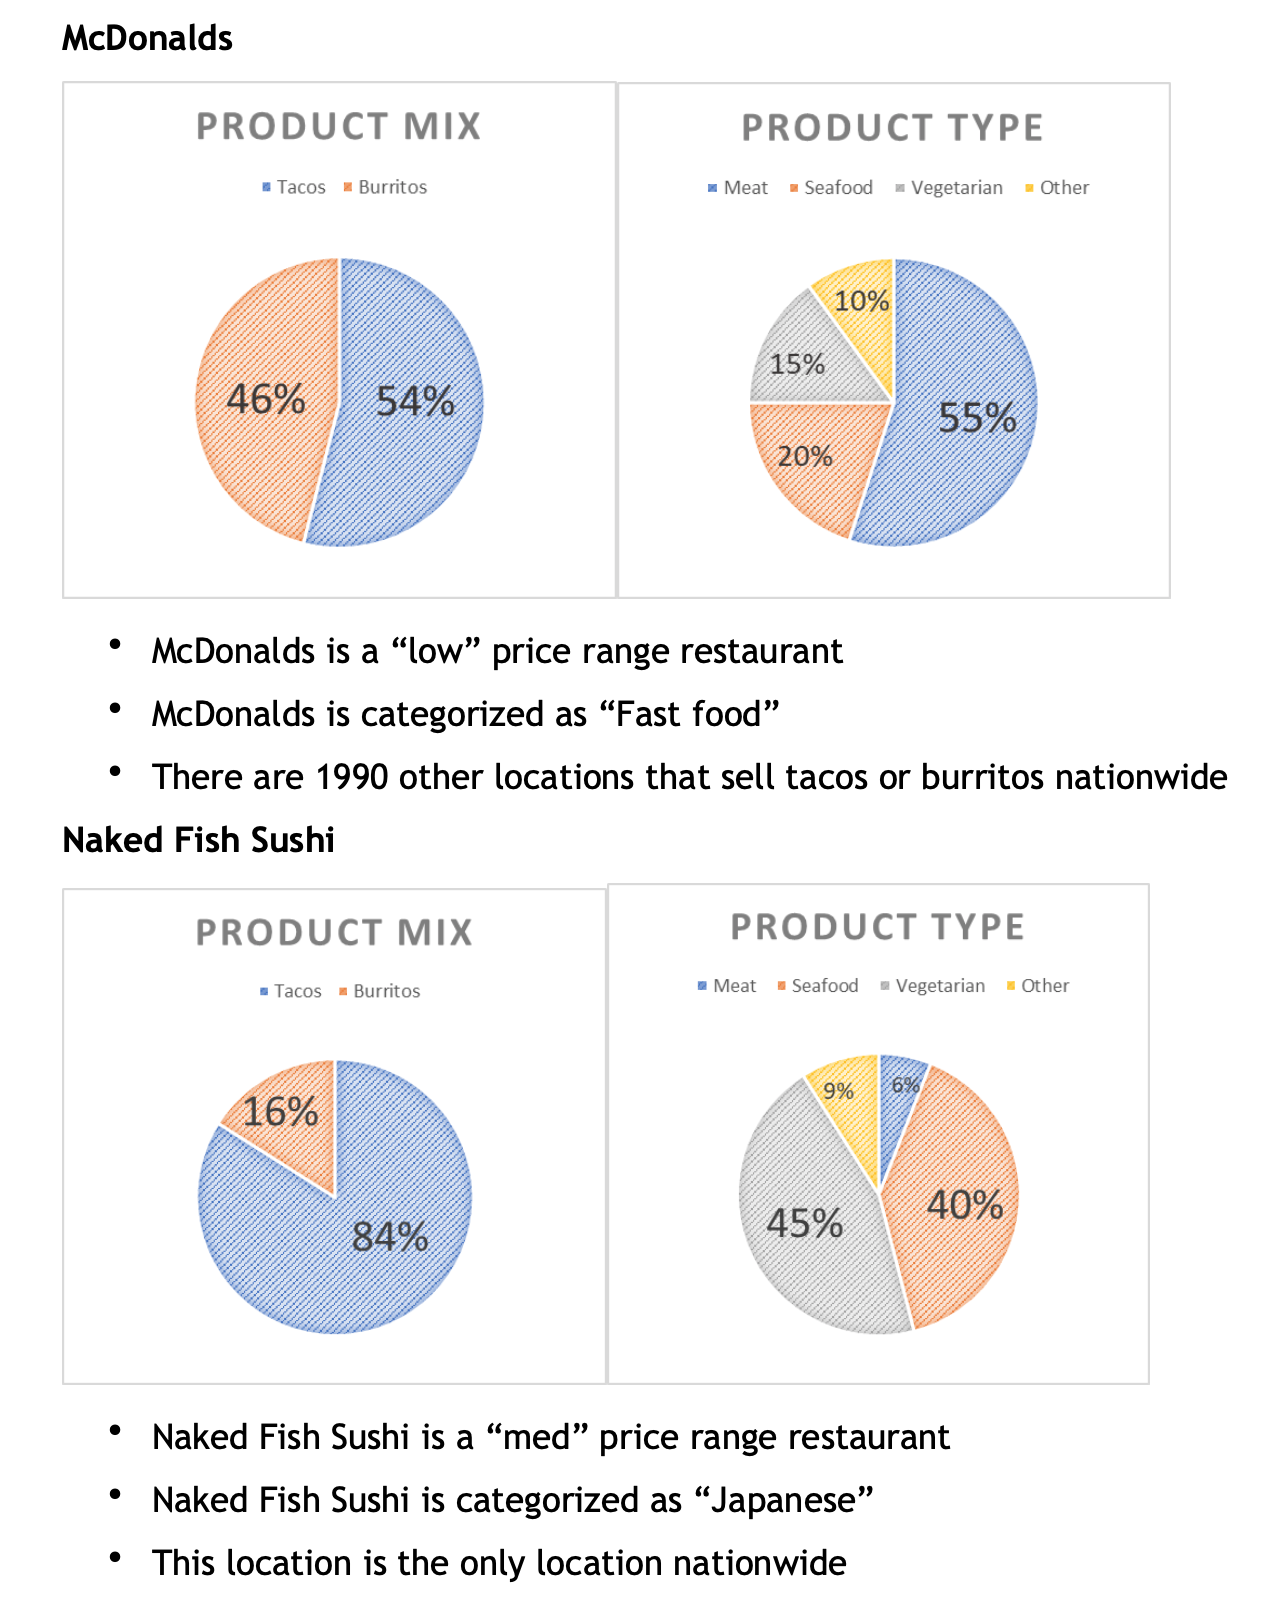
data driven insights
Inspiration
Many small business owners can't afford to fail. One failed business can lead to a ripple effect of financial struggle. In addition, many small chains that look to expand are never able to do so, because they don't possess information outside of their current region to fully commit to the expansion. They miss out on huge potential profit simply because they weren't properly informed. Our goal is to help small business owners make better, data-driven decisions when starting and expanding their business.
What it does
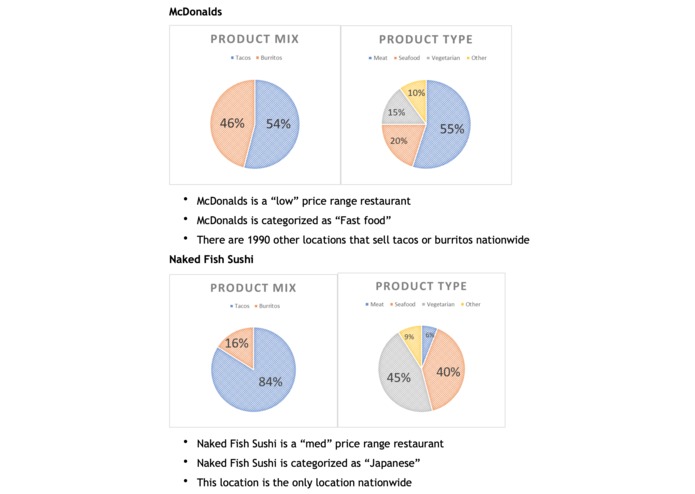
Taco Vision is a web application which for a given user's location, returns relevant data and trends about competitors in the specified area. Taco Vision compiles and visualizes competitor menu items and average price points to aid in the decision making process for prospective businesses. Through this data the user can determine what is in demand and how to best position themselves to succeed.
Due to time constraints, the current web application simply demonstrates the user experience of the app and showcases Tableau worksheets with nationwide trends. The python backend, which isn't yet integrated to the front end, calculates and returns all the necessary information.
How we built it
Data: We started off by looking at the taco/burrito data set and determining which information would be valuable for the purposes of this project. Main tools we used for this process were Jupyter notebooks and python(pandas). Then, we went through a systematic data cleansing/recovery methodology to remove unnecessary data and create data that we previously didn't have. For example, we decided that longitude and latitude data of a business was important to us since it would be used to map the distance from the potential location of our user. However, we noticed that those fields were missing many rows. We decided to resolve this issue by using Google Maps Geocoding API to recover the data using address information.
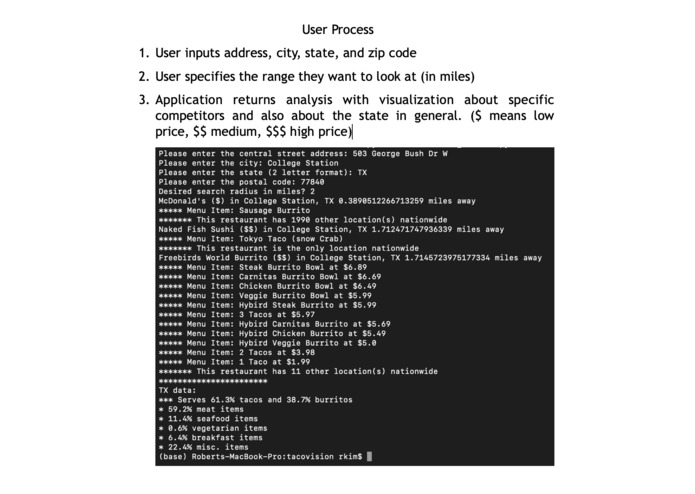
Backend: After creating the data we needed, our team came up with the functionality of the application. We wanted to, given an address input, return all of the restaurants within a specified radius of the address and bring back insightful information for each location: menu items, prices, menu diversity, and general information about restaurants in that state. We believe more could be done with this sort of querying, but the basic data returned at this stage shows that there is potential to give the user even more relevant information on specific locations.
Frontend: We used HTML, CSS, and JavaScript to construct the basic parts of our website. While there are plenty of features yet to be implemented, our frontend simply serves as a placeholder to be fully integrated with the backend.
Challenges we ran into
By far the biggest challenges we ran into involved cleaning the data set and determining how to effectively use the data in an impactful manner. Our inspiration took some thinking and deliberation before we decided to commit to the project. Because the dataset was relatively vague and open-ended in its information, our team had to carefully select what data was important, what was filler, and what could simply be scrapped. We also ran into some obstacles when trying to expand the database, as we quickly learned that many sites block their data from being scraped.
Accomplishments that we're proud of
Despite having an extremely vague dataset, we’re proud of the fact that we were able to use the dataset in an applicable manner. While the scope of the dataset only includes tacos and burritos, the possibilities for the application of this project are extremely wide, as it could be applied to any type of cuisine. We’re excited to see how Taco Vision can help small business owners in the real world.
As our whole team's first datathon experience and many members' first MLH experience, we feel like we created a quality project, learned a lot, and had a lot of fun while working together this weekend!
What we learned
There were a couple key takeaways from this experience. 1.) As a first time experience for our whole team, we realized data science and analytics has a lot to do with visualization and how we transform the data. Having data at hand is useful, but if it isn’t analyzed or explained, it’s not very useful. 2.) Rather than spending more time implementing killer visualization, we spent more of our time cleaning and analyzing our data so that working with it was much easier. 3.) Something as arbitrary and plain as tacos and burritos could visualized in an interesting way!
What's next for Taco Vision
Connecting the backend to the frontend for full functionality (aws lambdas - is a good pathway for this), as well as implementing other features and visualization for data analysis! There are also quite a few more insights to be gained from the connections we made in our three databases, and we would love to explore them more in depth.
Overall, we believe that the applications could be limitless. Provided the dataset for any category, whether it be pizzas, chinese food, or desserts, the framework we used to develop Taco Vision could potentially make a lasting impact in business decision making.
Built With
- github
- github.io
- google-cloud
- google-maps
- jupyter-notebook
- pandas
- python
- tableau
Log in or sign up for Devpost to join the conversation.