-
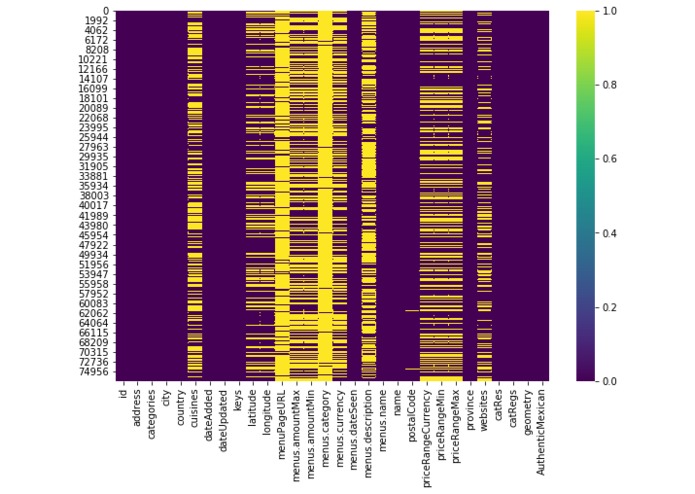
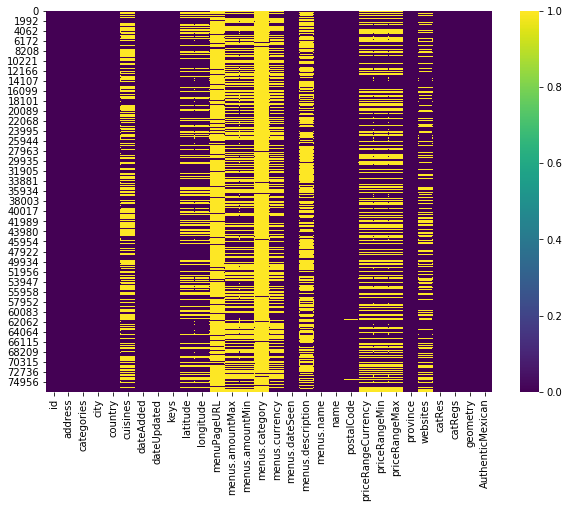
Heatmap of null values for each feature
-
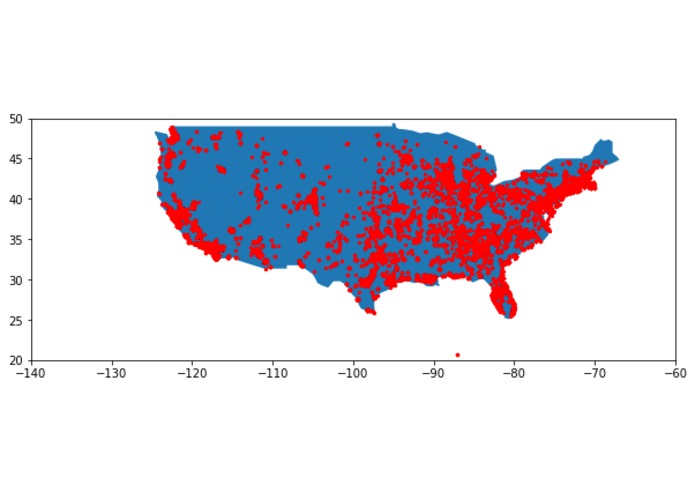
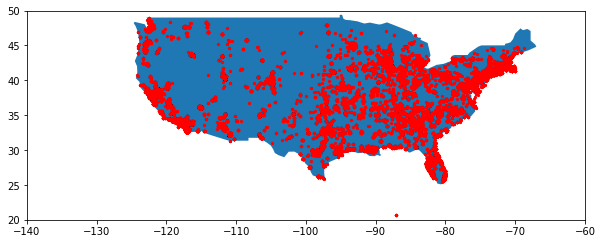
Map of mexican restaurants in the US
-
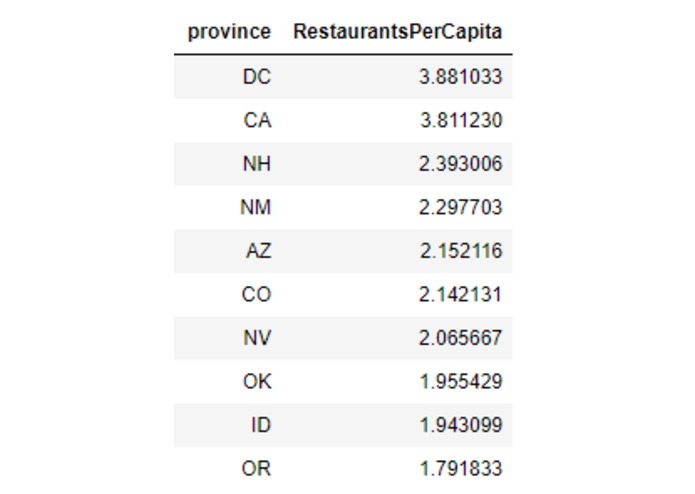
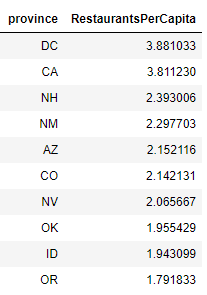
States with most number of restaurants per capita
-
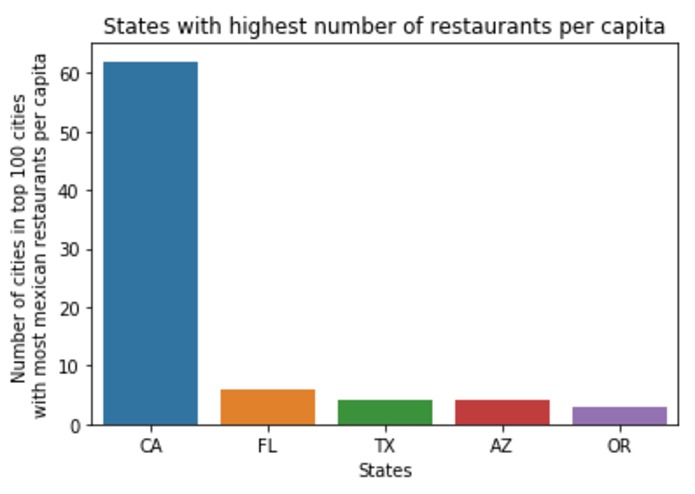
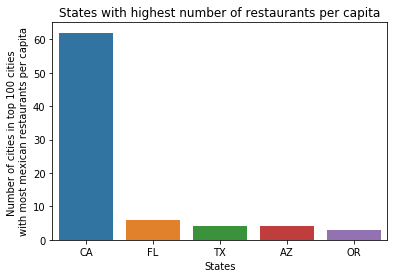
Number of cities in top 6 states with most number of restaurants per capita
-
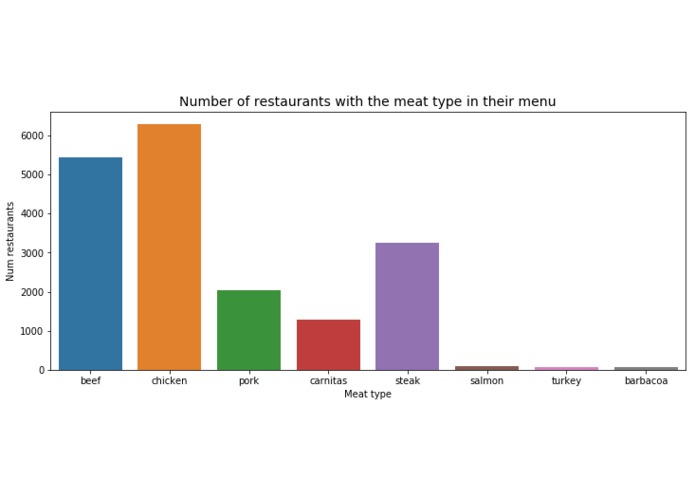
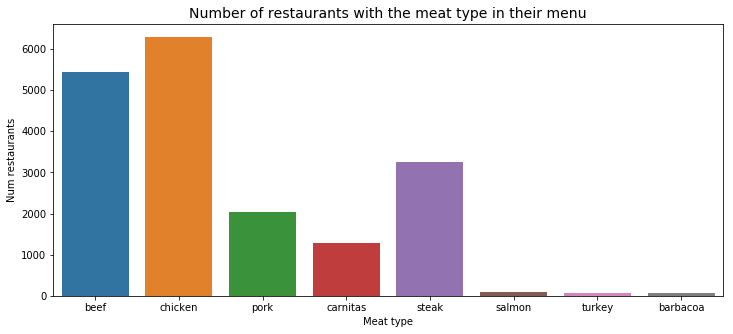
Count plot for number of meat types in menu description
-
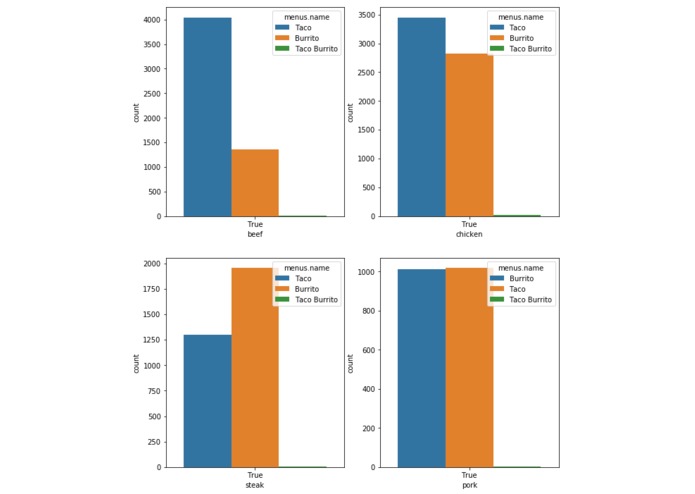
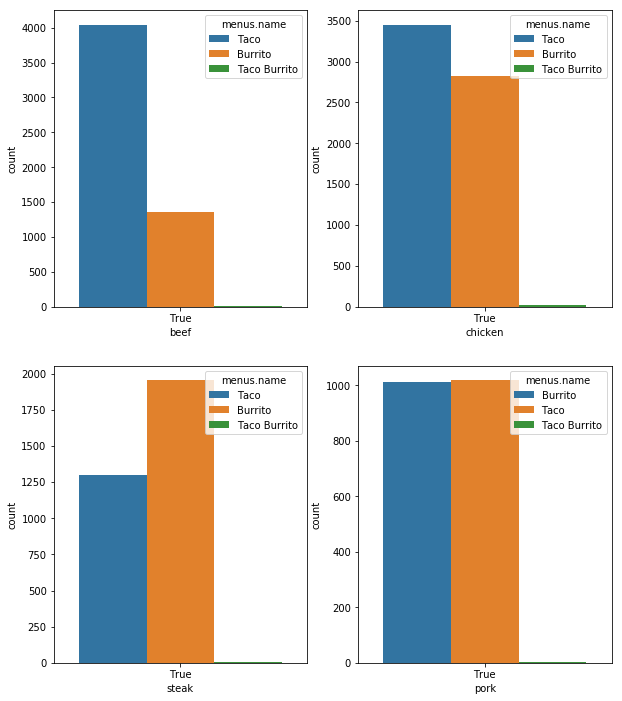
Comparison of Taco and Burritos for different type of meat
-
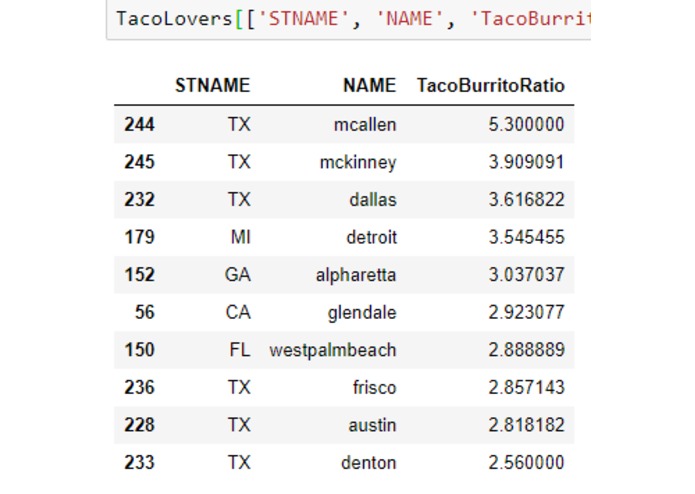
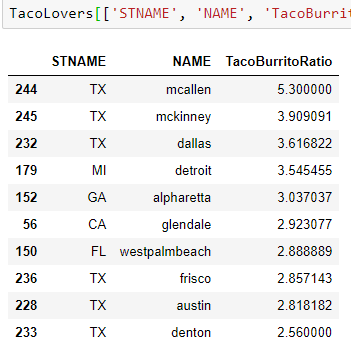
Taco Lovers states
-
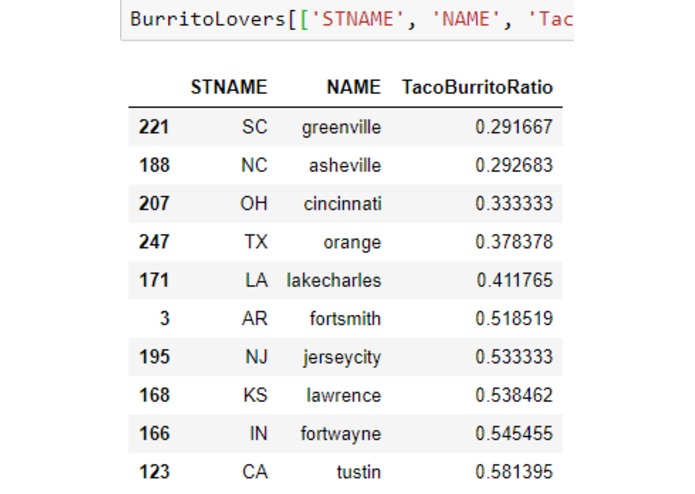
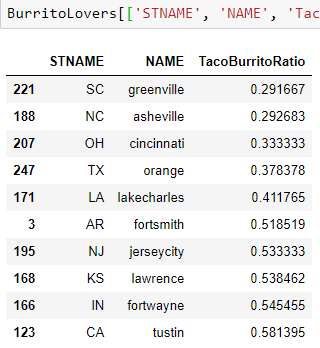
Burrito Lover States
-
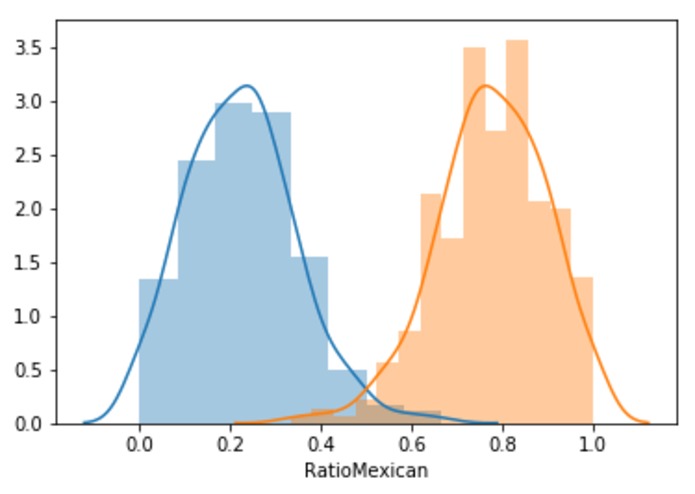
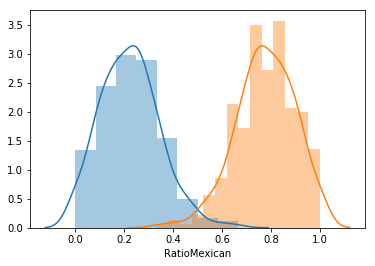
Histogram of authentic Mexican restaurants vs other Mexican restaurants
-

Pair t-test for number of restaurants per capita between states CA and TX
-
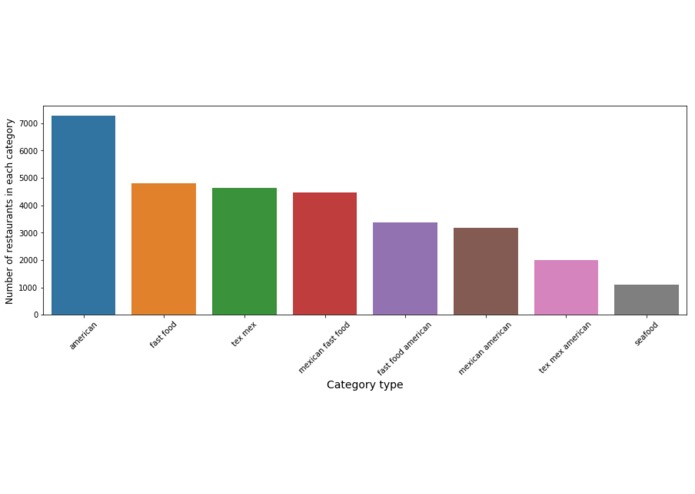
Countplot for restaurant category type in the US
-
Merged table
-
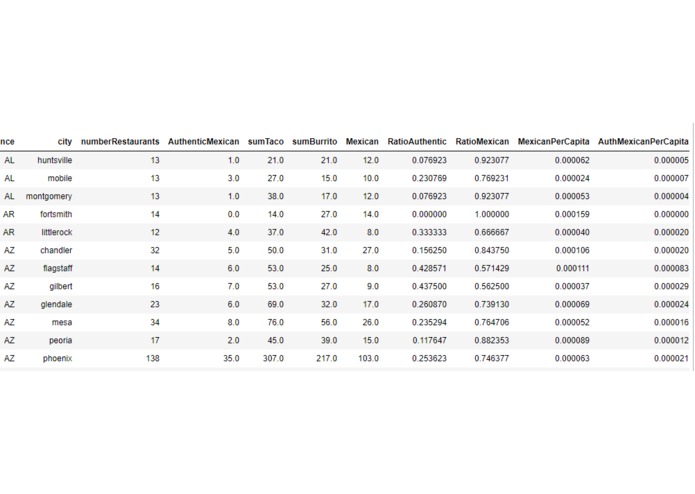
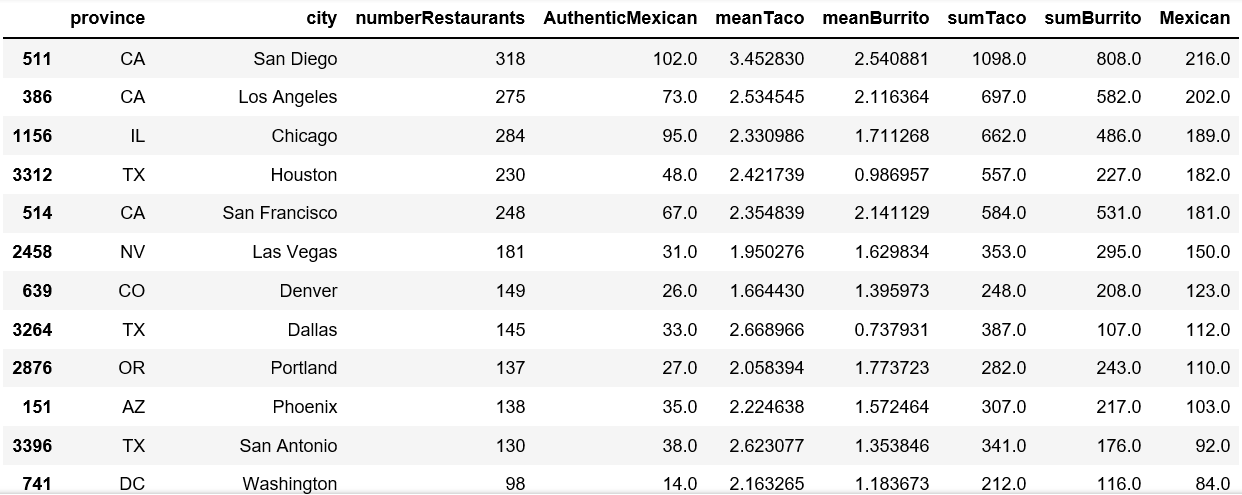
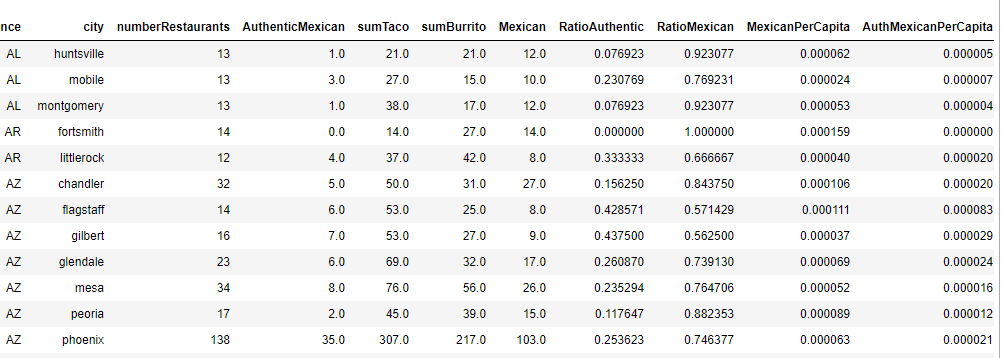
Data set grouped by each city and state
-
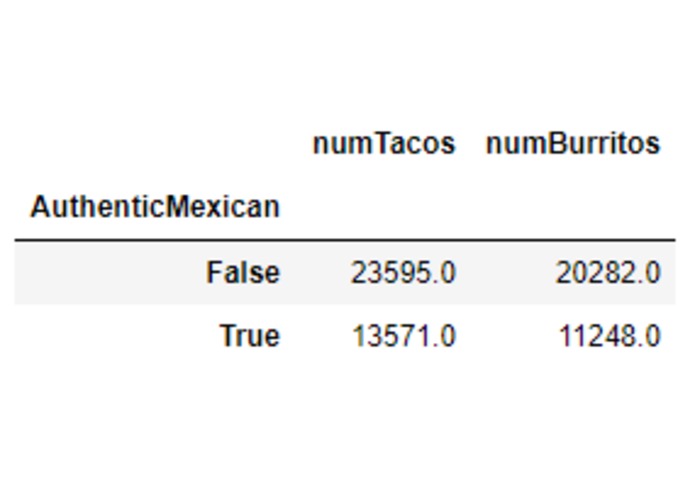
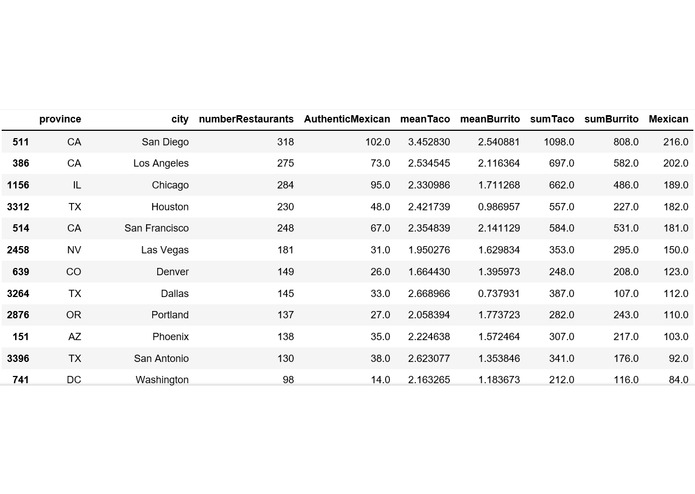
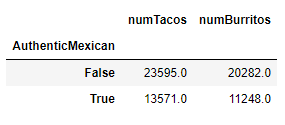
Comparison Table (number of tacos vs burritos for authentic vs regular Mexican)
-
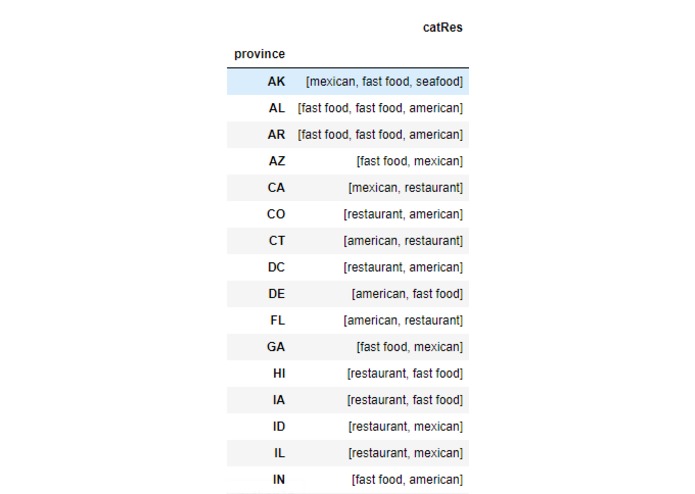
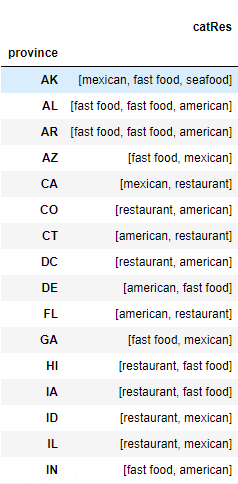
Top two categories of restaurants for each state.


Inspiration
Not every data set is structured, labeled and ready to be analyzed. Most of the real-world data sets are just raw data that require so much data cleaning, hypothesis defining, mining, and testing. We really liked to work on open-ended data related questions and think about how we can gain insights from messy datasets. We found it fascinating as we attempted to mine data and derive insights from the data set containing information collected about restaurants serving tacos and/or burritos.
What it does
In this project we preprocessed the data and performed EDA to extract meaningful features. We merged the dataset with census population data to derive different insights. In summary we address the following questions:
- How many restaurants in each category serve tacos and burritos?
- How many burrito and taco foods are served by each restaurant?
- Do restaurants offer more taco options compared with burritos?
- What is the ratio of Mexican restaurants per capita in different cities and states? (Potential market/growth indicator for cities with lower numbers)
- Which states has the highest Mexican restaurants per capita?
- What type of meat is most appeared on the menu description? (beef, chicken, steak, etc.)
- How is the distribution of different types of meat for taco and burrito?
- What is the most frequent restaurant type in each city and state?
- What is the ratio of burritos and tacos on restaurant menus from each city?
- What is the ratio of burritos and tacos on restaurant menus from cities with the most restaurants per capita?
- Which cities serve more variety of tacos in their restaurants compared to burritos? (TacoLovers) and reverse?
- What is the ratio of cities with the most authentic Mexican restaurants per capita?
- Which Mexican restaurants have the most locations nationally?
- What are the areas that seem to be good potentials for running restaurants?
How I built it
The first step was pre-processing, EDA to get a insight about the data set and find important features. Then, feature engineering and extraction was performed to deduce useful information. Statistical tests and analysis on the data was done to test and validate different hypothesis. We created many tables that are grouped by different columns, such as, state, city, and restaurant id.
Challenges I ran into
The most challenging and time-consuming part was to perform preprocessing, cleaning the dataset, and extracting meaningful features from categorical feature (e.g., categories, menu.description). Merging data-sets with other publicly available data has challenges because of not having a common key. For this, we first came up with common mapping and employed fuzzy matching algorithms to merge different datasets.
Accomplishments that I'm proud of
In the limited time, we could derive insights based on the provided dataset and also other publicly available datasets.
Conclusion:
1) High number of restaurants that serve tacos and burritos are American restaurants. Also, we see a lot of fast food restaurants that serve mexican food. We could also combine mexican 'american category' with 'american'.
2) The top states with most restaurants per capita are DC, CA, NH, NM, AZ, CO, NV, OK, ID, and OR.
3) The restaurants are offering more number of tacos compared to number of burritos in their menu.
4) This is showing that among the two high hispanic-ratio states, California has statistically higher proportion of authentic mexican restaurants.
Based on information on wikipedia, the top 10 states with high hispanic population ratios are :
[NM, CA, TX, AZ, FL,CO, NJ, NY, IL ,GA]. We can clearly see a correlation between the two lists. The more the hispanic population ratio, the more restaurants per capita. For market analysis, those states with low mexican restaurants per capita and high hispanic pop ratio can be a good target to run a restaurant.
5) 59 cities in California are among the top 100 cities with the most mexican restaurant per capita. The next one is Florida with 6.
6) Many restaurants in Texas cities offer more Tacos than burritos (Taco lovers)
The cities with most burrito to taco ratio are: greenville SC, asheville NC, and cincinnati OH.
Market Analysis:
If you are running a restaurant in the TacoLovers places, you need to offer more tacos than burritos, and vice verca.
7) Many other results are available in the tables provided in figures.
What I learned
What we learned from this project is that not every data set is a prediction task. We learned to work with messy data, clean it, come up with hypothesis, and merge datasets to gain more insight about the data.
What's next for Taco-Burrito : A Mexican Restaurant Analysis
We can perform some predictive modeling for market analysis based on the features that we did not consider, including price, date, menu category. Finding the locations with high population and low number of Mexican restaurants per residents)

Log in or sign up for Devpost to join the conversation.