Inspiration
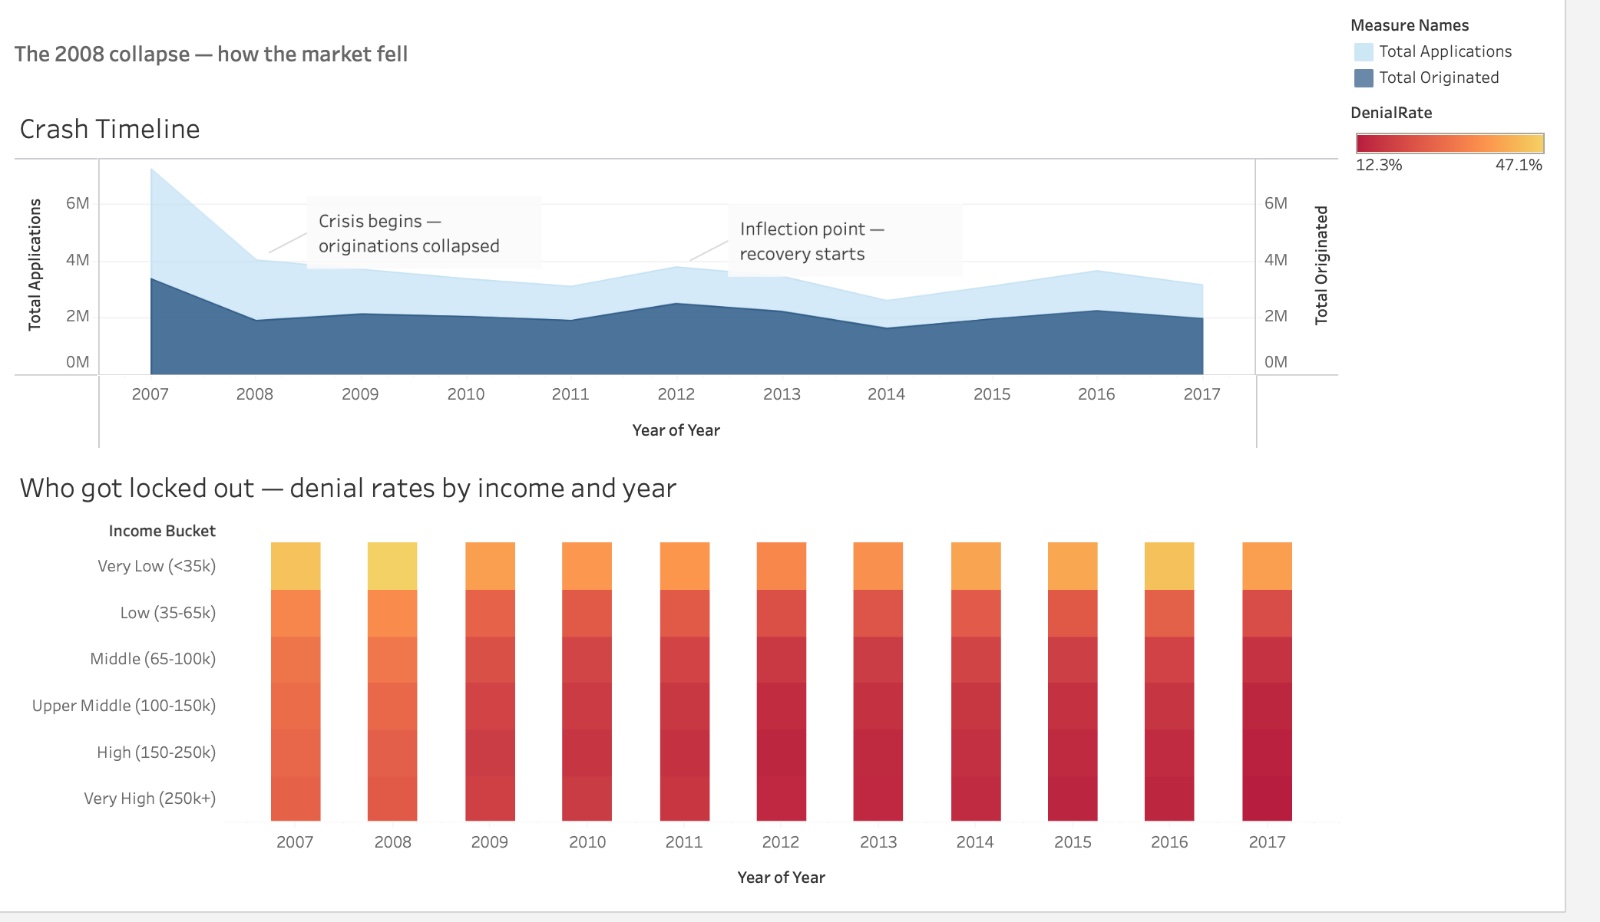
The 2008 financial crisis affected millions of Americans but most people only know the surface story. We wanted to go deeper using real mortgage data to show exactly who got hurt, which markets collapsed, and who never truly recovered. The human angle of low income families being locked out of homeownership drove us to tell this story through data.
What it does
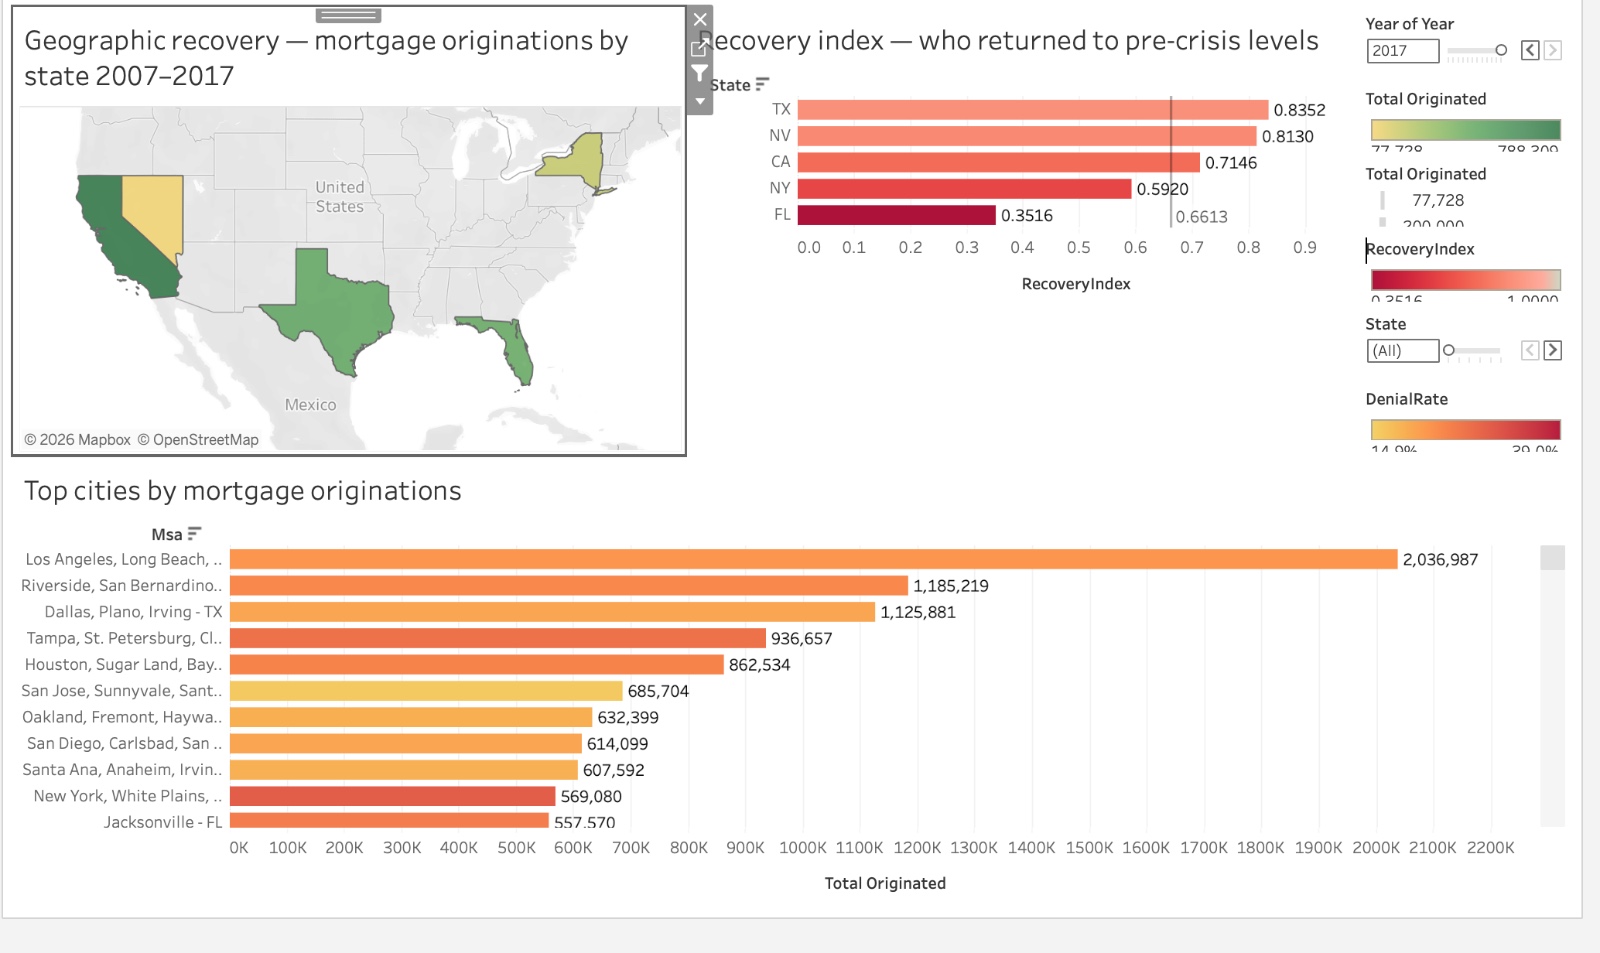
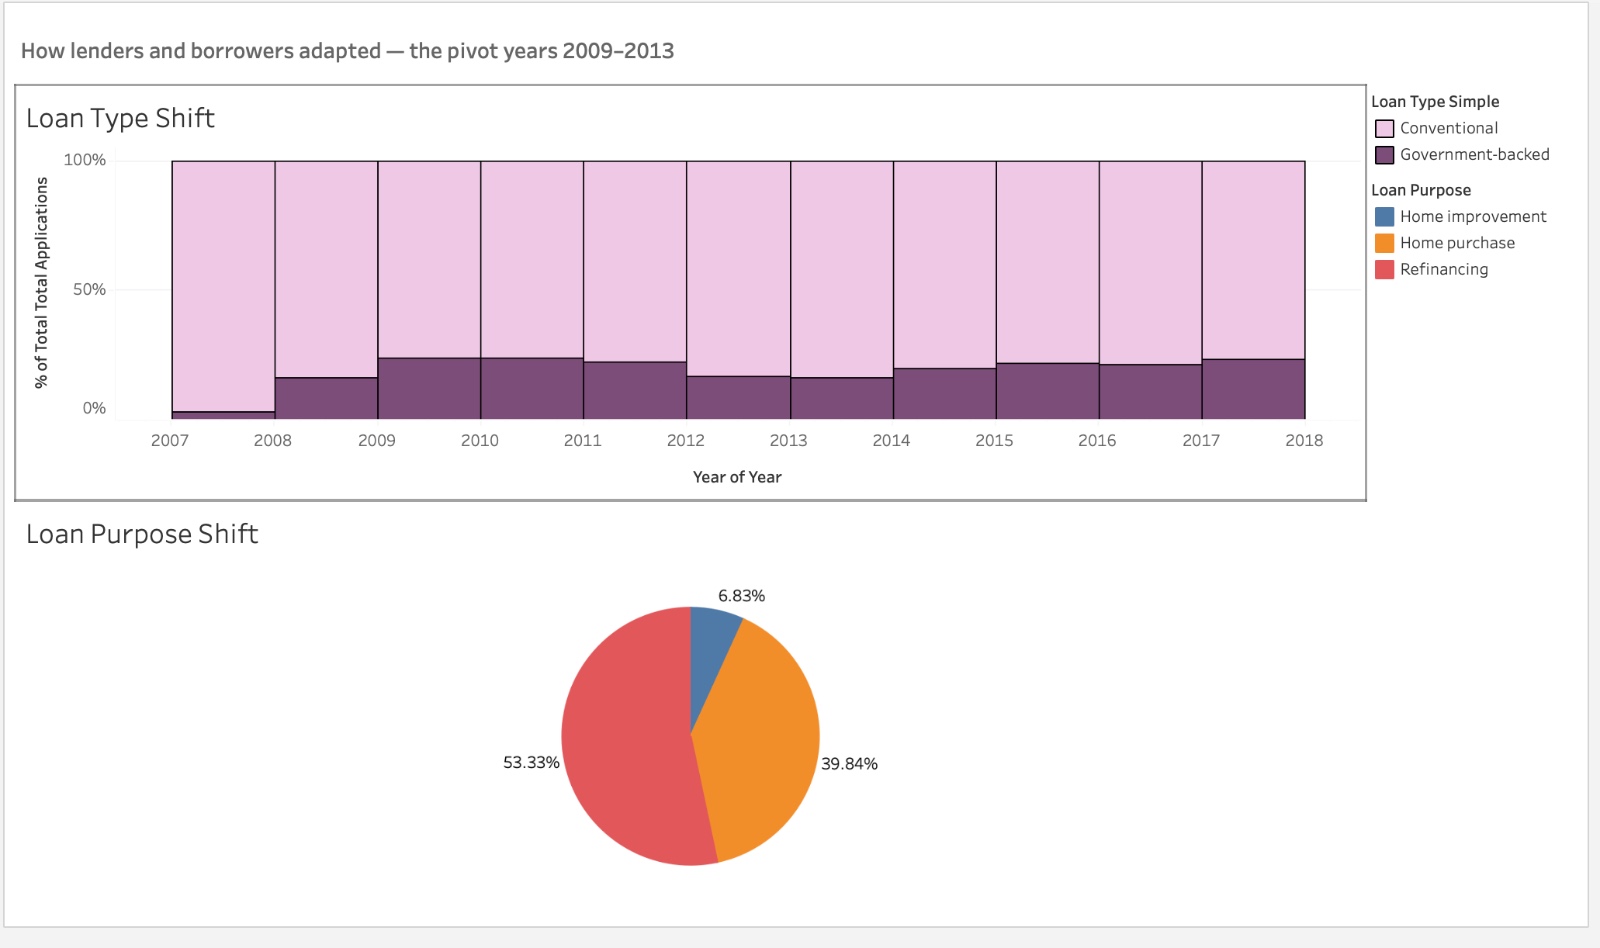
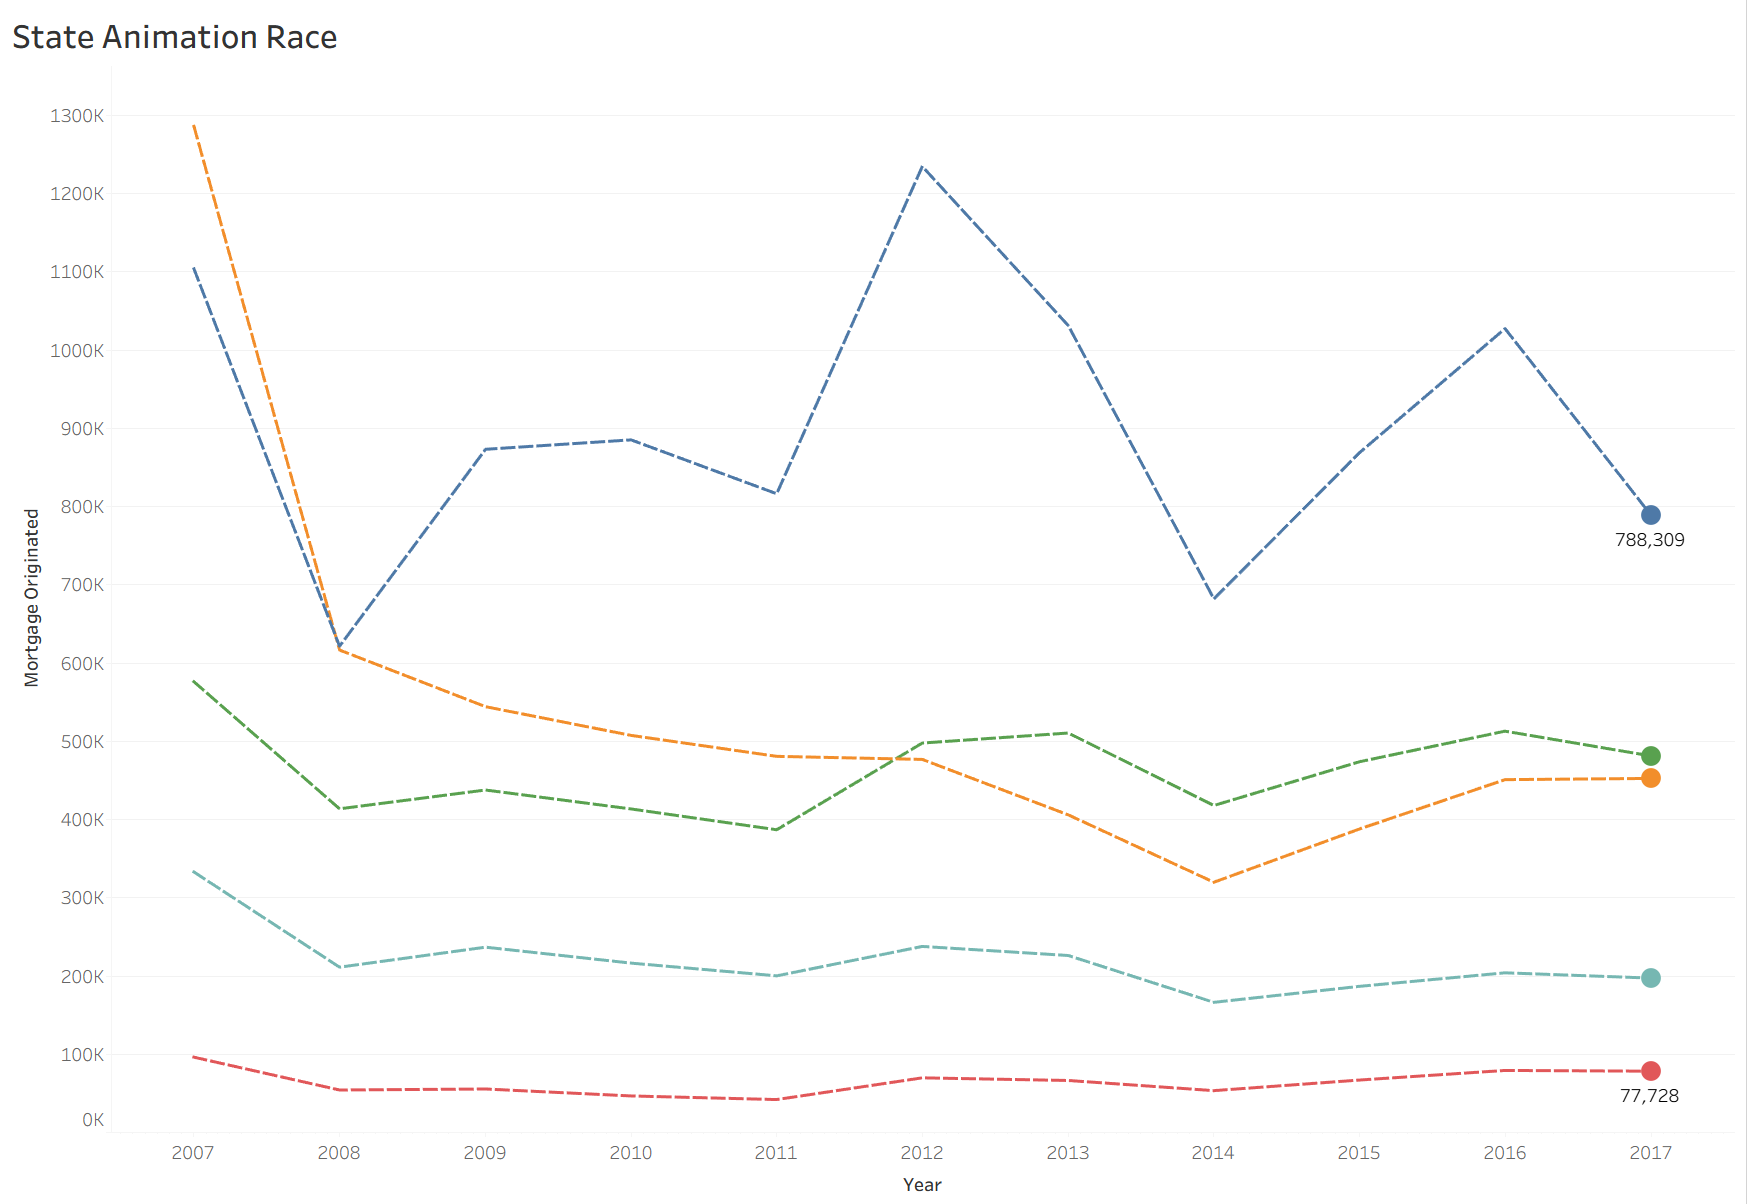
Our interactive Tableau story lets you explore 46 million mortgage records across 5 states and 11 years. You can track the market collapse in real time, see how denial rates spiked for low income borrowers, watch conventional lending get replaced by government backed loans, and compare which states recovered fastest through our custom recovery index.
How we built it
We downloaded raw HMDA data from the CFPB 27GB across 11 years. We cleaned and filtered it using Python and pandas, reducing it to the most meaningful signals across 5 strategically chosen states and 6 income brackets. We then built 7 interactive visualizations in Tableau Public organized into 3 dashboards and chained into a single story.
Challenges we ran into
The raw dataset was 27GB way too large for Tableau Public. We had to engineer a chunked aggregation pipeline in Python to reduce it to 1.5MB without losing any analytical value. Balancing data reduction with completeness was the hardest technical challenge we faced.
Accomplishments that we're proud of
We're proud of the recovery index a custom calculated metric showing each state's return to pre-crisis lending volumes. The finding that no state fully recovered to 2007 levels by 2017 was surprising and powerful. We're also proud of making a 27GB dataset accessible and interactive for any audience.
What we learned
We learned that the 2008 crisis was not just a financial event it was a social one. Low income borrowers were disproportionately denied and that inequality persisted for a decade. We also learned that data storytelling is about what you leave out as much as what you include.
What's next for Tabs
We want to expand to all 50 states, add racial demographic analysis to deepen the equity story, and build a predictive model to identify which markets are most vulnerable in the next downturn. We also want to add lender level analysis to show which banks exited the market and which stayed.

Log in or sign up for Devpost to join the conversation.