Inspiration
Supply chains drift quickly, but ops teams usually find out too late. We wanted a lightweight, always‑on monitor that connects directly to Tableau Cloud data and auto‑summarizes what to do next.
What it does
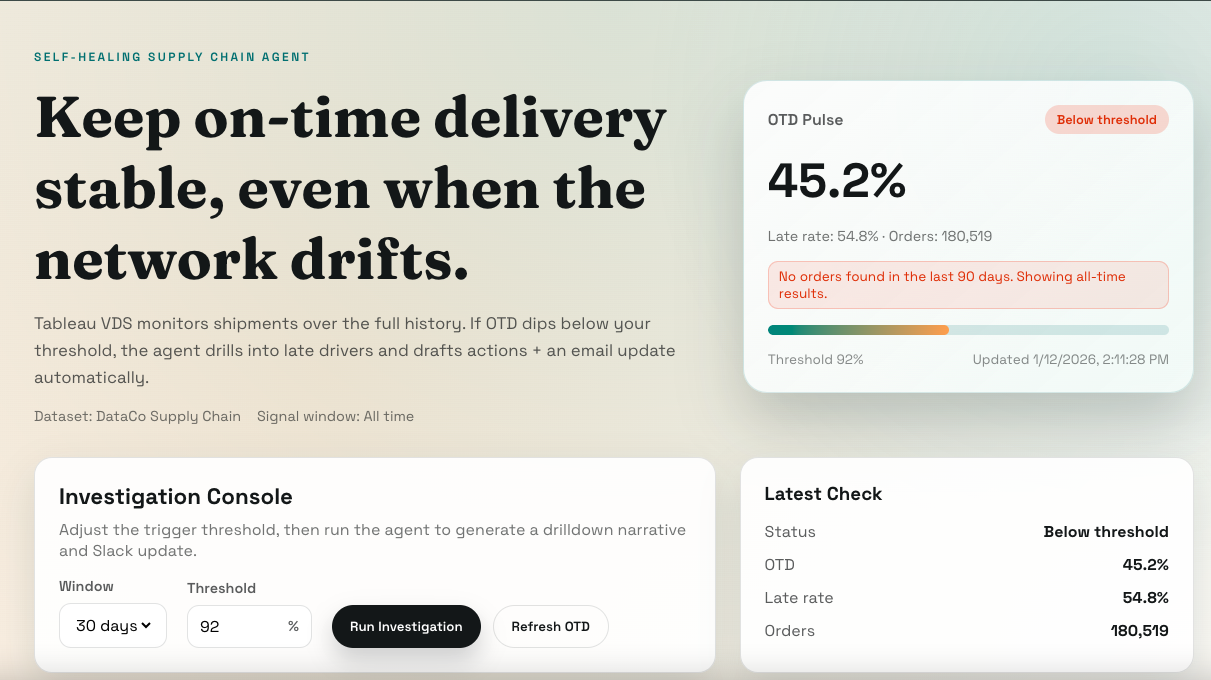
- Pulls the latest OTD (on‑time delivery) over a configurable time window
- Detects threshold breaches
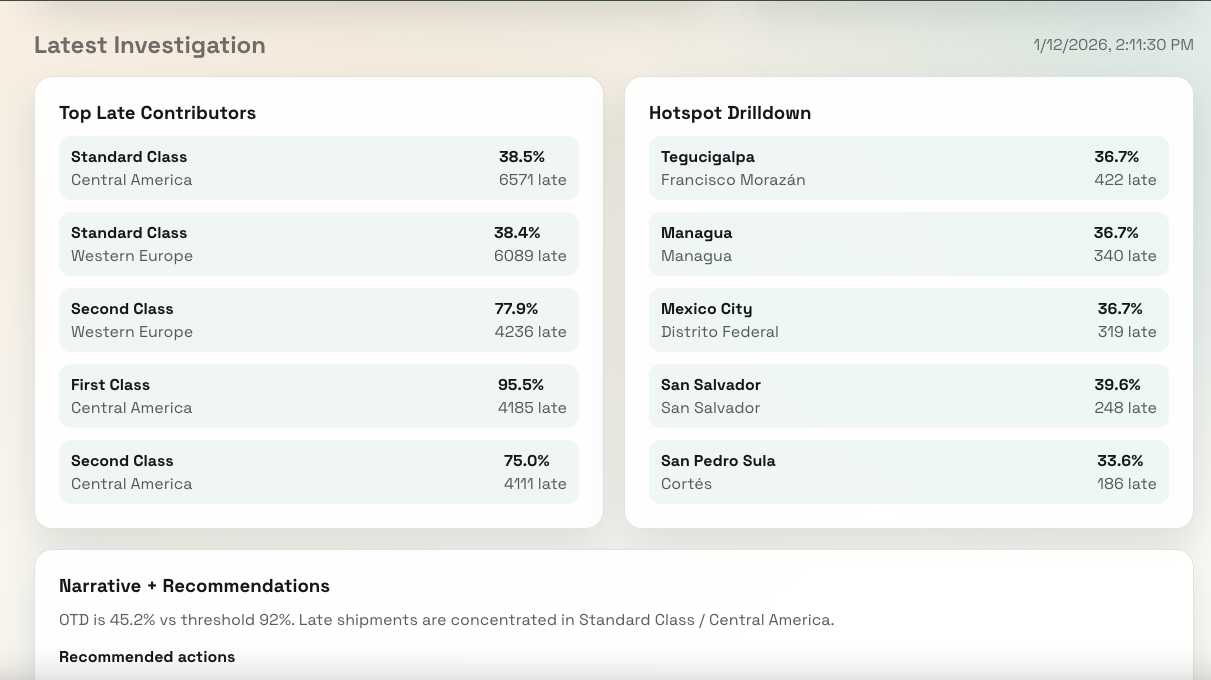
- Drills down by Shipping Mode + Region and surfaces city/state hotspots
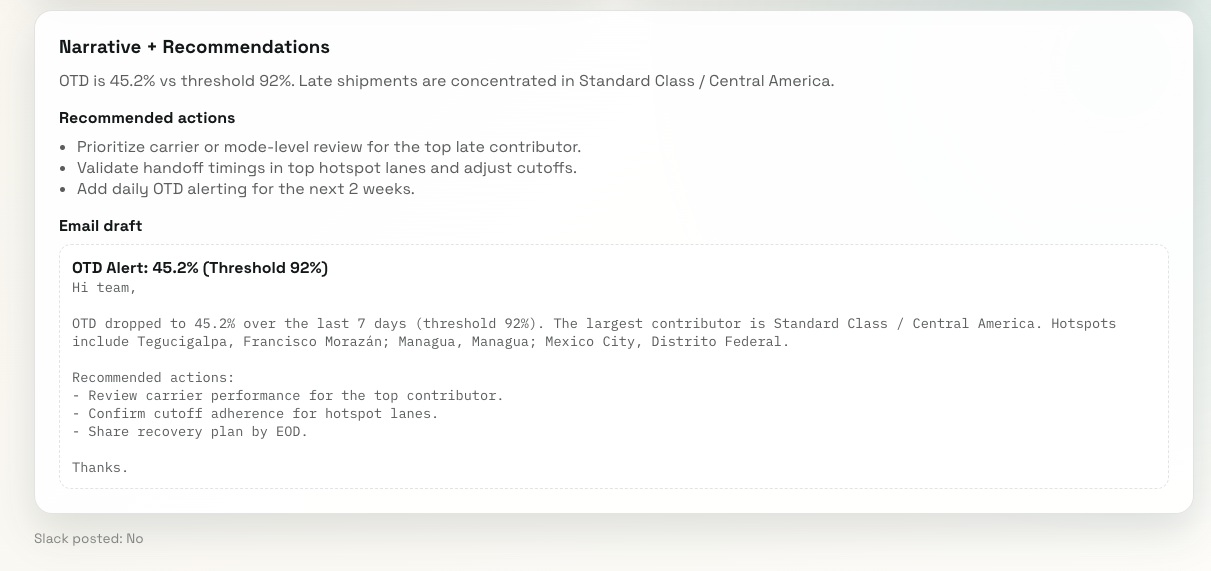
- Generates a concise investigation summary, recommendations, and an email draft ## How we built it
- Next.js (TypeScript, App Router) UI + API routes
- Tableau REST API for PAT sign‑in
- Tableau VizQL Data Service (VDS) for metadata + queries
- OpenAI Responses API for narrative generation (optional; fallback templates if missing) ## Challenges we ran into
- VDS schema nuances (filters must use field object)
- Data field captions differ after publishing → solved with metadata‑based field resolver
- Recent data gaps → implemented auto‑expanding time window (7→30→90→all‑time)
Accomplishments that we're proud of
- End‑to‑end working MVP in a day
- Stable VDS integration with automatic field matching
- Clear drilldown narrative + actions ready for ops teams
What we learned
- How to structure VDS queries for KPI + drilldown flows
- Practical PAT auth + metadata matching patterns
- Building a “self‑healing” workflow with minimal dependencies ## What's next for Tableau VDS Driven Self‑Healing Supply Chain Agent
- Slack integration + scheduled runs
- Trend sparkline and alert history
- More metrics and multi‑datasource support
Built With
- next.js
- openai
- tableau-cloud
- tableau-rest-api
- typescript
- vizql-data-service

Log in or sign up for Devpost to join the conversation.