-
-

Team Skyview | 2025 Tableau Next Hackathon Team | Joseph Harris & Neha Sharma
-
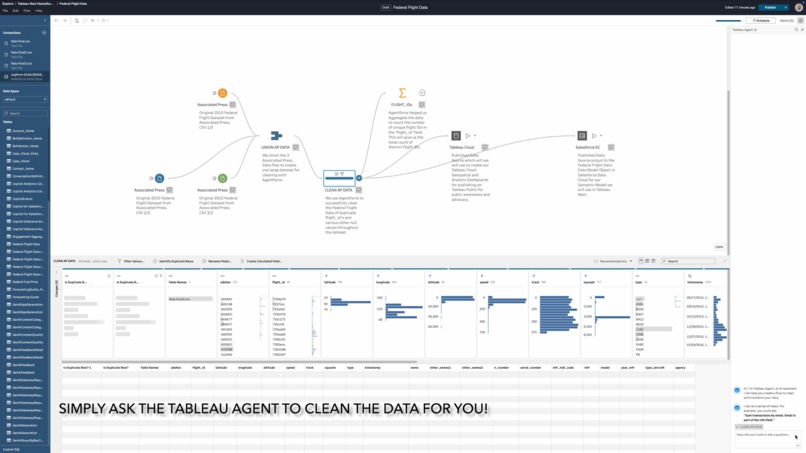
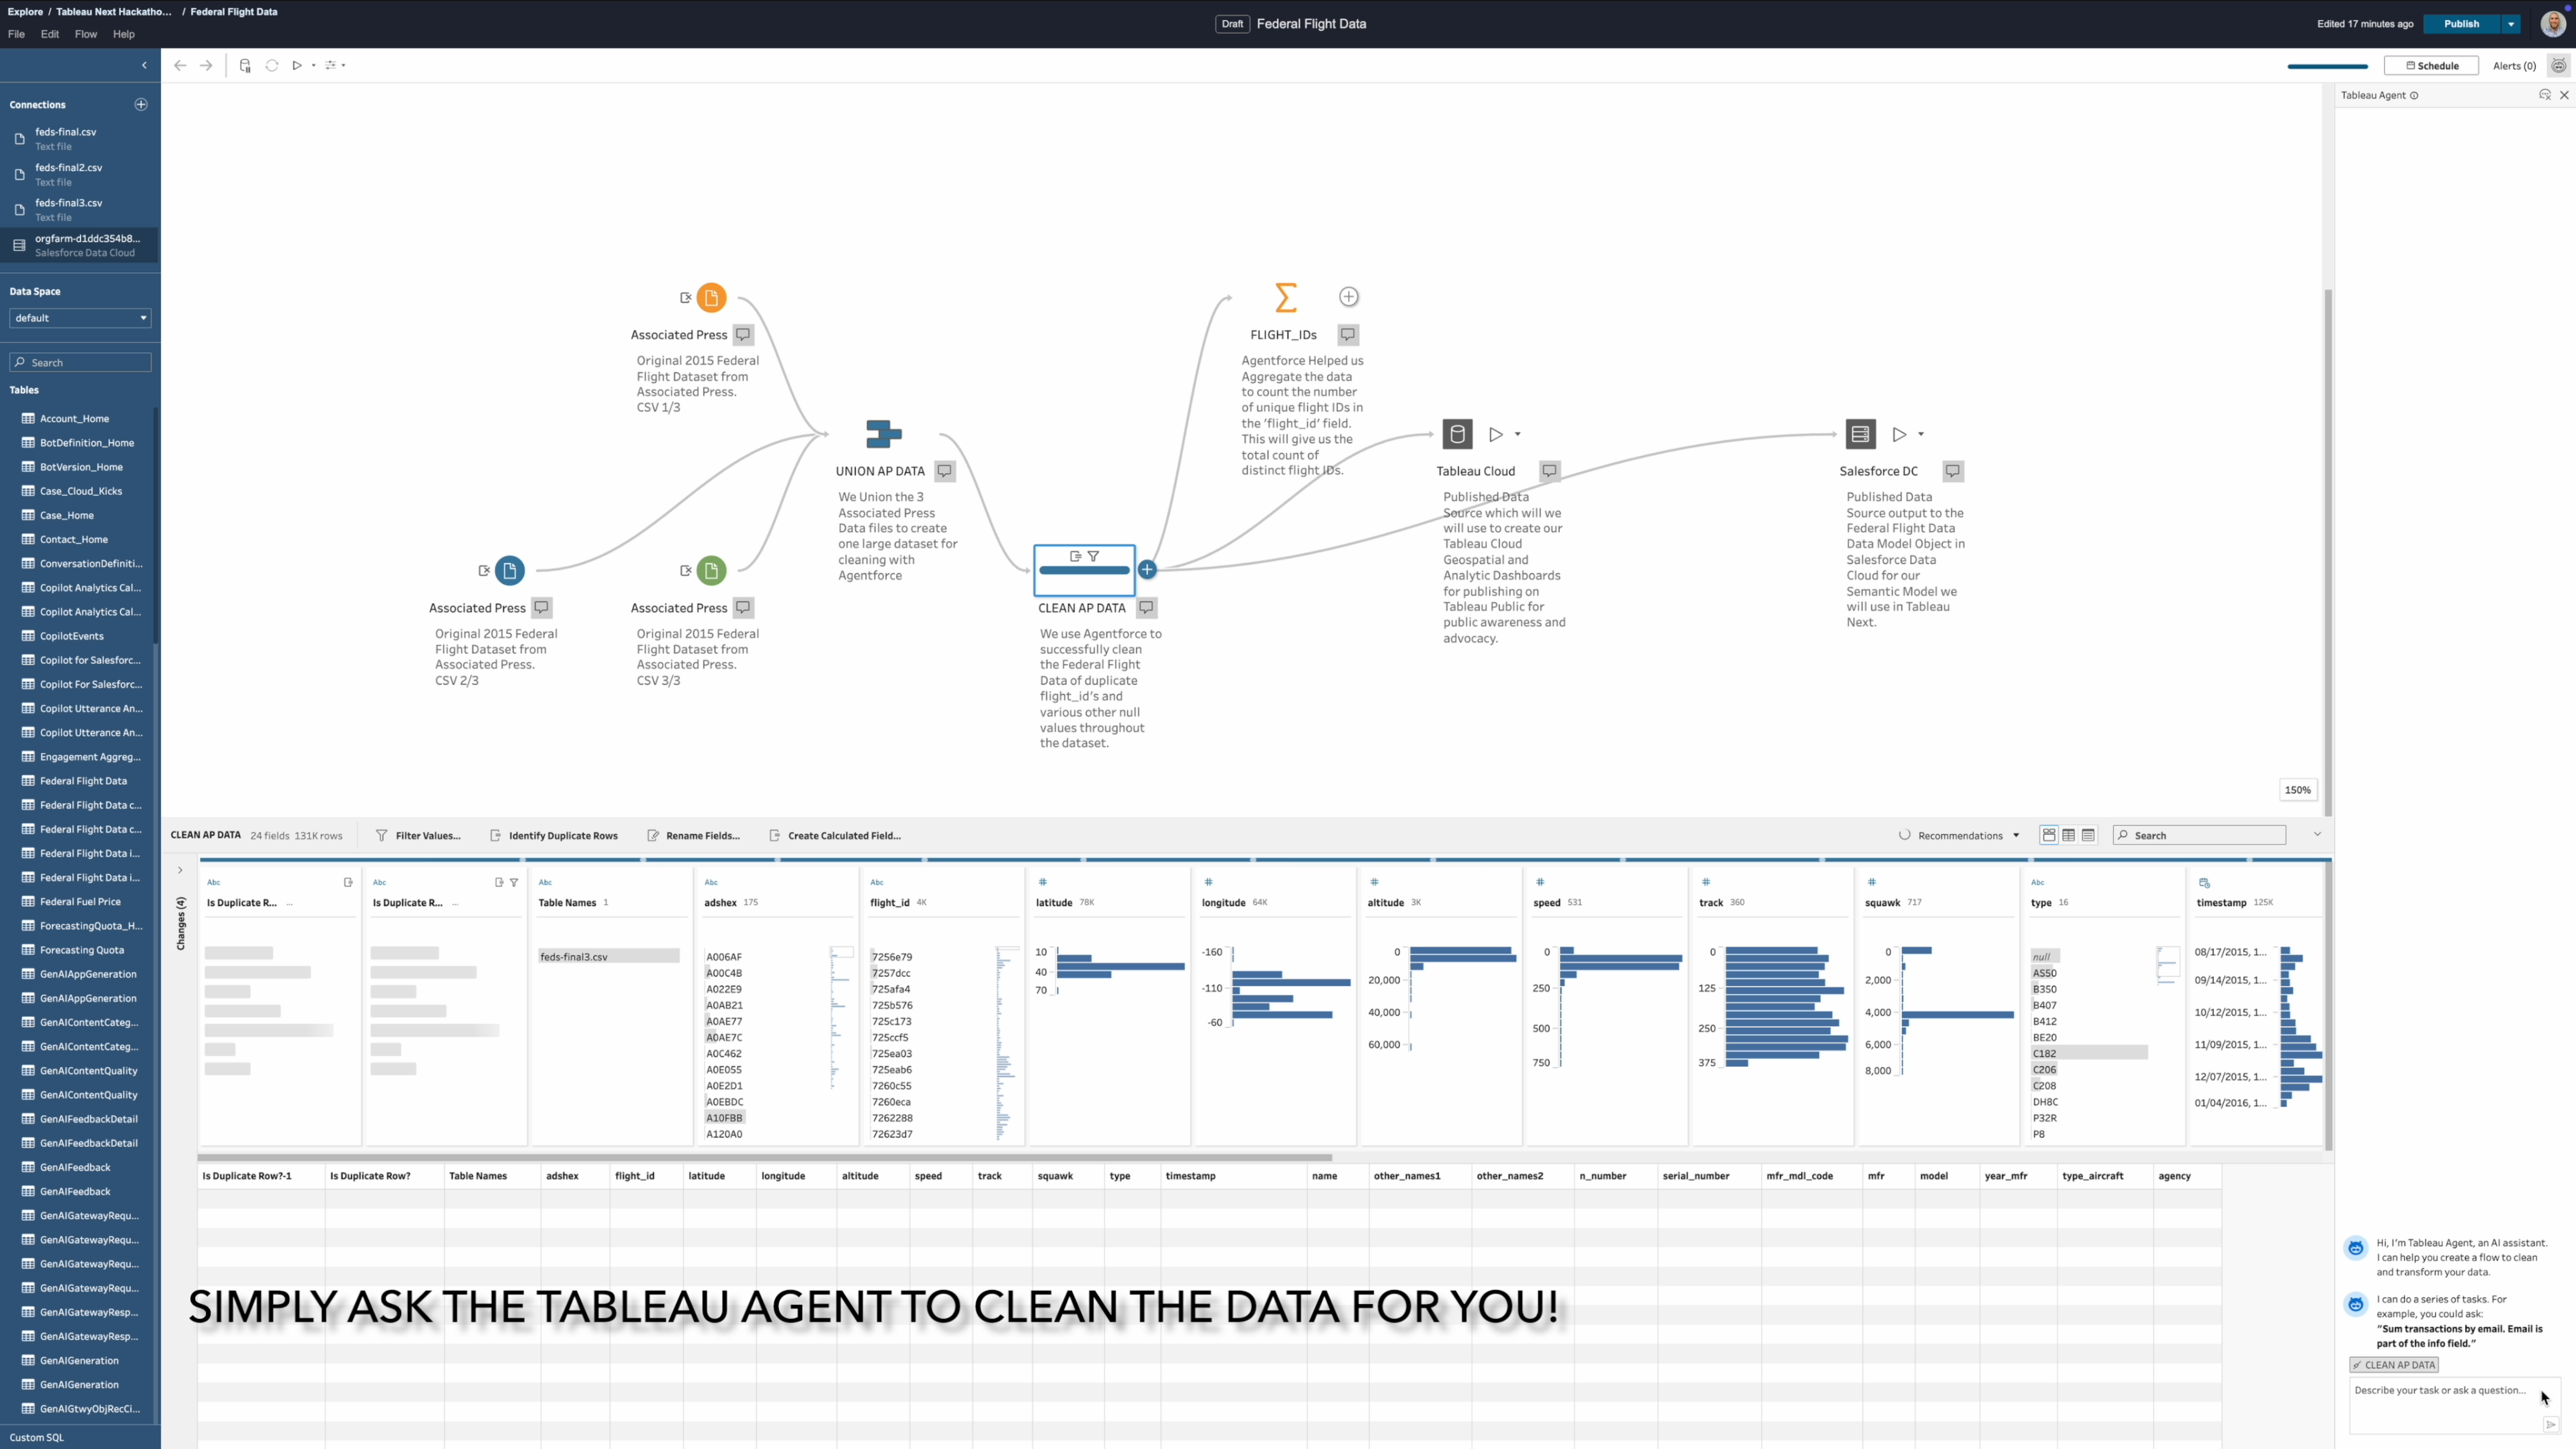
Joseph Used Tableau Prep w/Agentforce to Successfully Clean the Data in his Tableau Cloud!
-
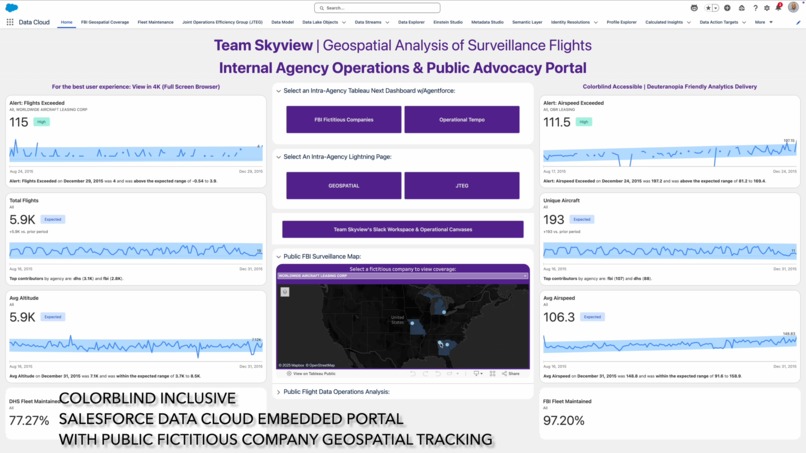
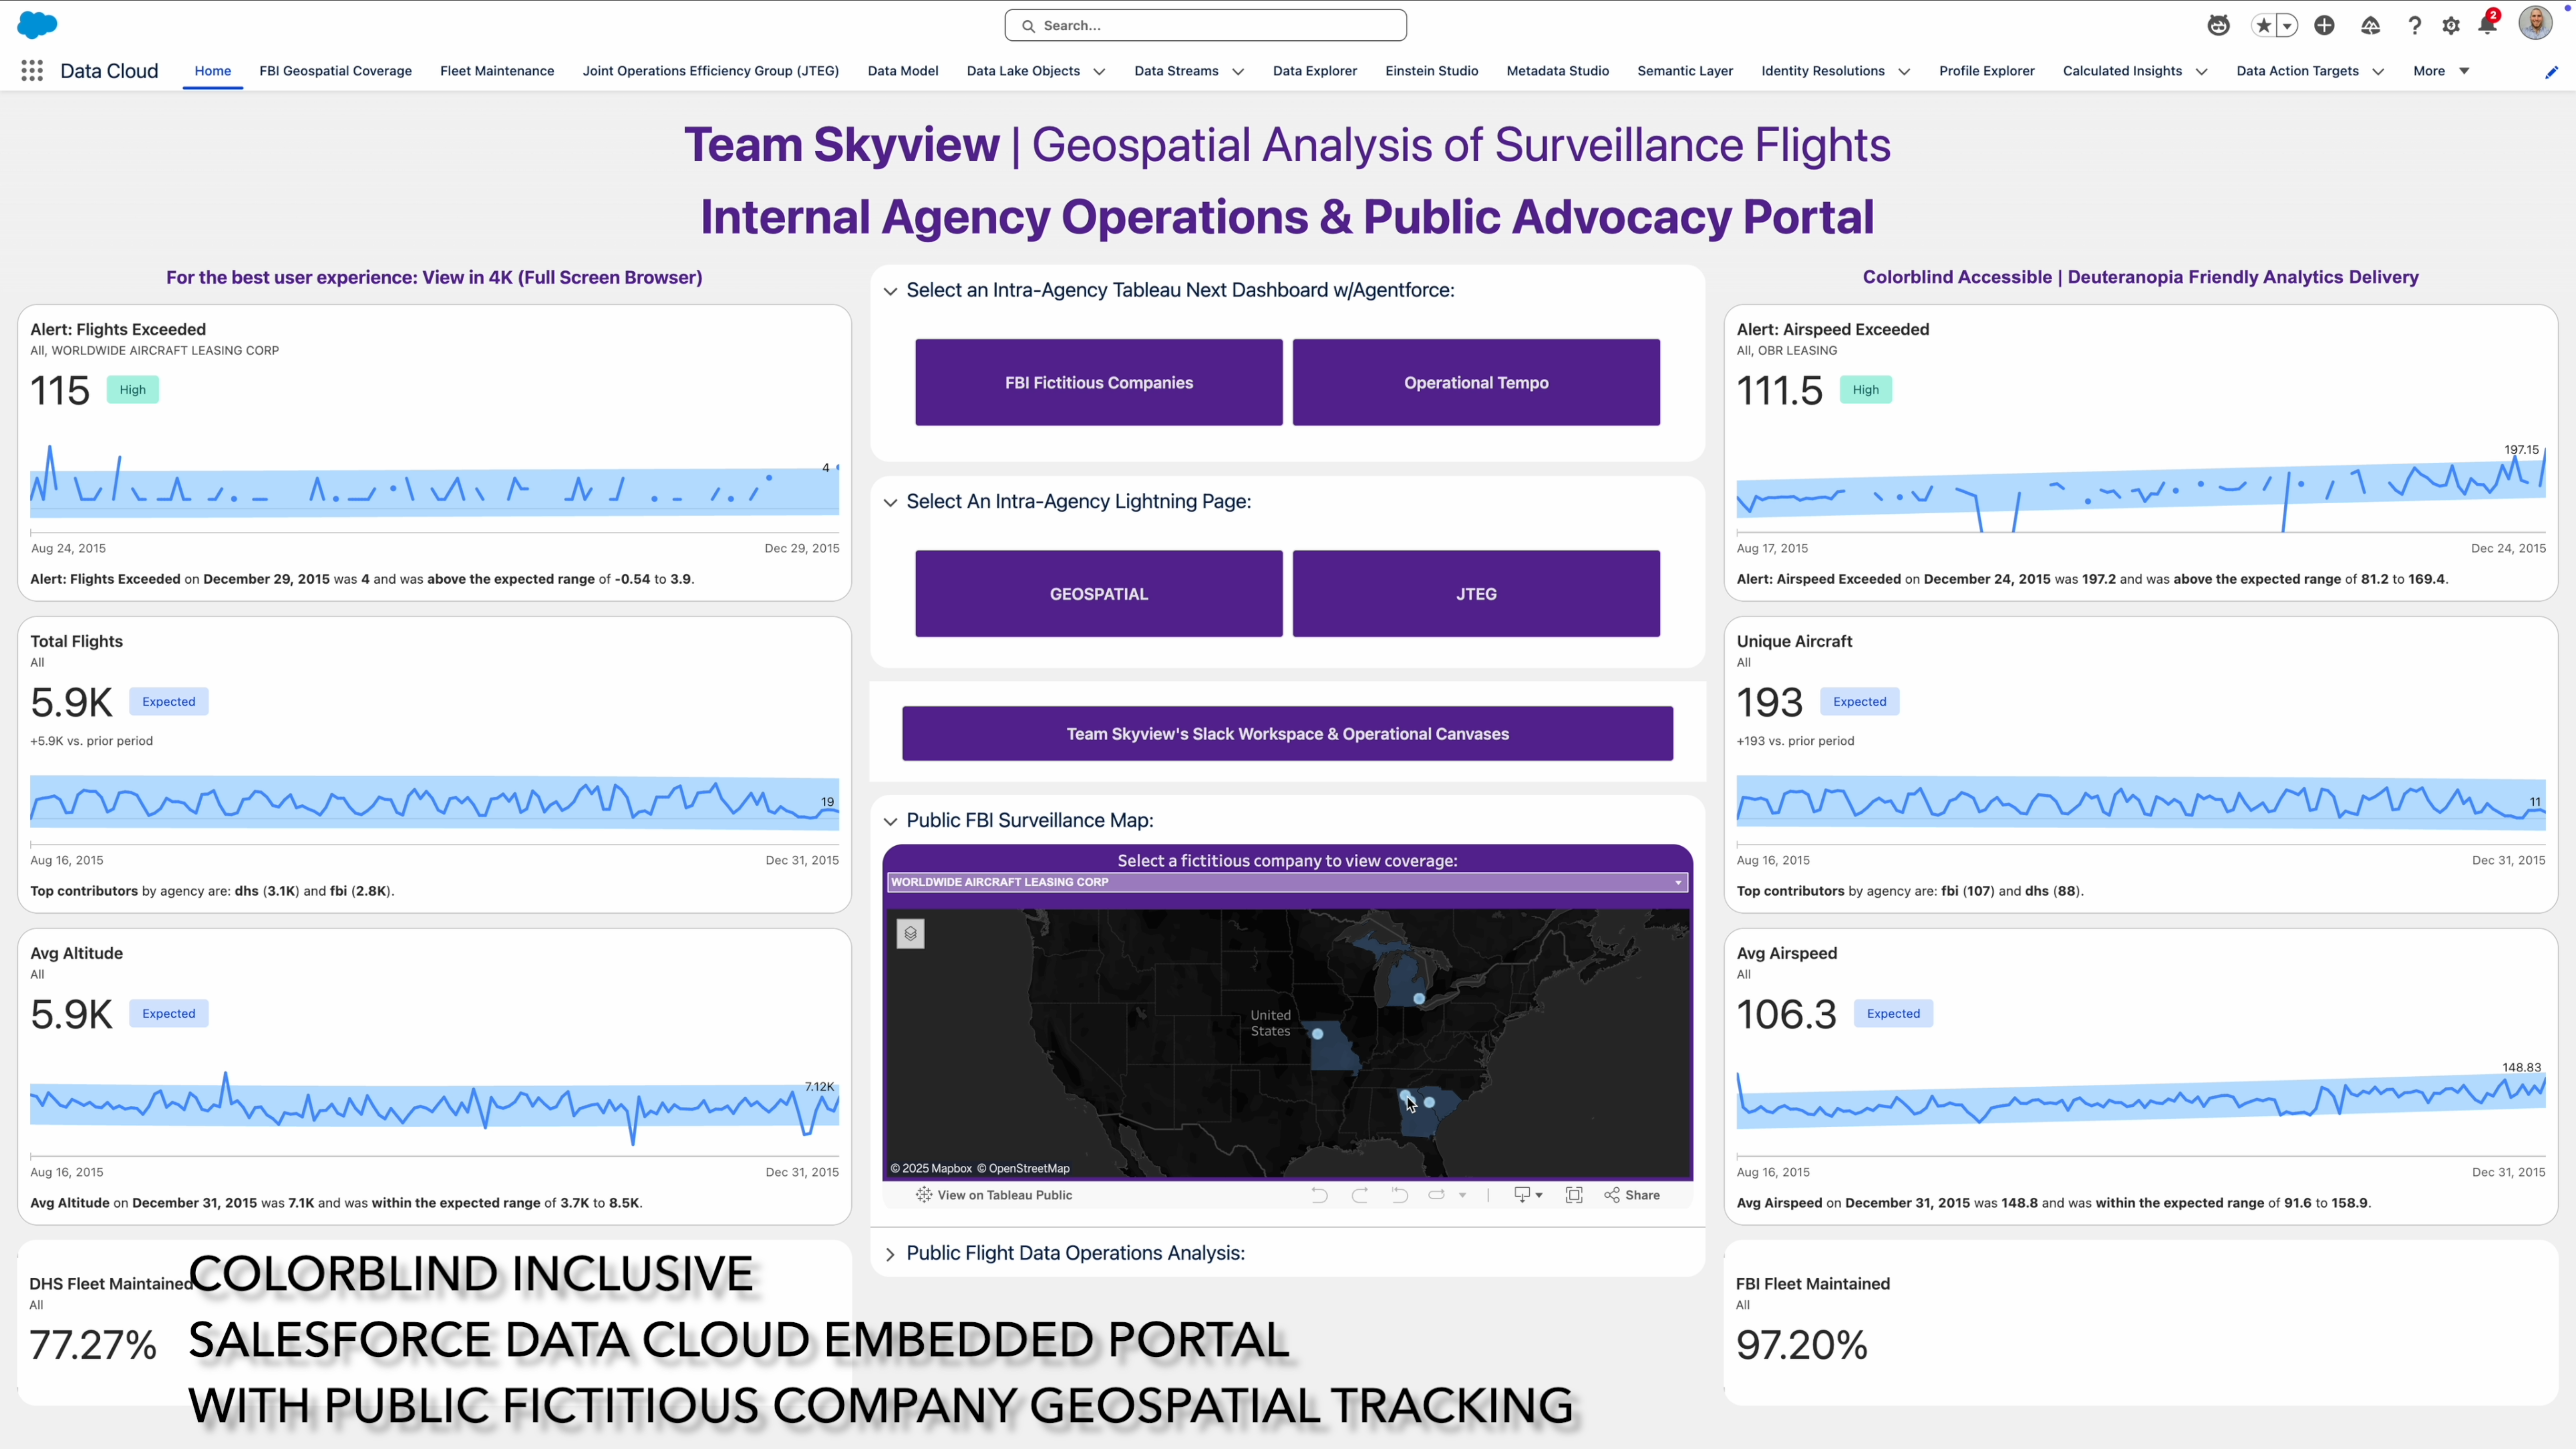
Joseph & Neha's Internal Salesforce Data Cloud Colorblind Accessible Intra-Agency Lightning Page
-
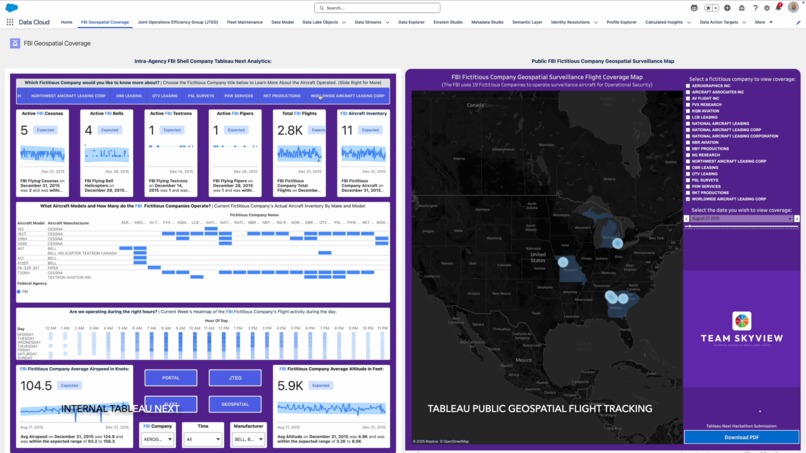
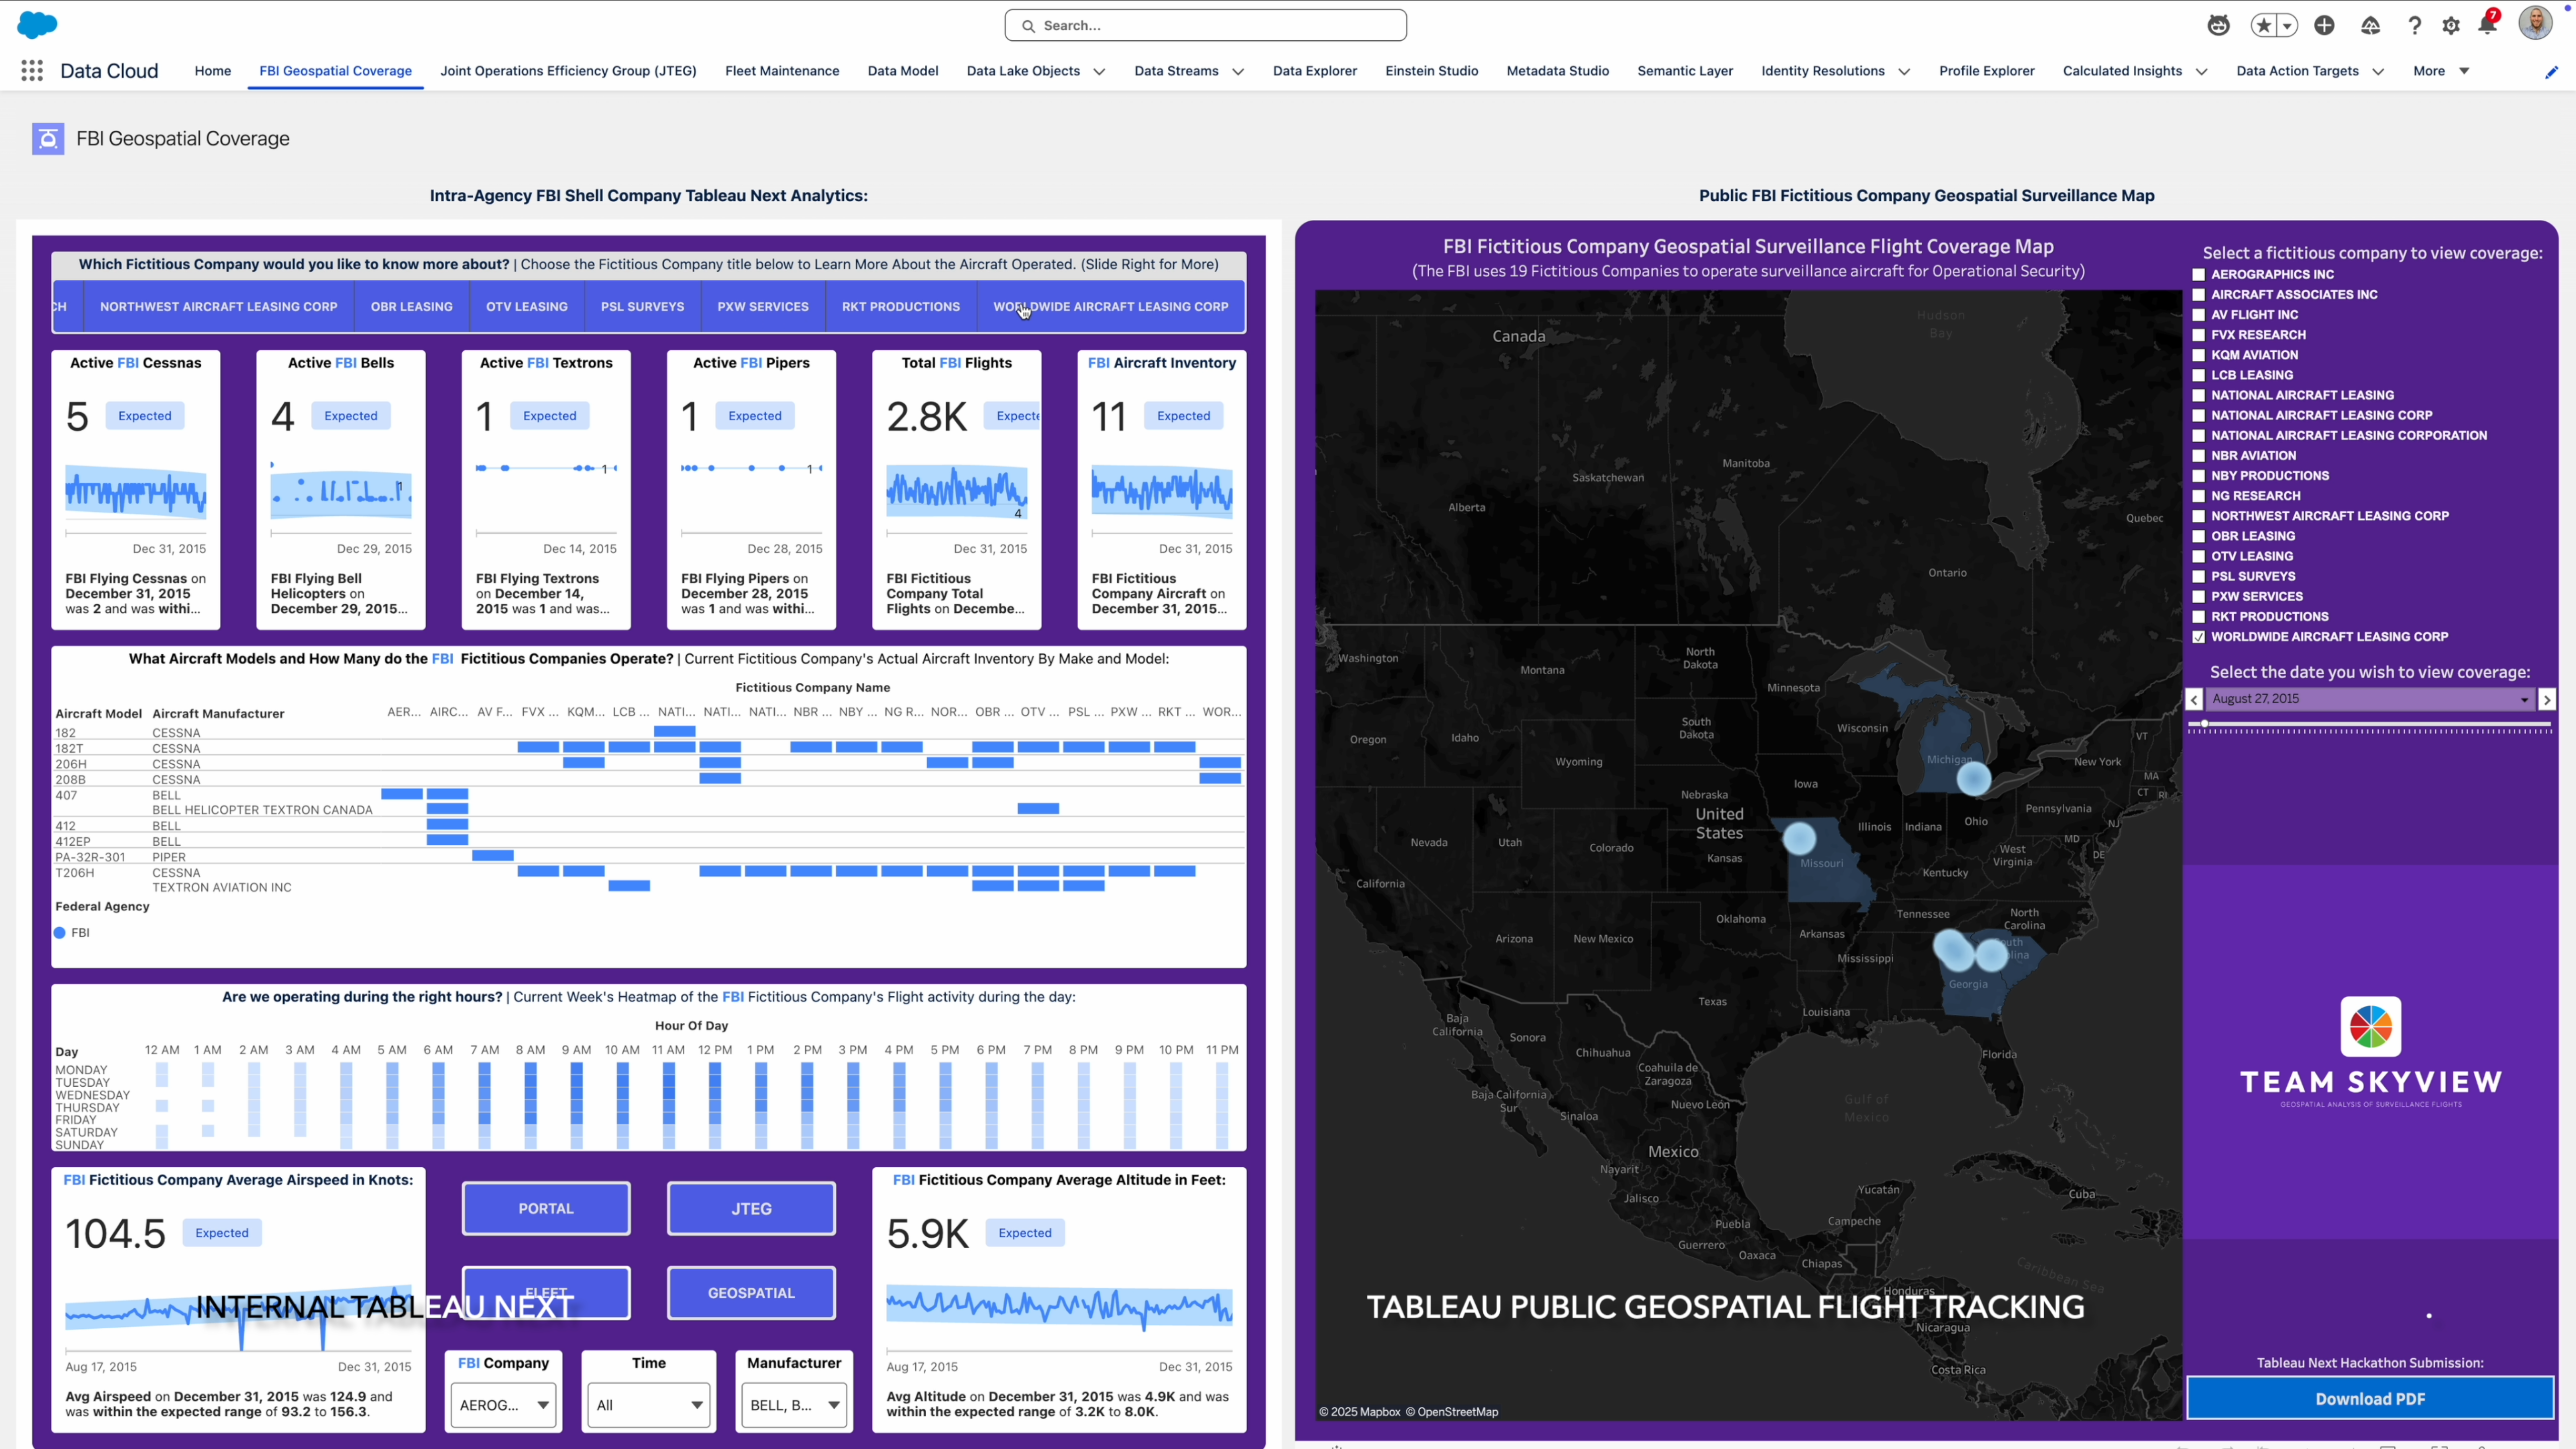
Joseph's Embedded Tableau Next & Public Dashboards for Public Advocacy around Fictitious Companies!
-

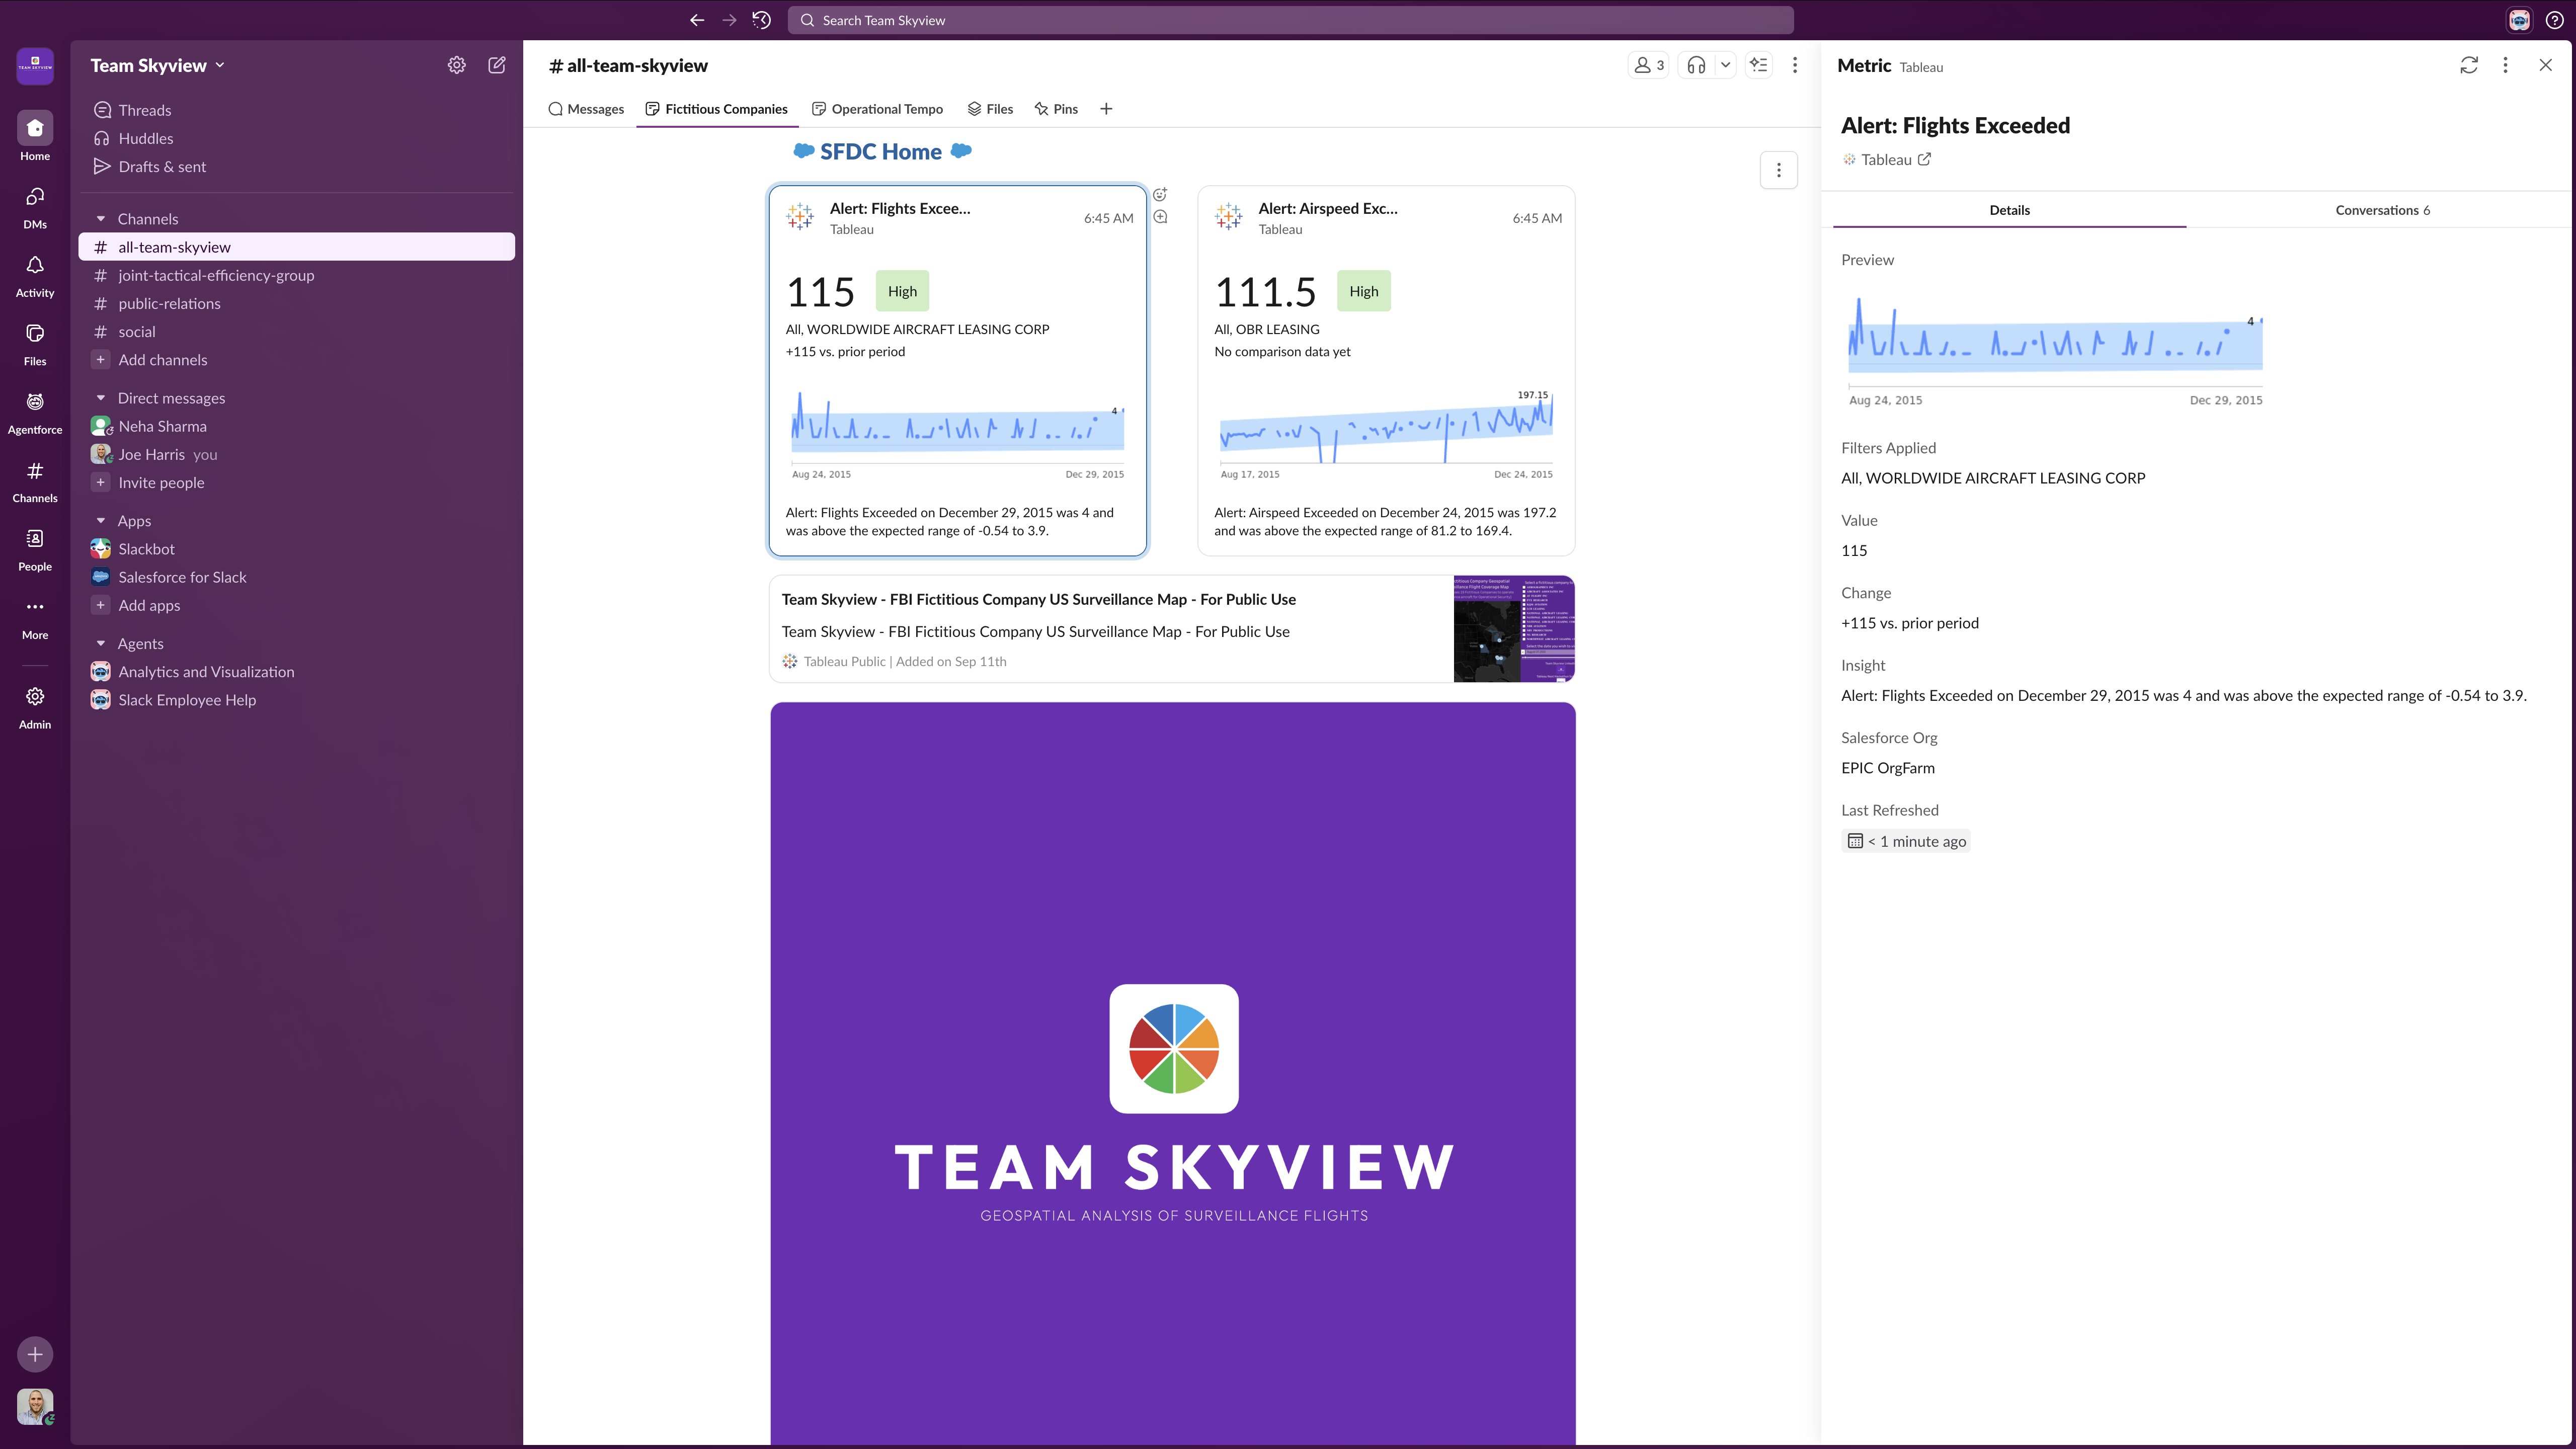
Joseph's Tableau Next & Agentforce Fully Integrated Slack Fictitious Companies Canvas
-
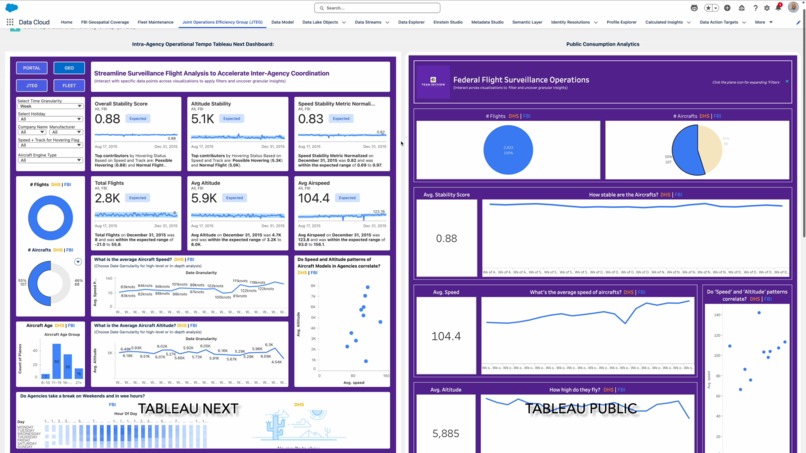
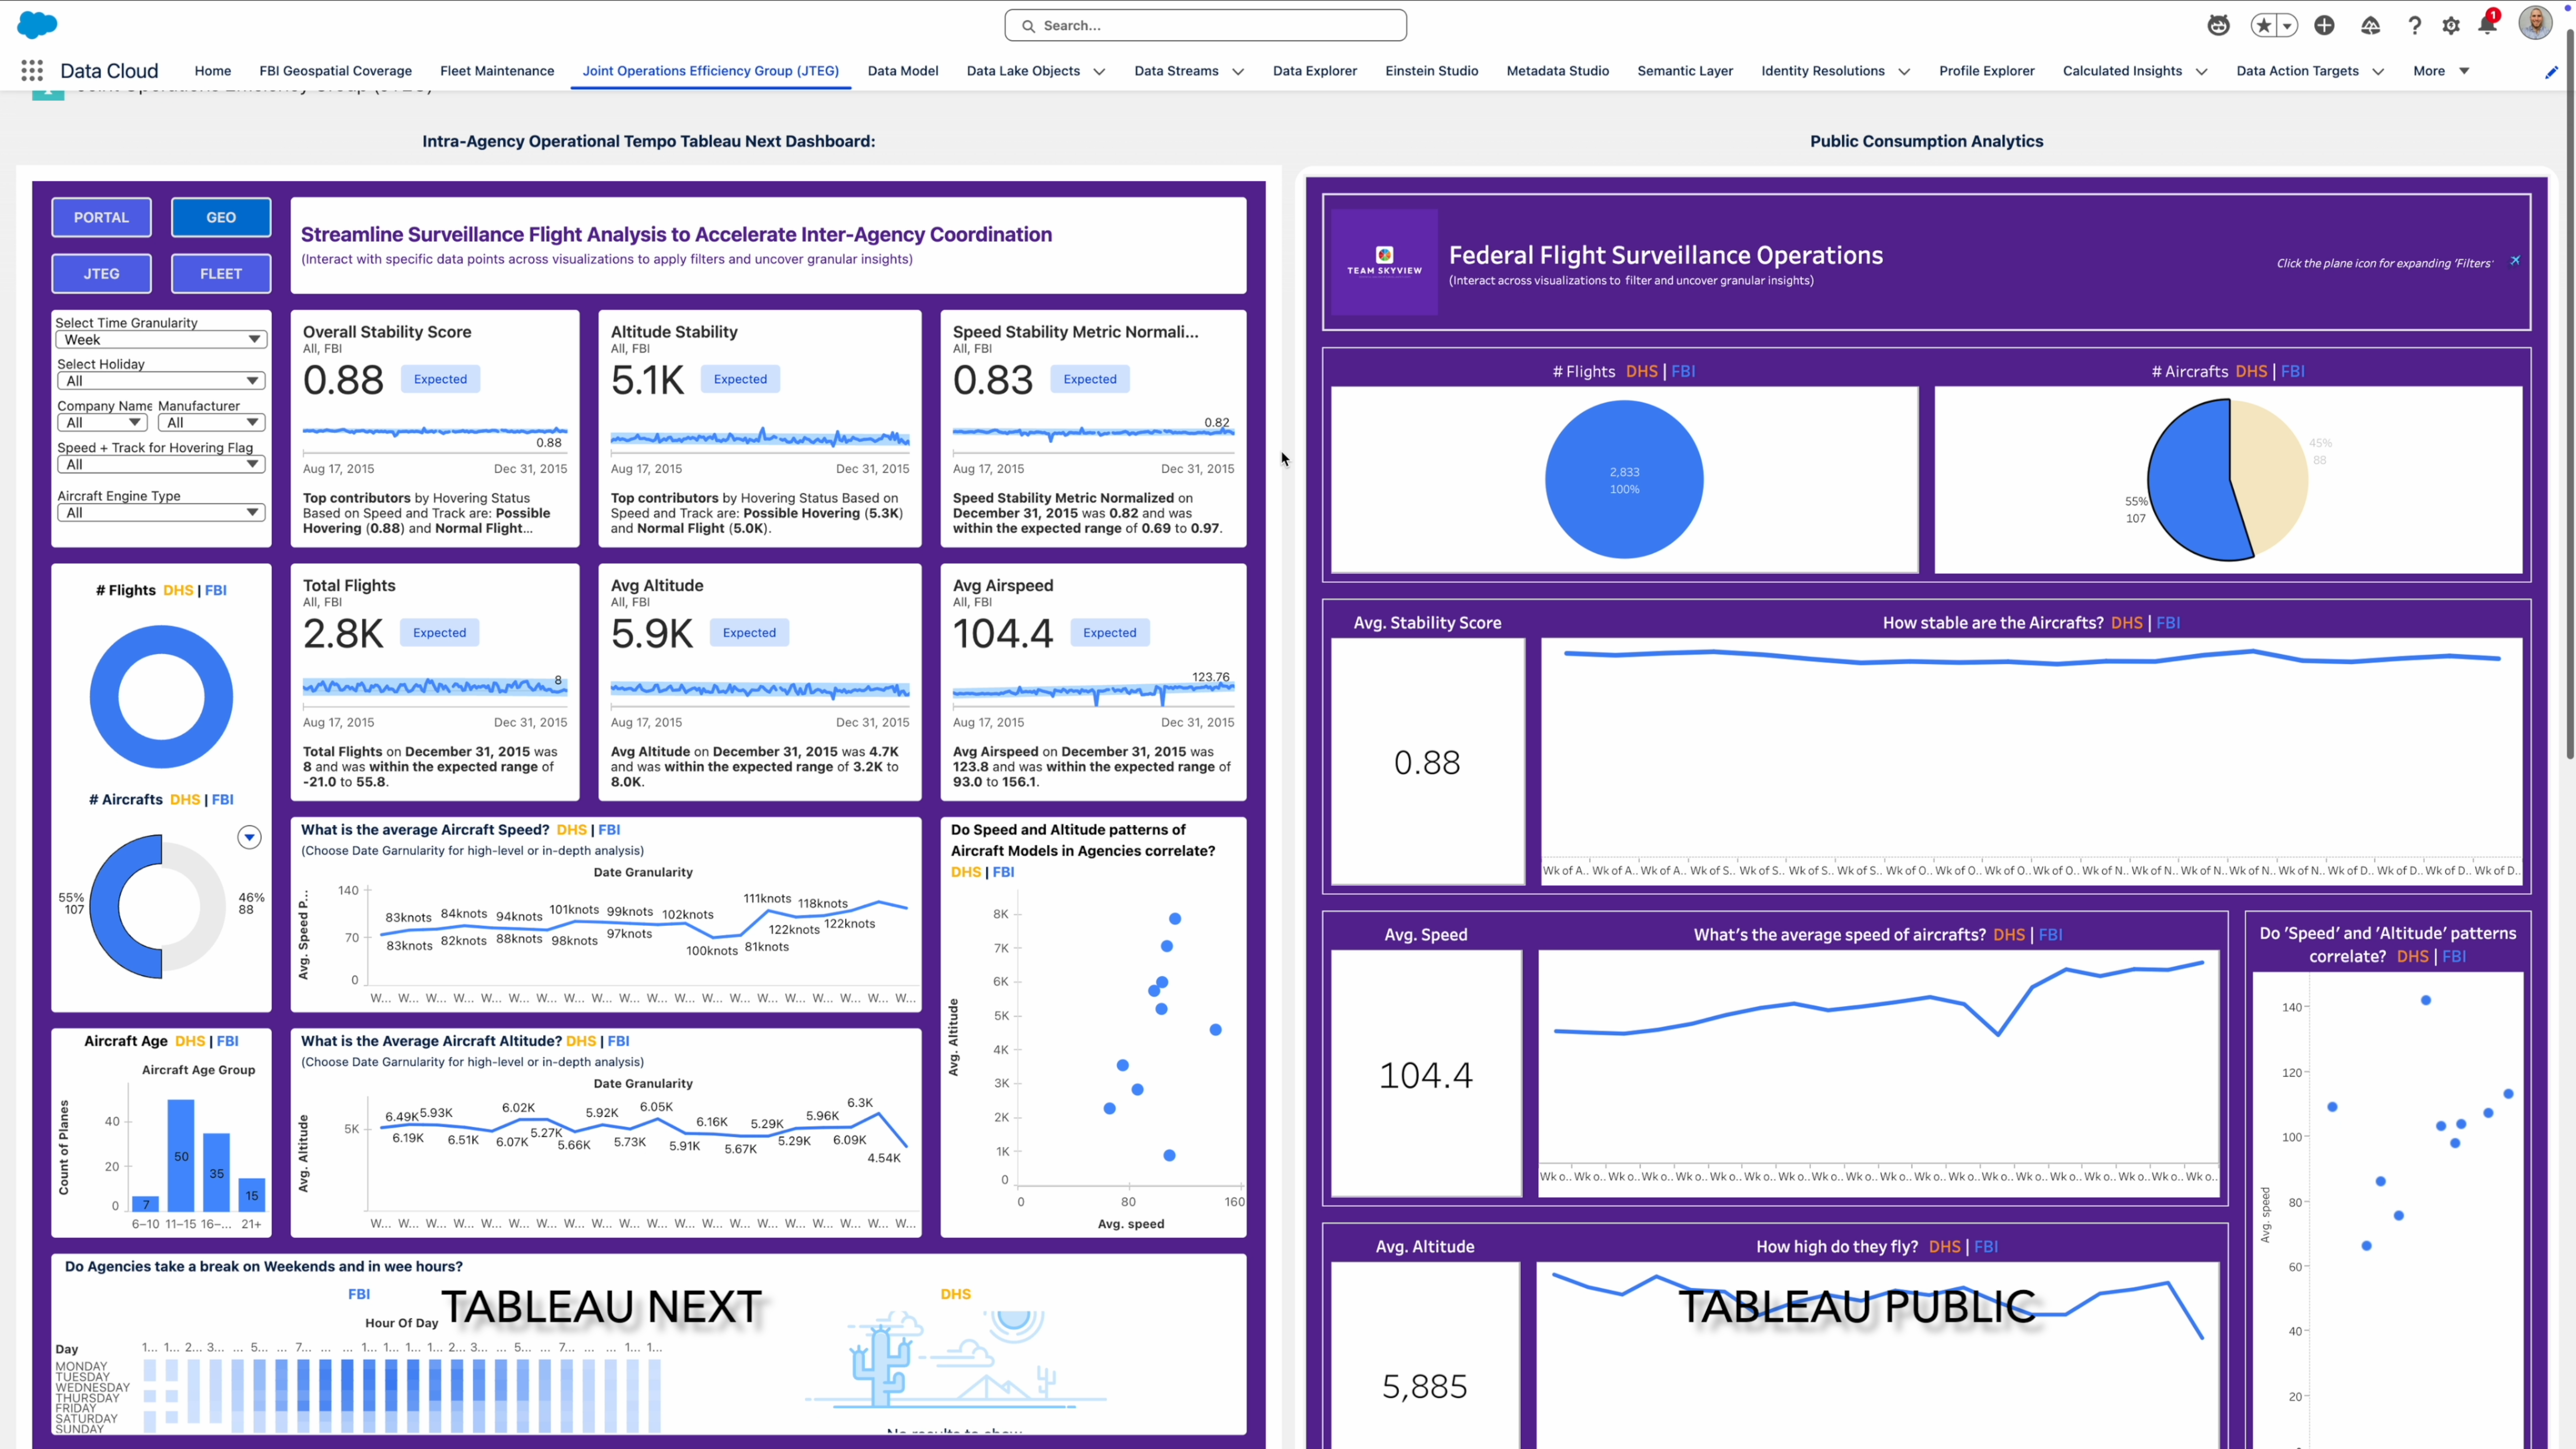
Neha's Embedded Tableau Next & Public Dashboards Building Awareness over Internal Operations!
-
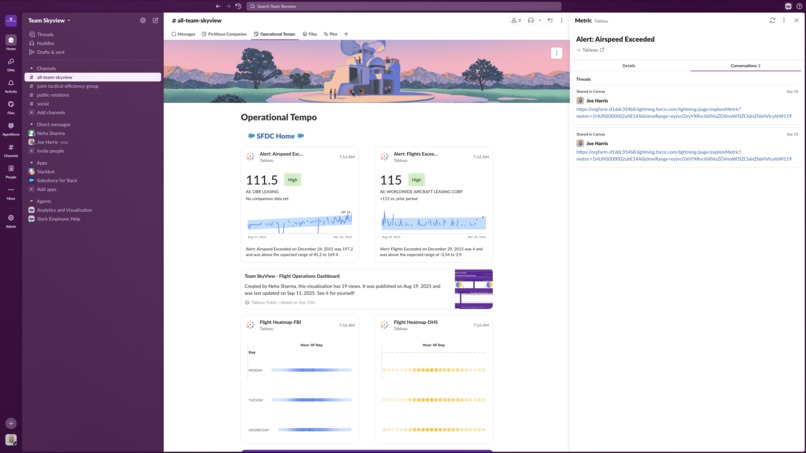
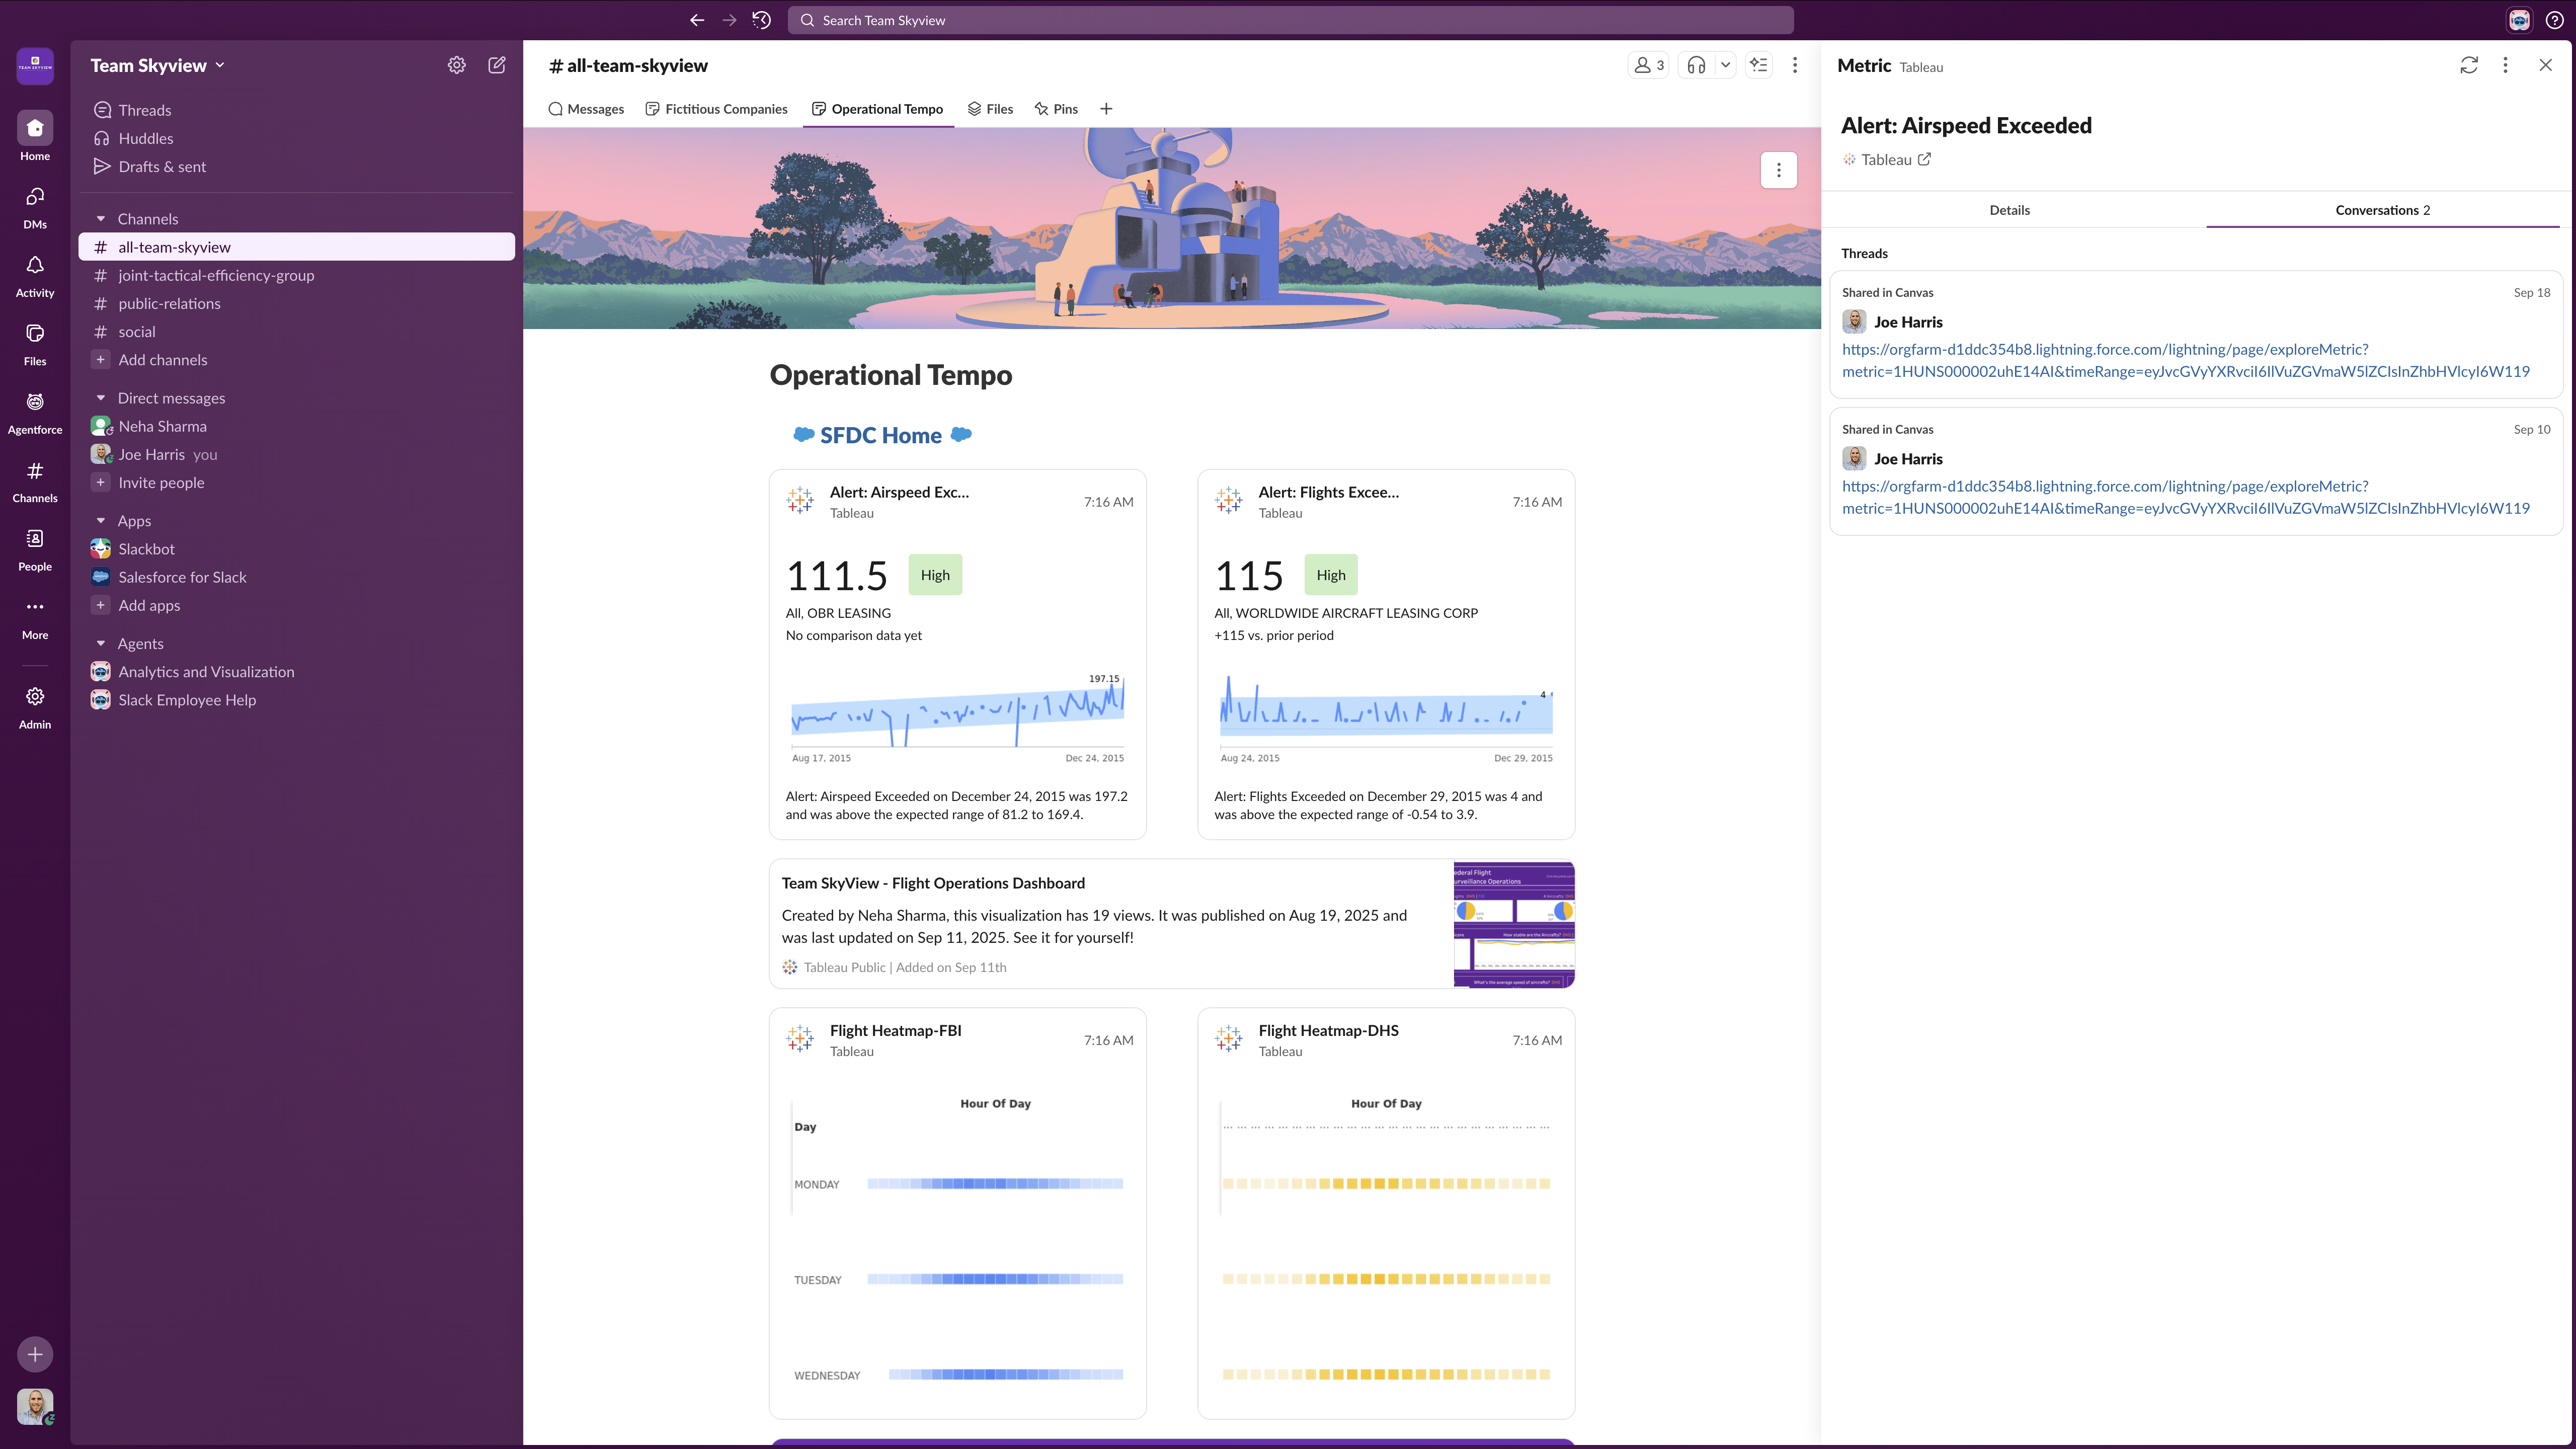
Neha's Tableau Next & Agentforce Fully Integrated Slack Operational Tempo Canvas
Team Skyview
Business Mission Objectives:
1. Boosting Intra-Agency Operational Tempo Excellence (Neha)
2. Establishing Fictitious Surveillance Company Public Advocacy (Joseph)
1. Our Inspiration & Mission Assignments
August 5, 2025, Joseph was inspired by Tableau's Free Public Data Set for Analysis: Government.
August 11, 2025, Joseph creates Team Skyview; Neha joins our mission.
Tableau's free public data set for analysis drove the inspiration for Neha and Joseph to immediately harness the power of Tableau Next by enabling actionable, insightful metrics to boost intra-agency operational tempo while simultaneously establishing public advocacy surrounding the fictitious aircraft companies various agencies operate. Neha's Public Flight Operations Dashboard, and Joseph's Public Fictitious Company US Coverage Map, will go beyond traditional internal Tableau analytics, and tell the public a dynamic story of the many surveillance operations within in the United States. By using Tableau Next, within a deeply unified Salesforce Data Cloud platform, while being fully integrated with Salesforce's Agentforce Agentic AI Analytics in Tableau, Joseph and Neha, through collaboration and joint passion, were able to easily complete their two assigned, mission critical objectives.
2. Dual Mission & Ongoing Success with Tableau Next!
Neha and Joseph designed their Internal Tableau Next dashboards so they could link seamlessly to external Tableau Public dashboards and internal Salesforce Lightning pages, making Intra-Agency Portal navigation effortless. Team Skyview's Tableau Next integrated Slack Pro workspace, where Agentforce Agentic AI helped Team Skyview discover new, insightful metrics, provides instant, actionable answers about flight surveillance data through two integrated operational Slack Pro canvases. Joseph and Neha enriched the Tableau Next Semantic Model with carefully designed metrics relevant to their dashboards and leveraged Einstein to create and refine calculated fields. Team Skyview ensures all data stays within the confines of Salesforce's trust layer; a big win for security, governance and overall public trust!
Neha’s Joint Tactical Efficiency Group (JTEG) Operational Tempo Lightning Page became the powerhouse of this project. It allows users to select Date Granularity, Agency, Manufacturer, and more to monitor Flight Counts, Aircraft Numbers, Active Times, Speed, and Altitude. By comparing Hovering vs. Straight-Line patterns, users can quickly spot performance highs and lows and take corrective action without delay. Neha complimented her Operational Tempo Tableau Next Dashboard with her Tableau Public Dashboard informing the public of intra-agency operational insights.
Joseph's Fictitious Company Geospatial Coverage Lightning Page brought an entirely new perspective by shifting the focus to companies under agency scope, using the agency assigned fictitious company names for security purposes. He designed it for public awareness while also supporting intra-agency evaluation of fictitious company performance metrics. Joseph's geospatial map, embedded in the dedicated Salesforce Lightning page, connects Joseph's Fictitious Companies Tableau Next Dashboard with his Tableau Public Dashboard enhancing intra-agency usability and establishing public awareness.
Neha and Joseph made sure to utilize every Tableau product and functionality in this project—Tableau Prep, Tableau Next, Tableau Cloud, Tableau Public, Tableau Desktop and Agentforce's Tableau AI Agent. They rounded it up by building a dedicated main Deuteranopia Colorblindness & Low-Vision Accessible Salesforce Data Cloud Lightning Portal for maximum operational efficiency. To top it off, Neha and Joseph connected Team Skyview's Slack Pro Workspace, where a special Team Skyview Hackathon judge could experience the ongoing action themselves!
(Private Salesforce/Slack Pro/Email credentials enclosed in the submission)
3. Tableau Public Data Source & Public Dashboards:
Public Data Source from Tableau: Free Public Data Sets For Analysis - Government
The key columns utilized for our metrics, parameters & calculated fields are:
• timestamp: Tracking each flight point's exact date and time.
• latitude & longitude: Creating all geospatial geometry visualizations.
• agency: Filtering and comparing flights by the originating agency.
• filght id: Determining specific flight patterns and trends.
• altitude & speed: Providing context on flight characteristics.
• mfr & model: Identifying the types of aircraft being flown.
• name: Identifying the the different fictitious company names.
Neha's Dashboard: Published August 19, 2025 Team Skyview - Flight Operations Dashboard
Joseph's Dashboard: Published August 18, 2025 Team Skyview - FBI Fictitious Company US Surveillance Map
Team Skyview: LinkedIn
Neha Sharma - Canada, Lead Data Strategist, Data Storyteller & Solutions Architect (she/her)
Joseph Harris - USA, Team Leader, Project Representative & Certified Tableau Architect (he/him)
Thanks for viewing our Hackathon Project!
Kind Regards, Joseph & Neha
Our Project's No Copyright Soundtrack: Happy – MusicbyAden (No Copyright Music) 432Hz - Youtube
Built With
- agentforce
- agentic-ai
- csv
- esri
- faa-airport-service
- geospatial
- gis
- imovie
- public-transit-data-community
- salesforce
- salesforce-data-cloud
- shp
- slack
- sql
- tableau
- tableau-ai
- tableau-cloud
- tableau-next
- tableau-prep
- tableau-public
- youtube


")


Log in or sign up for Devpost to join the conversation.