-
-
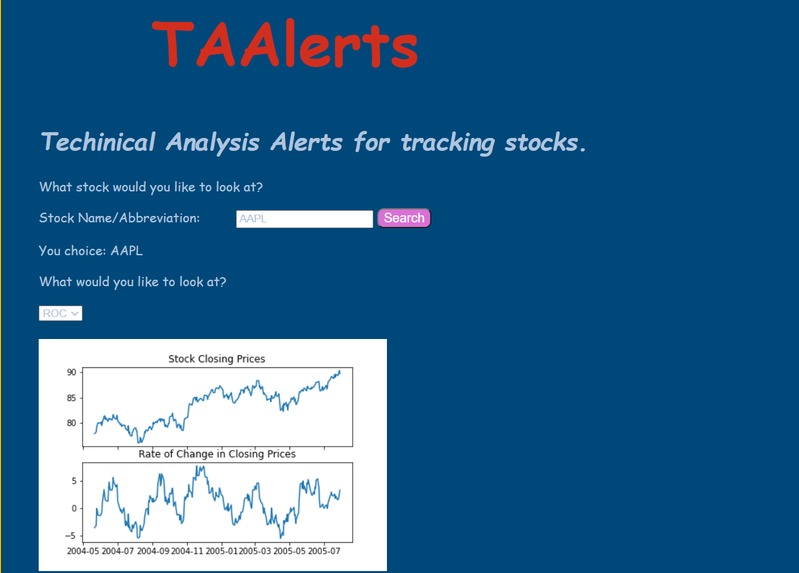
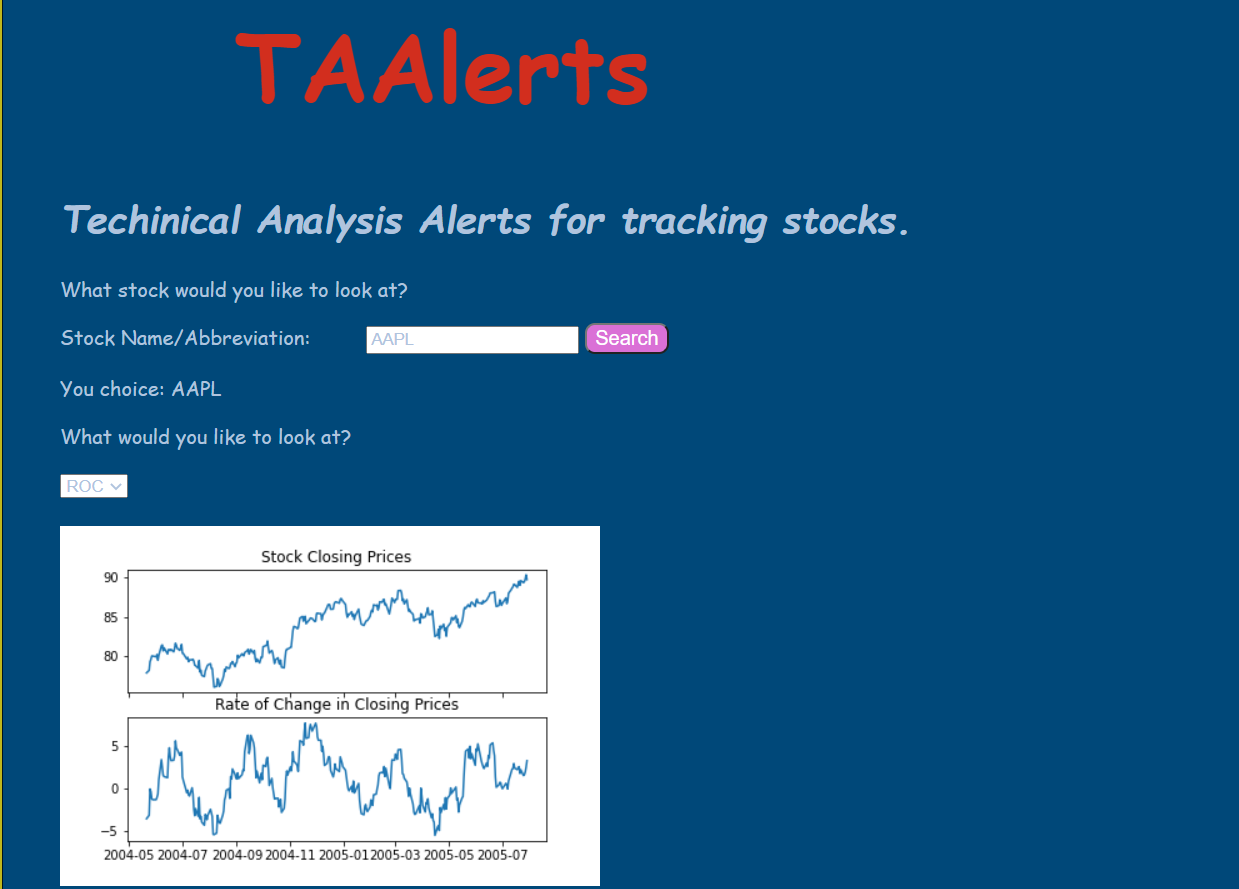
Demo of the website
Inspiration
We know that predicting stock prices is difficult, especially for the average investor. However, there are strategies for predicting trends, and making informed decisions is a key characteristic of a successful investor. We intend to make stock analysis and prediction as accessible as possible.
What it does
TAAlerts shows stock closing prices and different metrics for stock analysis over time. The user can enter a stock symbol and track the closing price and either price rate of change or relative strength index over time. We intend to implement more metrics for prediction and tracking in the future.
How we built it
For the backend, we used python and the pandas library to analyze the stock data.
For the frontend, we used CSS and HTML to make the website.
Challenges we ran into
It was difficult to implement all the stock metrics, so we were only able to complete RSI and ROC. Further, we were not able to tie together the user input to fetch current stock prices from the internet. For demo purposes, we are using a single archived stock's data to visualize the metrics.
Accomplishments that we're proud of
We are proud of the clean style of the website and how intuitive it is to choose different metrics. We are also proud of the fact that we included information for people to learn more about the stock trends.
What we learned
We learned the basics of large data analysis using pandas and building webpages using HTML and CSS
What's next for TAAlerts
Next, we would like to fully implement user selection and allow for more metrics to visualize.


Log in or sign up for Devpost to join the conversation.