-
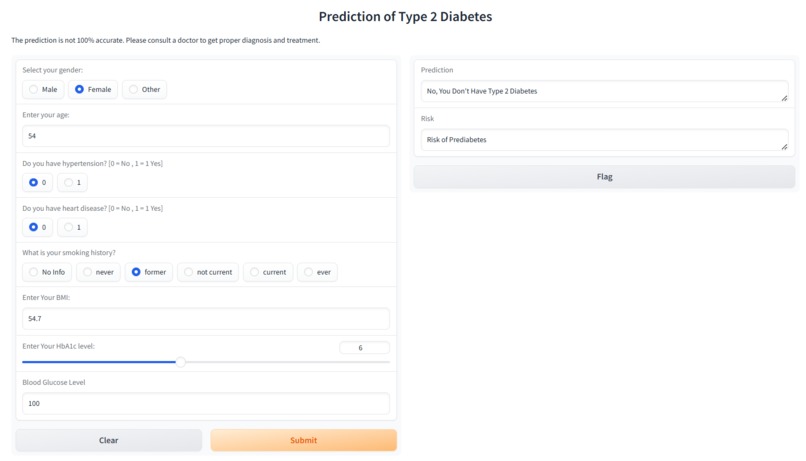
Prediabetes Prediction GUI Output 1
-
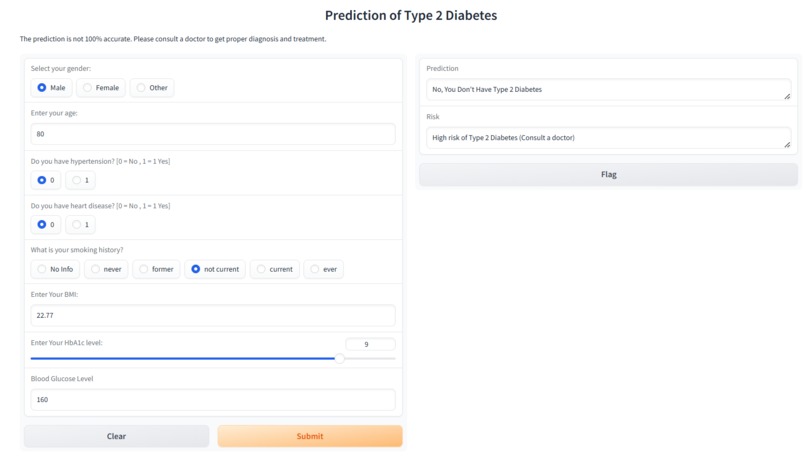
Type 2 Diabetes Prediction GUI Output 3
-
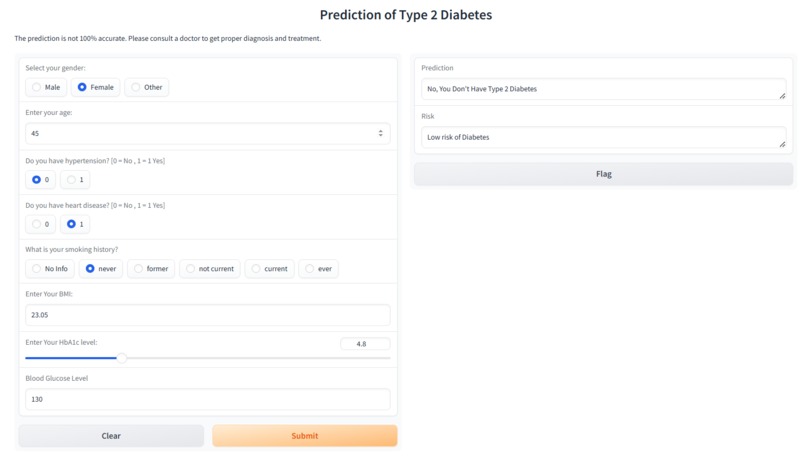
No Type 2 Diabetes GUI Output 2
-
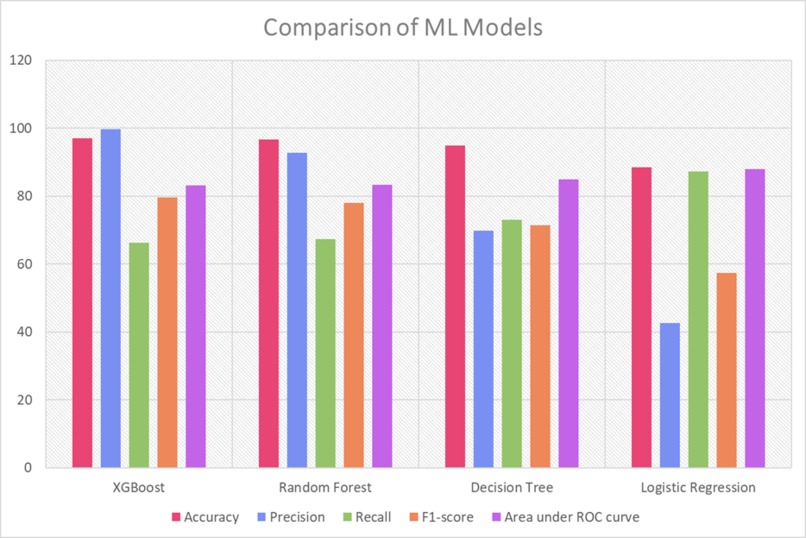
ML Models Comparison
-
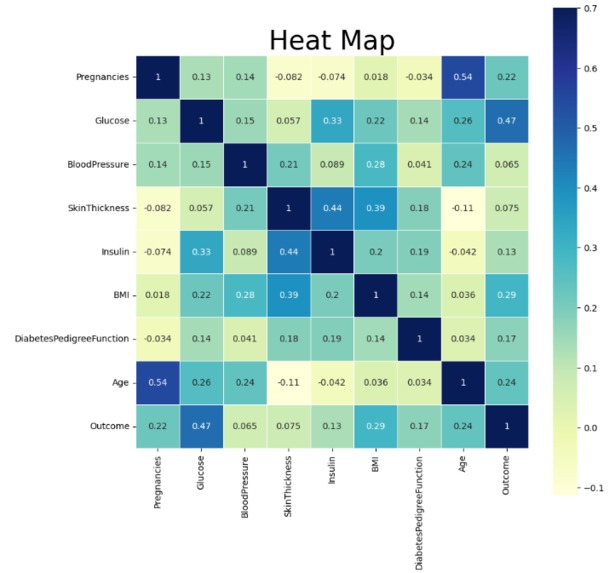
Correlation Matrix (Heatmap)
-
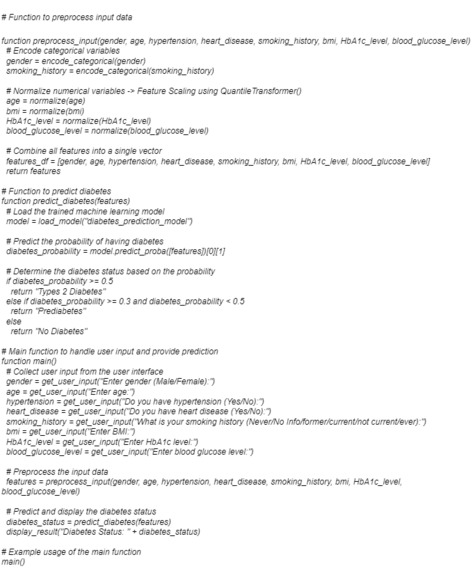
Pseudocode


Inspiration
Inspiration: Can you build a machine learning model to accurately predict whether or not the patients in the "Diabetes Prediction Dataset" have type 2 diabetes, prediabetes or not?
Context: The Diabetes prediction dataset is a collection of medical and demographic data from patients, along with their diabetes status (positive or negative). This dataset can be used to build machine learning models to predict diabetes in patients based on their medical history and demographic information. This can be useful for healthcare professionals in identifying patients who may be at risk of developing diabetes and in developing personalized treatment plans. Additionally, the dataset can be used by researchers to explore the relationships between various medical and demographic factors and the likelihood of developing diabetes.
Content: The diabetes_prediction_dataset.csv file contains medical and demographic data of patients along with their diabetes status, whether positive or negative. It consists of various features such as age, gender, body mass index (BMI), hypertension, heart disease, smoking history, HbA1c level, and blood glucose level. The Dataset can be utilized to construct machine learning models that can predict the likelihood of diabetes in patients based on their medical history and demographic details.
Dataset Description:
Gender - the biological sex of the individual, which can have an impact on their susceptibility to diabetes. There are three categories in it male, female and other.
Age - Age ranges from 0-80 in dataset. diabetes is more commonly diagnosed in older adults.
Hypertension - a medical condition in which the blood pressure in the arteries is persistently elevated. It has values 0 or 1 where 0 indicates they don't have hypertension and for 1 it means they have hypertension.
Heart disease - a medical condition that is associated with an increased risk of developing diabetes. It has values 0 or 1 where 0 indicates they don't have heart disease and for 1 it means they have heart disease.
Smoking history - It is a risk factor for diabetes and can exacerbate the complications associated with diabetes. There are 5 categories in the dataset i.e., not current, former, No Info, current, never and ever.
Body Mass Index (BMI) - measurement of body fat based on weight and height. Higher BMI values are linked to a higher risk of diabetes. The range of BMI in the dataset is from 10.16 to 71.55. BMI less than 18.5 is underweight, 18.5-24.9 is normal, 25-29.9 is overweight, and 30 or more is obese.
Hemoglobin A1c (HbA1c) level - measurement of a person's average blood sugar level over the past 2-3 months. Higher levels indicate a greater risk of developing diabetes. Mostly more than 6.5% of HbA1c Level indicates diabetes.
Blood glucose level - the amount of glucose in the bloodstream at a given time. High blood glucose levels are a key indicator of diabetes.
Diabetes - the target variable being predicted, with values of 1 indicating the presence of diabetes and 0 indicating the absence of diabetes.
What it does
“Prediction of Type 2 Diabetes” is a machine learning project in which a predictive model analyses user-entered input and compares it with data present in the dataset and predicts whether the person is diabetic or not by using an interactive GUI. A Kaggle dataset namely, Diabetes Prediction Dataset is used in this project. Data analysis and data visualization are performed, predictive models are built using ML algorithms such as Logistic Regression (LR), DT, RF, and XGB, and development are implemented using Google Colaboratory because it is a free online cloud based Jupyter Notebook service that requires no setup to use and provides free access to powerful computing resources, like CPU, GPU, TPU. It is efficient, ease of use, accessible in any IT device with an internet connection from anywhere worldwide.
How I built it
Data Analysis: Data Preprocessing, Exploratory data analysis (EDA), Data Cleaning, Feature selection is done. Necessary libraries such as Pandas and NumPy are imported to Google Colab. The dataset is loaded into a Pandas Data Frame. Exploratory data analysis (EDA) is performed to understand the structure, summary statistics, and distributions of the data. Missing values, null values, duplicate values in the dataset are checked and handled. Data preprocessing steps such as encoding categorical variables using LabelEncoder() are performed only for categorical data. Feature scaling was not performed because the dataset contains medical data. Outliers can be present in the data. It is not removed from the data because it is medically possible values and are not extreme or impossible values.
Data Visualization: Python libraries like Matplotlib and Seaborn were used for data visualization. Histogram, box plots, count plot, pie chart, donut chart and heatmap were plotted to visualize relationships between various features, display important insights or interesting findings and identify patterns. Outliers in dataset is identified by using boxplot to visualize the target feature of the datasets. Class imbalance is identified in target variable by using count plot.
Building Predictive Models: The dataset is divided into x and y and then split into 70% training and 30% testing set using Train Test Split. Python libraries such as Scikit-learn are imported for building machine learning models. These predictive models are then created and trained on the training data using ML algorithms like Linear Regression, Decision Trees, Random Forests, and XGBoost. Evaluation metrics like accuracy, precision, recall, f1-score, confusion matrix are used to evaluate the performance of the models. This is done because my project deals with a classification problem. The predictive models are compared with respect to the performance matrix. The model with the highest accuracy was XGBoost algorithm in both datasets. XGBoost algorithm achieved an accuracy rate of 97%.
GUI Development: XGBoost algorithm and the dataset is chosen for further development for creating a graphical user interface (GUI) using Gradio Interface in Google Colab for T2D prediction because XGBoost has highest accuracy, and the dataset has a special feature called ‘HbA1c level’. Actually, HbA1c test is a diagnostic test done to classify a person as healthy, prediabetic or diabetic by a medical professional.
Challenges I ran into
Even though, the implementation of the project has been successful, it faced many issues in the development. Sometimes, the model couldn’t make prediction if a user has no diabetes, prediabetes or type 2 diabetes, when the user entered HbA1c level value is 5.7 or 6.4. Gradio GUI would not appear sometimes because of Gradio library error issues. Handling medical data for machine learning purposes is challenging. Managing outliers and class imbalance was challenging for someone like me who has just set foot into the data science field. I gained more knowledge and understanding of data analysis and machine learning while working on my project.
Accomplishments that I am proud of
Diabetes Prediction Dataset contains medical data of men and women and the diagnostic test is HbA1c test . The most popular ML algorithms like Logistic Regression, Decision Tree, Random Forest, XGBoost have been used to build and train predictive models. The accuracy rate of ML models is : XGBoost – 96%, RF – 96%, DT – 94%, LR – 88%. So, XGB model has the highest accuracy rate and Gradio Interface is used for GUI development. Users can enter medical information to determine if they have type 2 diabetes or not, and the ML model almost accurately predicts and classifies if the users have type 2 diabetes or not. It also predicts if a user has a risk of having prediabetes. This whole project has been implemented using Google Colaboratory because of ease of use, simplicity, and efficiency.
What I learned
Type 2 diabetes is a chronic disorder that often develops gradually, with symptoms happening after the disease has advanced enough. Undiagnosed type 2 diabetes may cause nerve and kidney damage, heart and blood vessel disease, slow healing of wounds, hearing impairment and several skin diseases. Early detection of diabetes is essential to have a healthy life. Machine learning algorithms can detect individuals at risk of acquiring diabetes based on their health data, enabling prompt intervention and preventative measures to slow down the development of the disease. I became more interested in Type 2 Diabetes while working on my project.
What's next for T2DSure: Smart Prediction for Type 2 Diabetes
This machine learning project can be useful for T2D patients to do a health self-assessment and know when to consult a doctor if an issue arises. It can also be useful in clinical settings, to keep a check on patients' diabetes status in the patient database system. It can be an asset to the healthcare industry and help in the implementation of AI and Machine Learning in Healthcare settings. The future works are further development of this project into a software (most probably, a website or an app) where a user can do a self-assessment and know when to consult a doctor if the disease worsens, be aware of all of types of diabetes, get dietary guidelines, treatment, ways to prevent the complications from occurring, tools to manage diabetes like medicine, water, meal reminder features and keeping a record of the blood sugar levels and HbA1c levels. It can be integrated into IoT devices like smartwatches.
P.S.: It was my first time participating in a Devpost Hackathon. Hope you will like my project and find it informative and meaningful. Have a great day!
Built With
- googlecolab
- gradio
- matplotlib
- numpy
- pandas
- python
- seaborn
- sklearn
- windows-10
