-
-
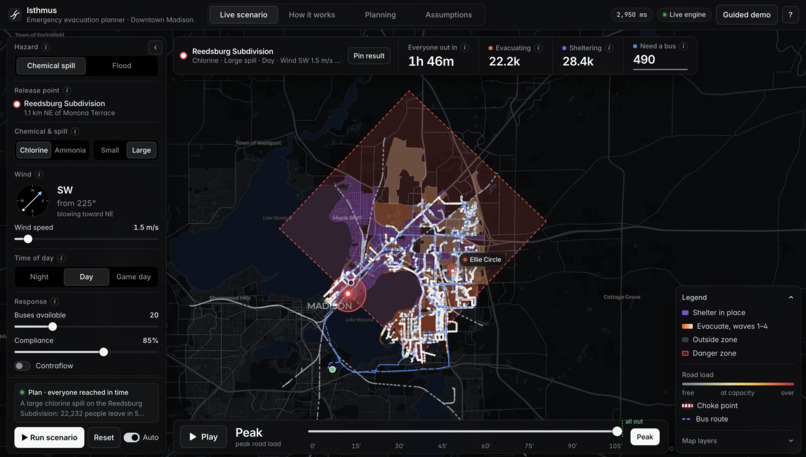
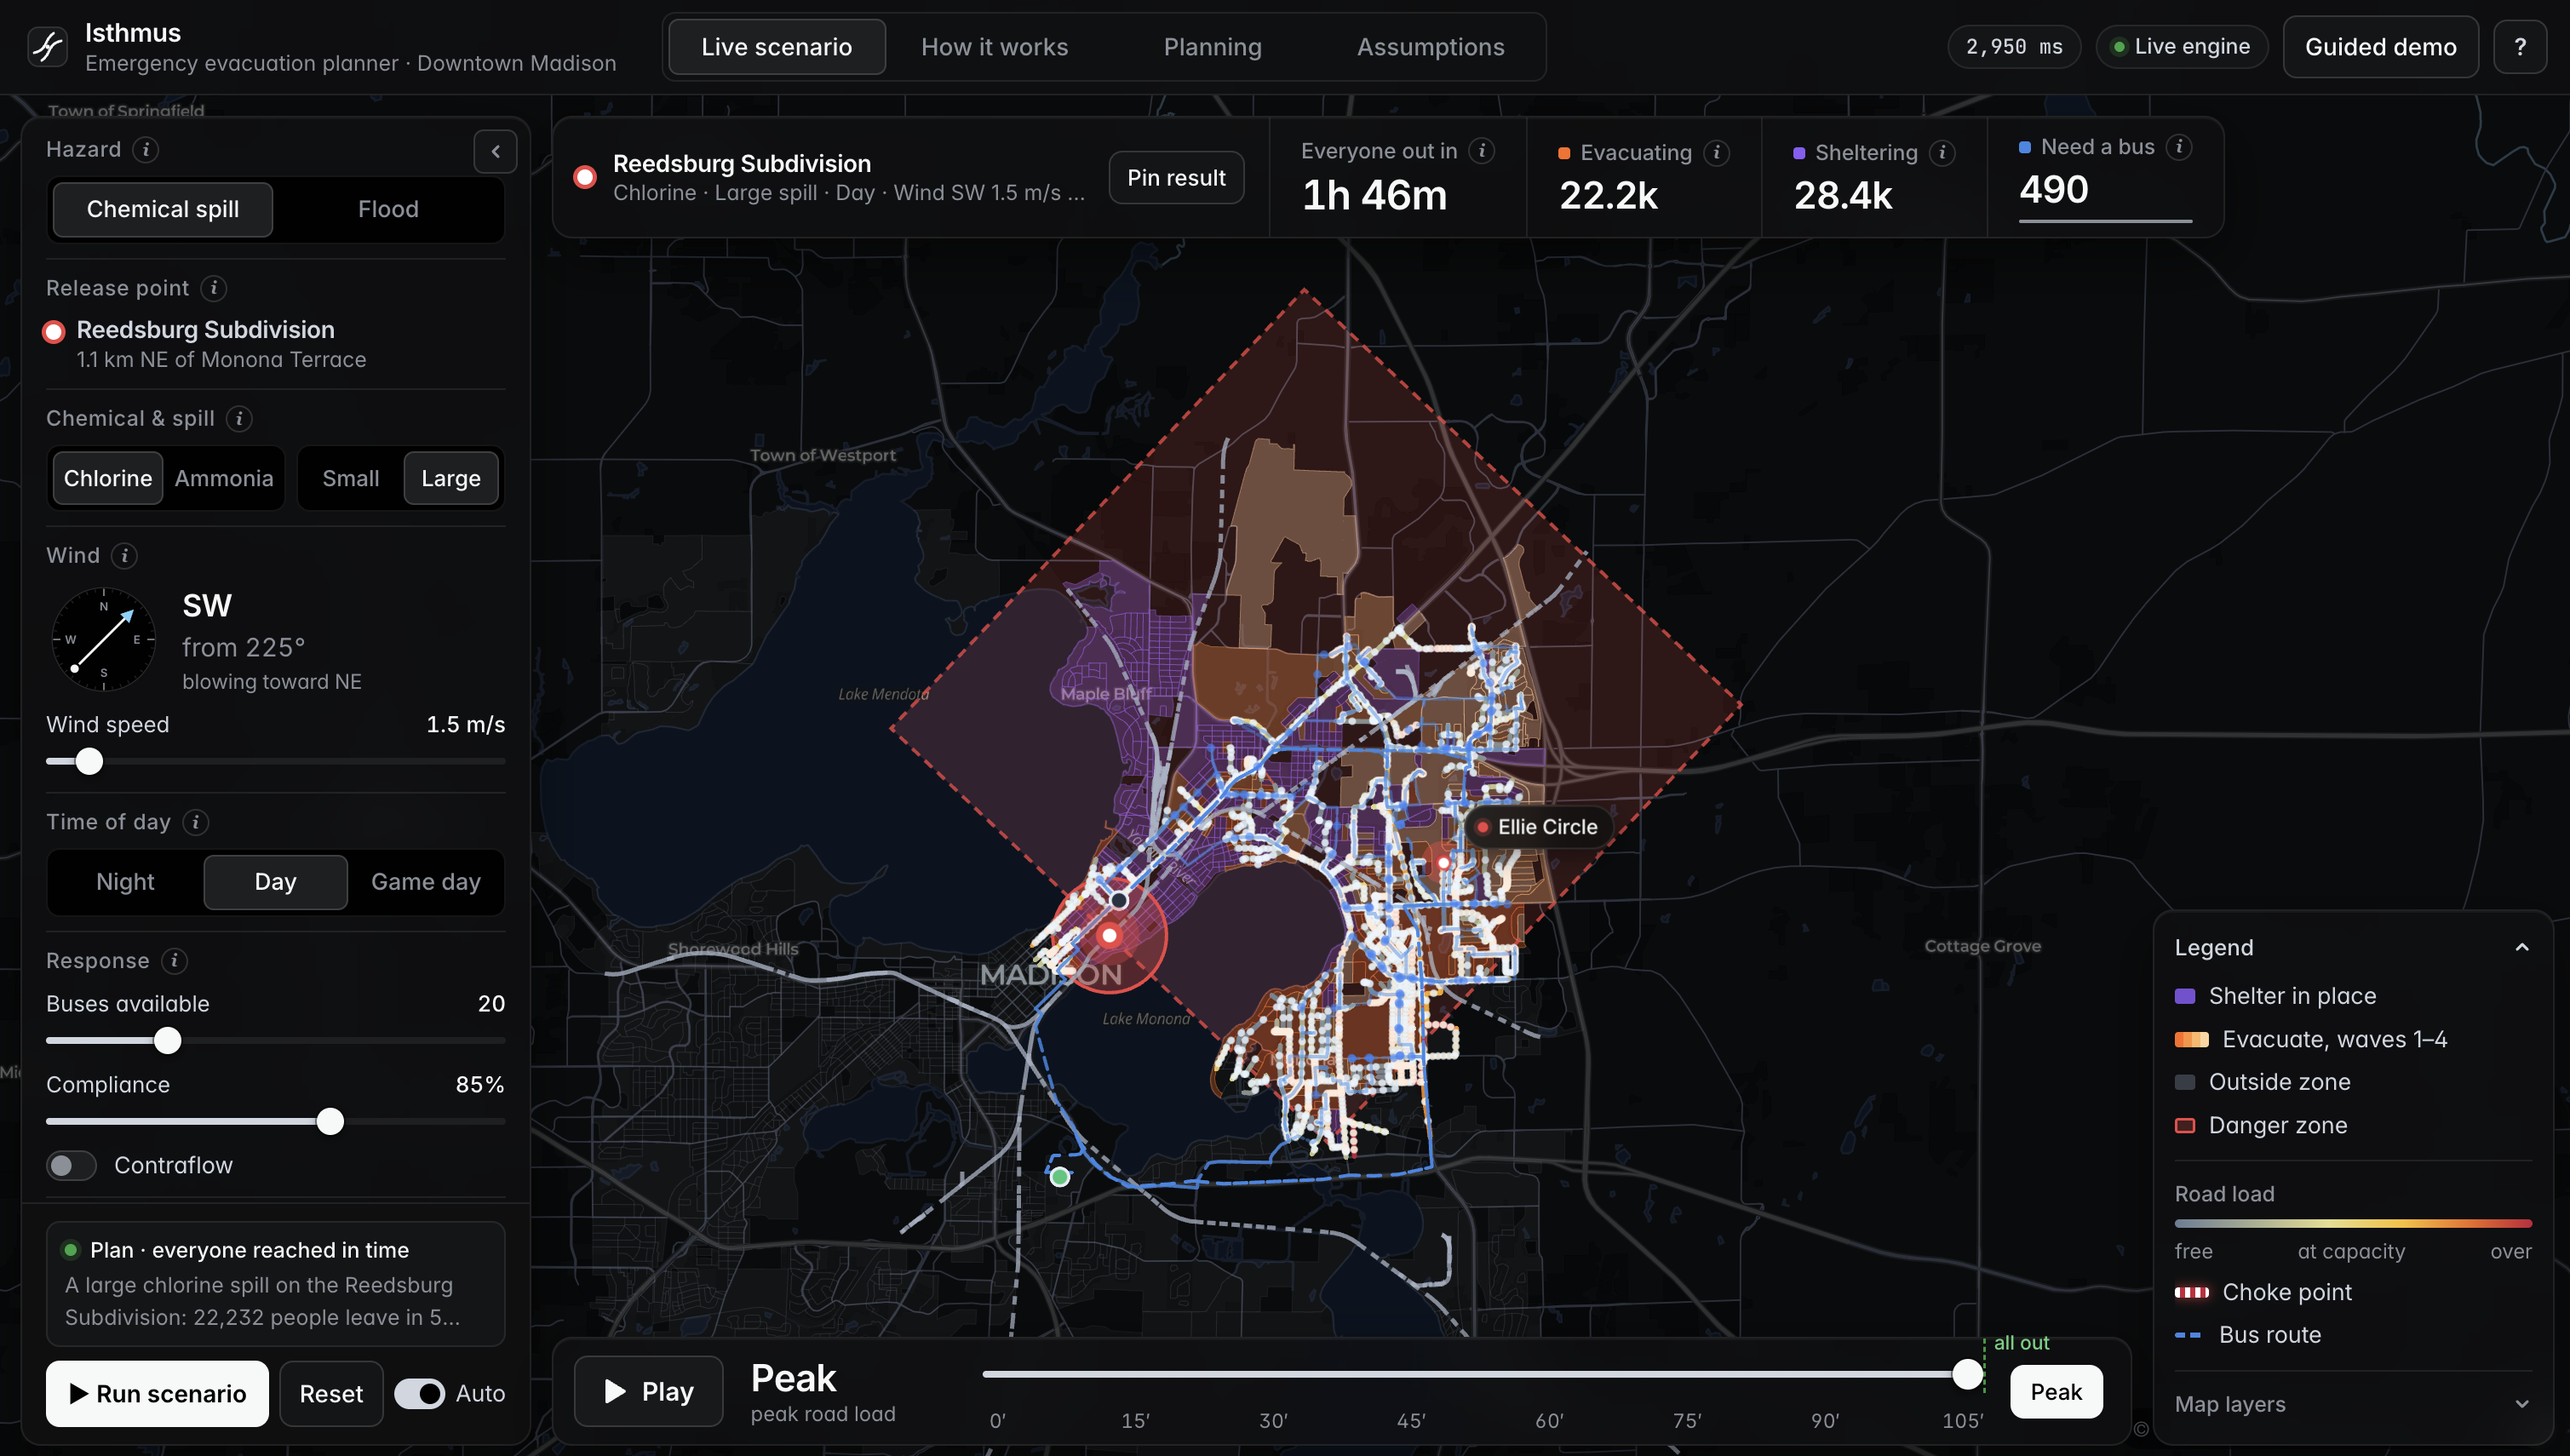
Chlorine derailment near the Capitol: the official ERG danger zone, with orange blocks evacuating in waves and purple sheltering in place.
-
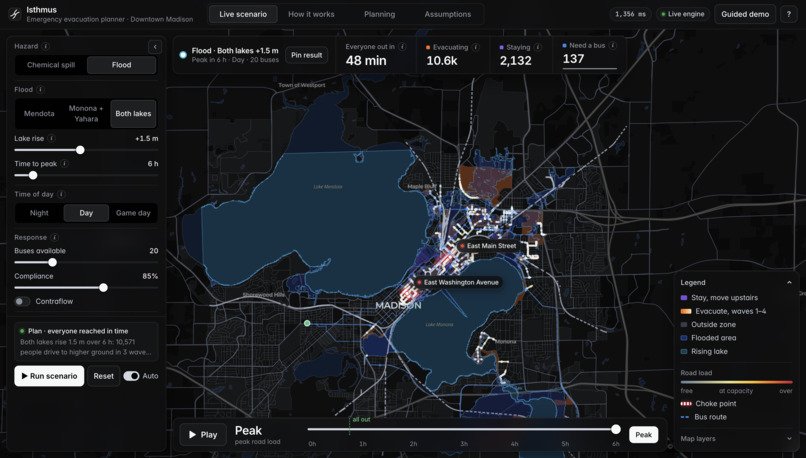
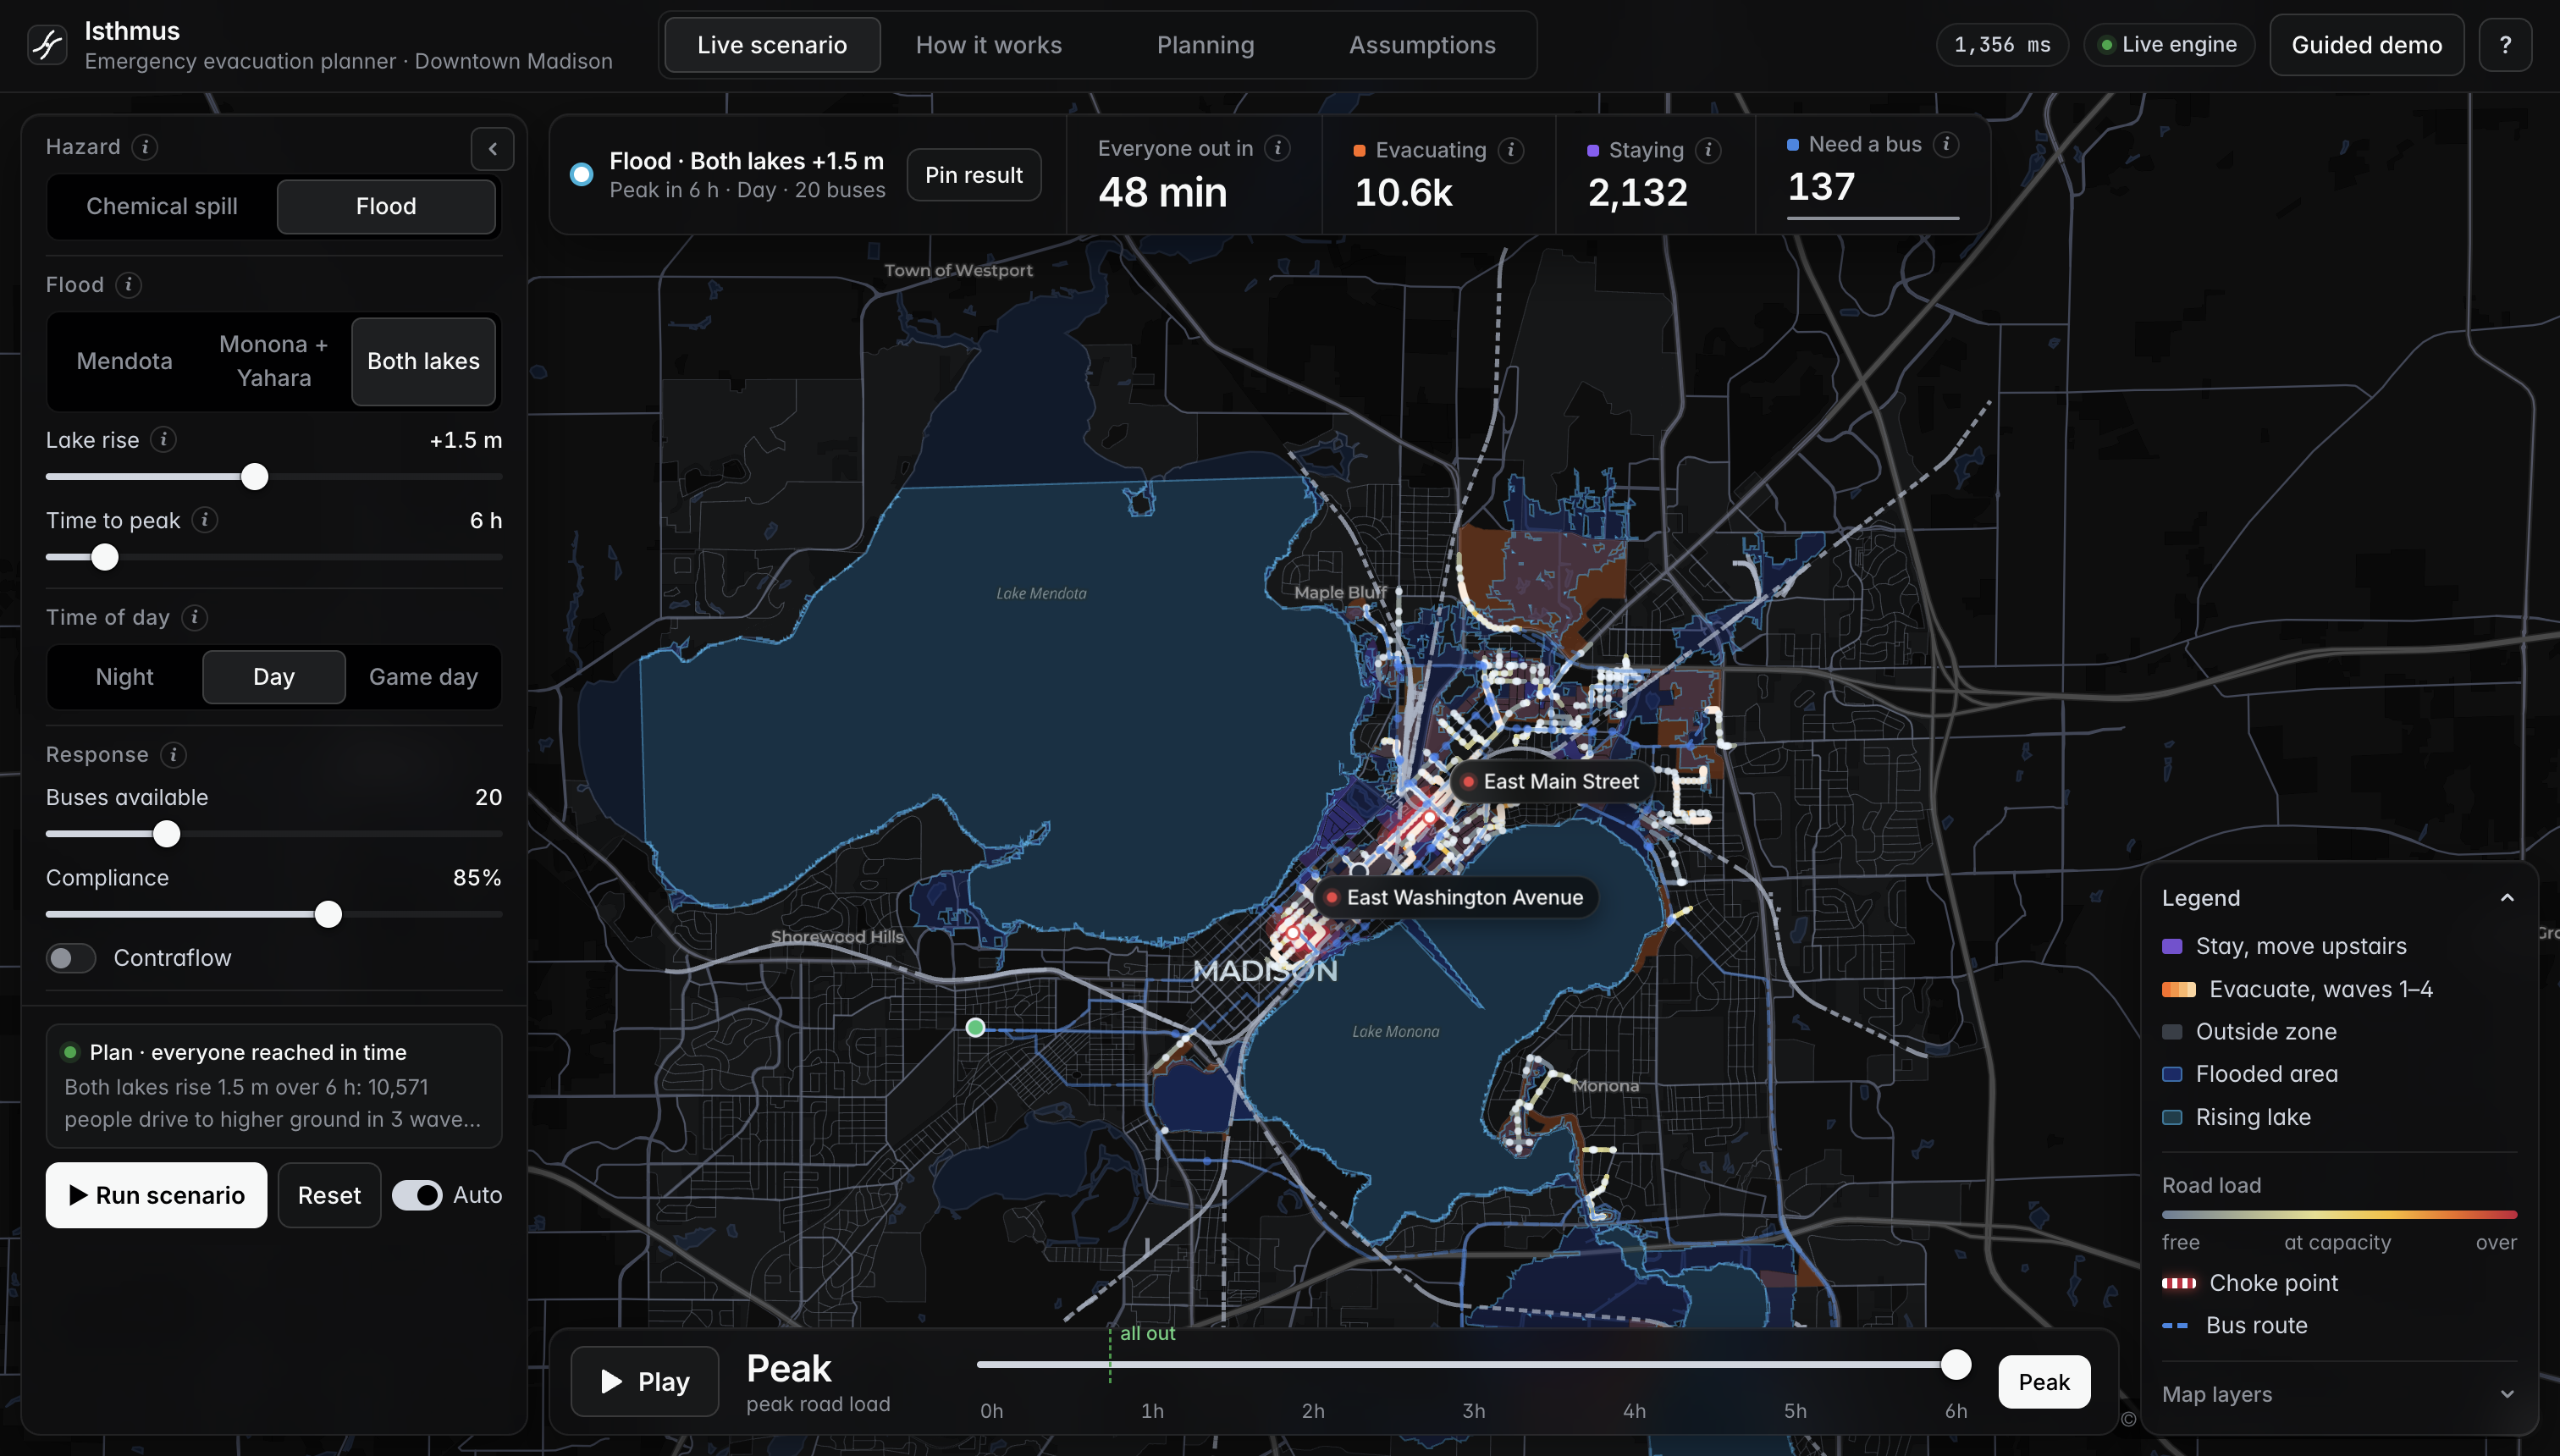
Both lakes rise 1.5 m: real elevation data shows water spreading up the Yahara River, and 10,600 people evacuate before it arrives.
-
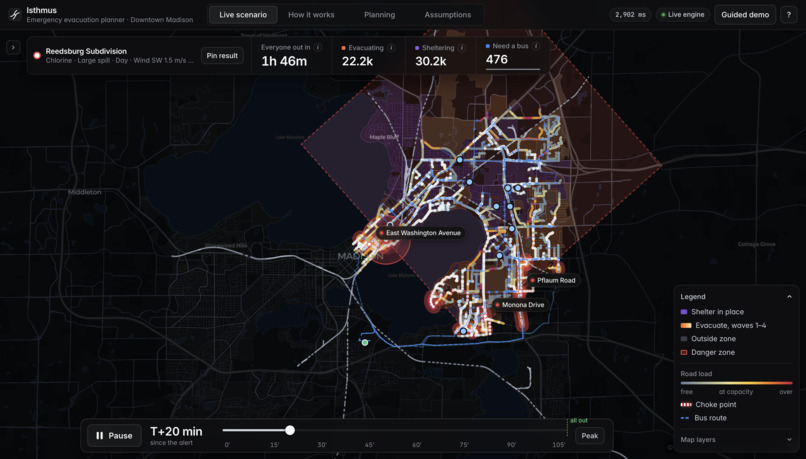
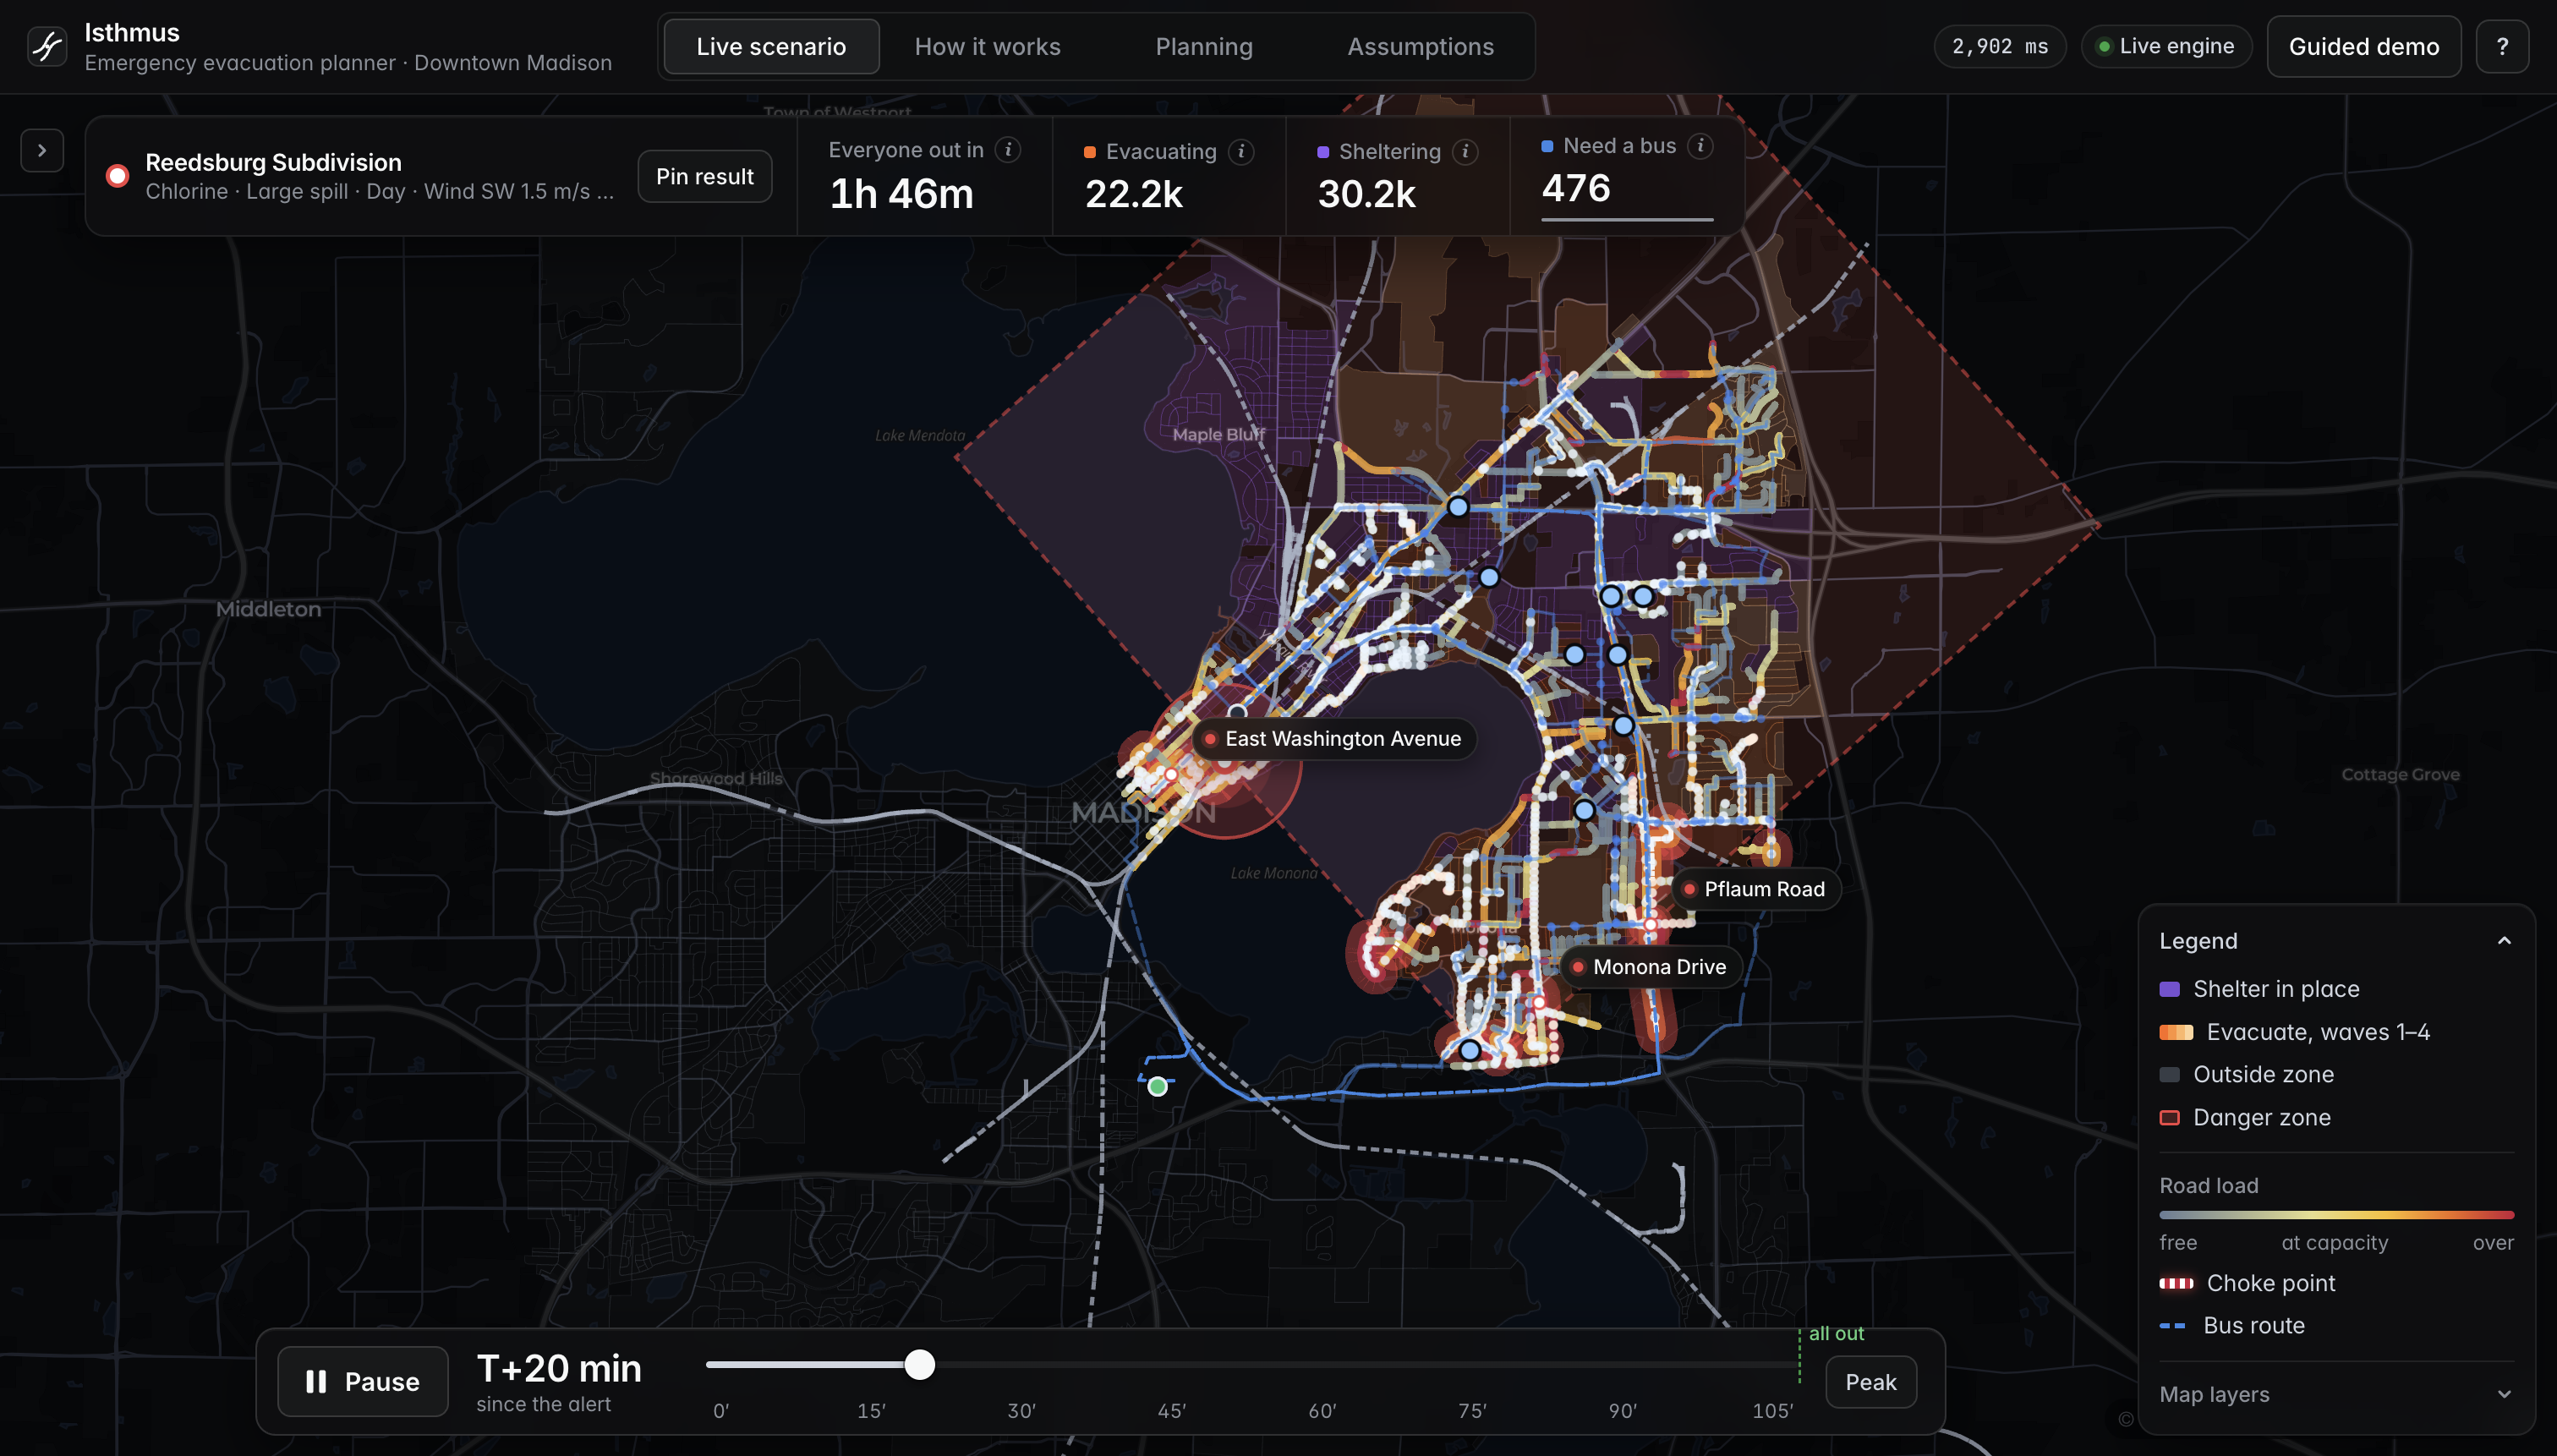
Live traffic simulation at T+20 min: departure waves stagger the evacuation and the map shows where the roads back up.
-
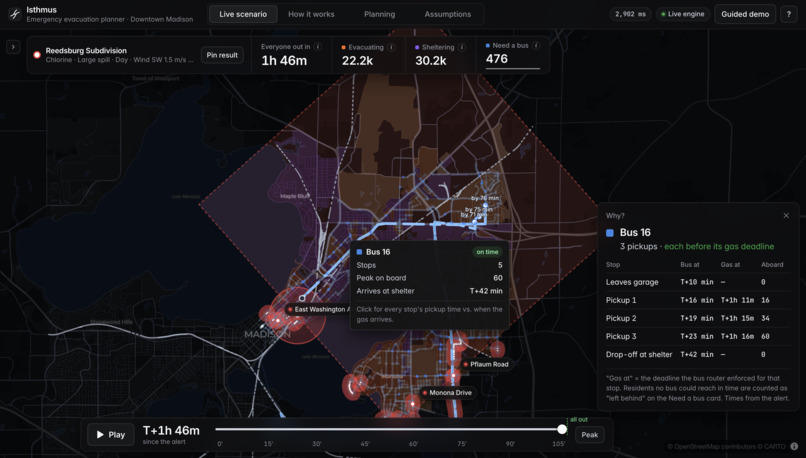
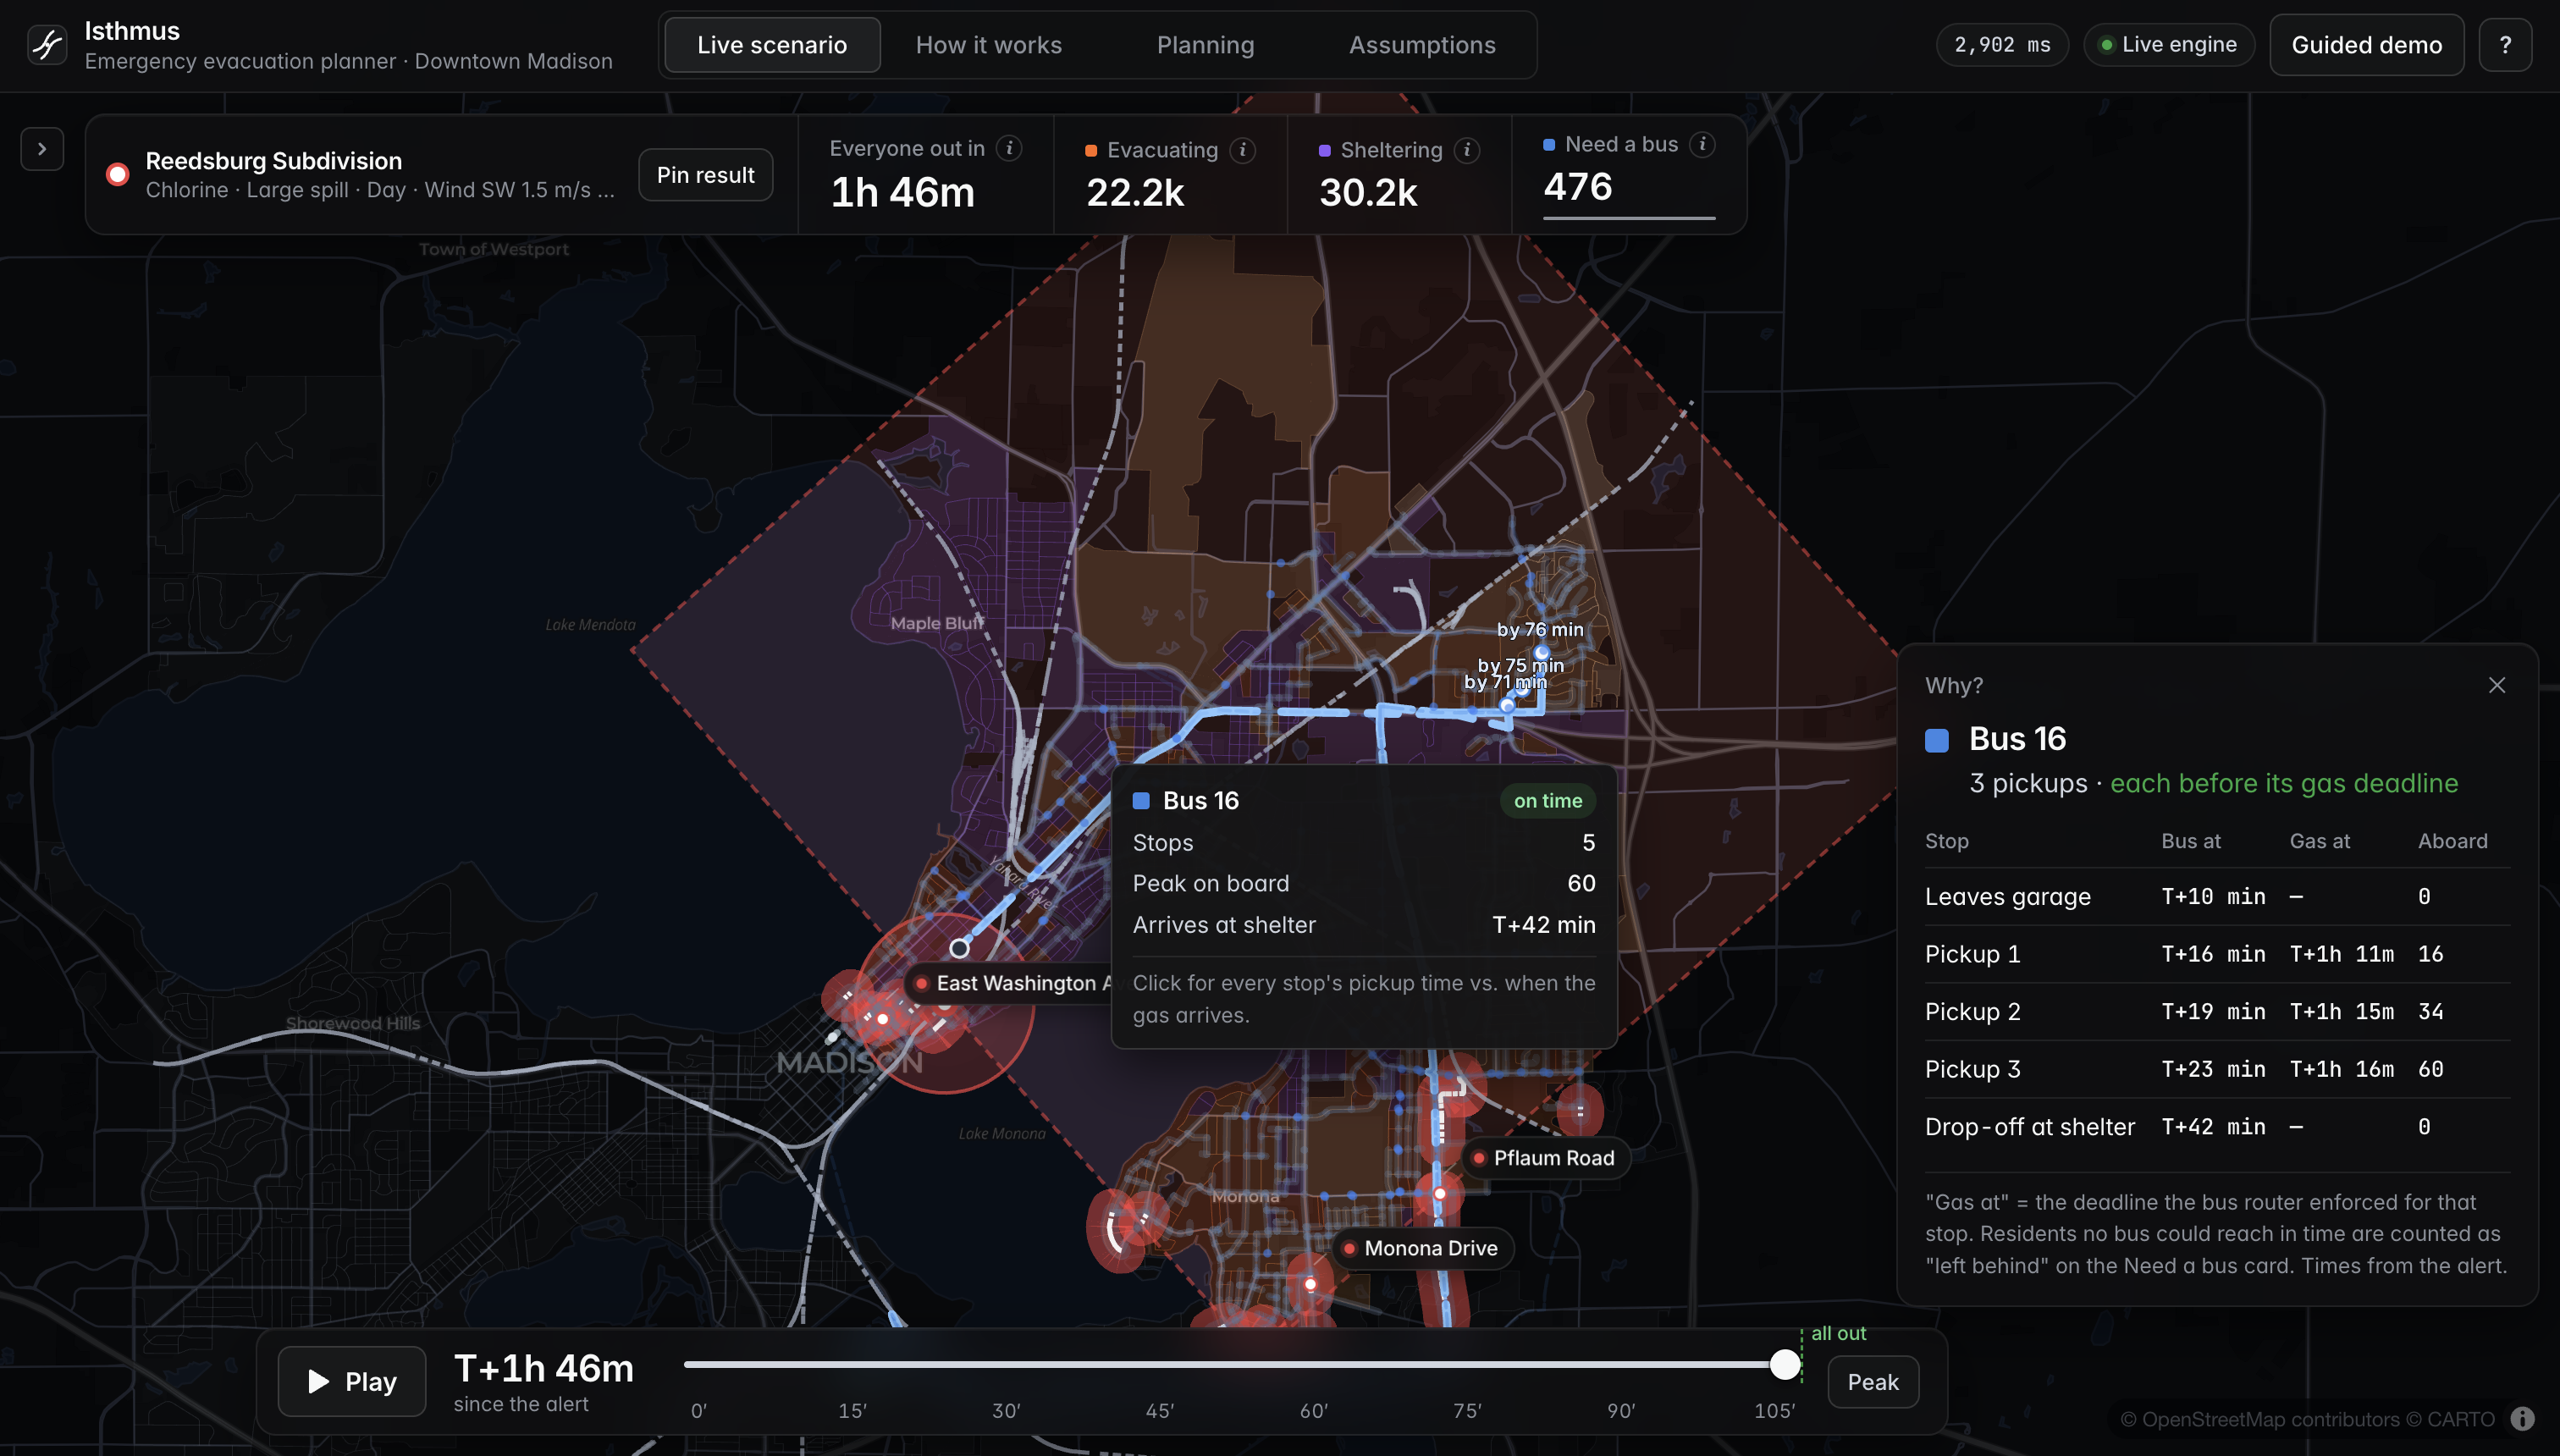
Every bus pickup is scheduled before the gas reaches that stop. Click any route to see its stops, timing and deadlines.
Isthmus
When a train derails in downtown Madison, who should run, and who should stay inside?
Isthmus is a hazmat and flood evacuation planner built on real Madison data. Drop a derailment on any rail line, and in about one second it draws the official danger zone, decides block by block who evacuates and who shelters, staggers departures so the few roads out don't gridlock, and routes buses to residents without a car, with every pickup scheduled before the hazard reaches them. Then it runs 666 scenarios on Databricks to find where plans break.
Inspiration
Downtown Madison sits on a strip of land about a kilometer wide between Lake Mendota and Lake Monona. Freight rail cuts straight through it, past the State Capitol, major hospitals and nursing homes, and only a handful of roads lead out.
Most evacuation plans quietly make two assumptions:
| The assumption | Why it fails |
|---|---|
| Everyone should evacuate | For a toxic gas, driving out can be deadlier than staying in. If the gas reaches your block before you clear the zone, you are safer indoors with the windows shut. |
| Everyone has a car | Car-free households, seniors, people with disabilities and nursing-home residents need a ride, and that ride has a hard deadline: the moment the hazard arrives. |
The theme was Let's Dig In, so we dug into Census tables, rail maps, elevation data and bus routing to find out where emergency plans hold, and where they break.
What it does
Chemical spill (chlorine or ammonia)
- Official hazard zone. The DOT Emergency Response Guidebook 2024 isolation circle plus the downwind protective-action zone, using real rail tank car distances that shrink as the wind picks up. Gas arrival at every block:
$$t_{\text{arrival}} = \frac{d}{v_{\text{wind}}}$$
- Evacuate or shelter, block by block. A block evacuates only if its residents can beat the gas:
$$t_{\text{warning}} + 1.5 \times t_{\text{drive to exit}} < t_{\text{arrival}}$$
Otherwise, residents shelter in place.
Capacity-aware departure waves. The highest-risk neighborhoods leave first, in 10-minute waves that each fit through every exit and bottleneck.
Live traffic simulation. A 30-second link-queue model shows where and when roads back up, animated on the map.
Deadline-constrained bus routing. OR-Tools vehicle routing sends Madison Metro buses to the people who need them, and every pickup window closes when the gas arrives. Cut the fleet, and Isthmus tells you exactly how many people are left behind.
Flood (Lake Mendota and/or Lake Monona rising)
Flip one switch and the same engine plans for a flood. Using USGS 3DEP elevation, a priority-flood algorithm works out how far each lake must rise before water can actually flow to every 20 m patch of the city, since water can't jump over high ground. Flooded roads close, "away from the hazard" becomes "toward higher ground," and "shelter" becomes move to an upper floor.
Built to be trusted
- "Why?" on everything. Click any block or bus for a plain-English reason, such as "Gas arrives in 9 min, getting out would take 14 min."
- Pin and compare. Lock in one scenario, change anything, and see the difference.
- Five-step guided demo. Who leaves, faster wind, game day, too few buses, rising lakes.
- Every assumption on screen. Every tunable number lives in one file and is shown in the app.
How we built it
 OpenStreetMap · Census 2020 · ACS 2022 · LEHD LODES · CMS · ERG 2024 · USGS 3DEP
                                    |
                                    v
          GeoParquet "silver" tables: 5,441 intersections, 13,909 roads,
                      2,113 Census blocks, 200,853 residents
                                    |
                                    v
     Engine: hazard zone -> evacuate/shelter -> max-flow clearance -> min-cost routes
             -> departure waves -> queue simulation -> OR-Tools bus routing   (~1 s)
                    |                                          |
                    v                                          v
         FastAPI -> React + deck.gl map          Databricks -> Delta -> AI/BI + Genie
| Layer | Stack | What it does |
|---|---|---|
| Data | OSMnx, GeoPandas, pyproj |
A 15 x 12 km network out to the Beltline, so evacuees have real exits. Night population (2020 Census), daytime workers (LODES), car-free, 65+ and disability shares (ACS), nursing homes (CMS), elevation (USGS). |
| Engine | Python 3.12, OR-Tools, SciPy, Shapely |
SimpleMaxFlow with binary search for clearance time, SimpleMinCostFlow for routes, vectorized link queues, capacitated VRP with time windows, heap-based priority-flood. |
| Batch | Databricks Serverless, Delta Lake, AI/BI, Genie |
Every scenario on Serverless compute, written to Delta tables that feed a dashboard and a Genie agent you can ask "which wind direction is worst?" |
| App | FastAPI, React 19, TypeScript, deck.gl, MapLibre, Recharts |
Full-bleed map, timeline playback, guided demo, and a Planning tab with the batch findings. |
What we found
576 chemical scenarios, 0 failures
8 derailment points x 8 wind directions x 3 wind speeds x 3 times of day (night, day, UW game day)
| Finding | Result |
|---|---|
| Capitol Lakes nursing home inside the danger zone | 75% of scenarios |
| Meriter Hospital inside the danger zone | 62% |
| Metro's bus garage, where every evacuation bus starts, inside the danger zone | 52% |
| Time to get every car out: light, moderate, strong wind | 105, 59, 40 min |
| Worst wind direction (from the south, up the isthmus) | 78 min vs. 56 min best |
| People told to shelter: game day vs. normal day | ~94,000 vs. ~56,000 |
| Most frequent choke point (Latitude 43 St) | only 16% of scenarios |
| Night derailment near the Capitol, 5 buses instead of 20 | 191 of 491 people left behind |
The counterintuitive one: stronger wind makes the danger zone smaller, yet evacuations drop from 27,374 to 7,773. The gas moves faster, so fewer people can outrun it and far more have to shelter.
No single road is the choke point more than 16% of the time. A fixed evacuation map isn't enough. The plan has to adapt to where the train derails and which way the wind blows.
90 flood scenarios, 0 failures
| How far the lakes rise before it floods | Rise |
|---|---|
| Madison Metro bus garage, E Washington Ave, E Johnson St, Packers Ave | +0.53 m |
| John Nolen Drive, S Blair Street | +0.96 m |
| Madison College Truax (candidate shelter) | +1.59 m |
At just half a meter, Lake Mendota spills across the east isthmus. The Yahara River corridor fills all at once, taking the main east-side roads and the bus garage with it. Same garage, two hazards.
With both lakes up 1.5 m: 16 km² flooded, about 10,300 people evacuate, and about 2,200 move to upper floors.
The findings hold up
We re-ran everything under 7 variants of our biggest assumptions: compliance at 60% and 100%, road capacity up and down 25%, a 15-minute warning, and buses leaving 10 minutes later. The wind-speed pattern and the choke-point cluster survived every one.
Why Isthmus fits the Databricks track
One evacuation plan is a guess; hundreds of them are evidence. Isthmus uses Databricks for exactly that step. The repo is connected as a Databricks Git folder, so the notebook runs the same engine code as the app, with no rewrite and no drift between what the demo shows and what the batch measures. On Serverless compute it ran 576 chemical-spill scenarios with 0 failures (every derailment point, wind direction, wind speed and time of day) and wrote the results to Delta tables. Those tables feed an AI/BI dashboard and a Genie agent, so an emergency manager who will never open a notebook can ask "Which wind direction gives the longest clearance time?" and get the answer (wind from the south, 78 minutes) in plain English. The same gold tables flow back into the app's Planning tab, closing the loop from raw public data to Delta to a decision on a map. Databricks is how we turned a one-second simulation into the findings that matter: a nursing home in the danger zone 75% of the time, a bus garage in it 52% of the time, and no single road that is the choke point more than 16% of the time.
Challenges we ran into
1. Rates vs. counts
Road capacity is a rate (cars per hour), but evacuees are a count (cars). You can't push a count through a rate. So for each candidate duration $T$, every road gets
$$C_e(T) = \frac{\text{capacity}_e \times T}{3600}$$
and a binary search over max-flow finds the smallest $T^*$ where every car reaches an exit. The min cut names the roads that limit it.
2. 22,000 jobs on one city block
LEHD LODES put about 22,000 UW-Madison jobs on a single campus block, which meant a stadium's worth of cars on one street. We capped daytime density at 100,000 people/km² (above Madison's 99th percentile). We also filled in missing OSM lane counts (72% of roads) and speed limits (67%) by road class.
3. The map edge invented a choke point
Our first study area made a tiny street near Olin Park the #1 choke point, only because it touched the edge of the map. We expanded the network out to the Beltline.
4. One lake, two heights
The elevation data showed Lake Mendota at two different water levels, a seam between two lidar surveys flown at different times. We identify each lake by its shape and give it one official normal level instead. We also treat highways as raised, because bare-earth elevation strips out bridges (the Beltline "flooded" at 5 cm until we did).
5. Speed
Night scenarios first took 5 to 11 seconds. SciPy sparse Dijkstra, pointer-jumping travel times and lazy path building brought the median down to 1.0 second.
Accomplishments we're proud of
- 666 scenarios, 0 failures (576 chemical and 90 flood)
- 98 automated tests: units (rate x time vs. count), road rules, waves never exceeding capacity, bus deadlines never violated, and flood connectivity over a ridge
- Every decision explains itself, with no black boxes
- Two hazards, one engine. Flooding plugged in without touching the flow, wave, simulation or bus code.
- A real finding a city could act on: Madison's evacuation buses all start from a garage that is inside the chemical danger zone half the time and underwater at +0.53 m
What we learned
Warning speed decides who gets to leave. A 15-minute alert instead of 5 doesn't just delay the evacuation. It turns 35% of evacuations into shelter-in-place orders.
Gas and water break plans differently. Gas moves in minutes, so time runs out. Water moves in hours, so infrastructure runs out first: the roads and the garage go under before the people do.
What's next
- Rainfall and storm-sewer flooding on top of lake levels
- Real dispersion plume modeling and live National Weather Service wind
- The city's official shelter list and assisted-living facilities
- Buses making multiple trips, and a spillback-aware traffic model
Built With
- databricks
- deck.gl
- fastapi
- geopandas
- maplibre
- or-tools
- python
- react
- recharts
- scipy
- typescript

