-
-
Overview 1
-

Overview 2
-

Analog
-
-
-
-
-
-


Inspiration
We wanted to help T-Mobile understand and predict how network outages impact customer happiness across different regions. Network disruptions can severely affect customer satisfaction, and we saw an opportunity to create a tool that could simulate, monitor, and alert teams about these impacts in real-time.
What it does
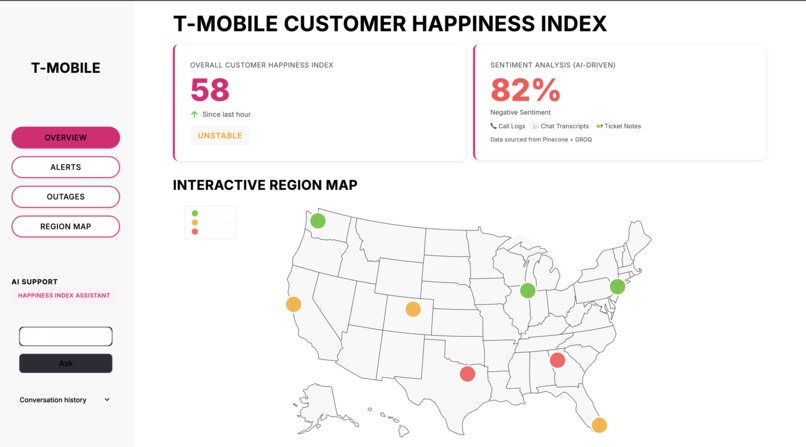
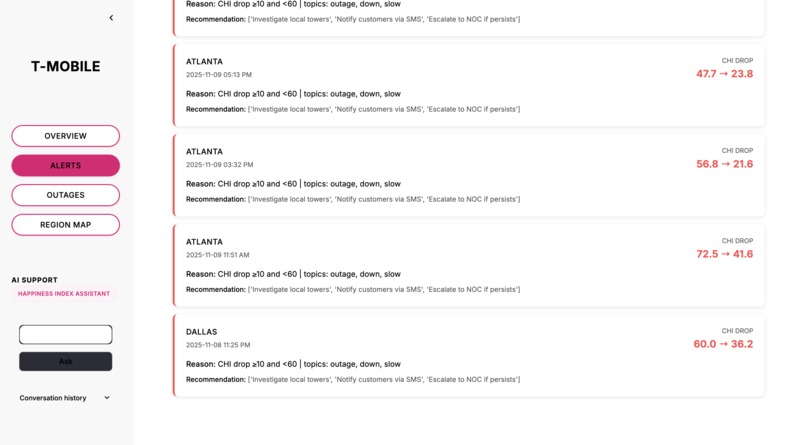
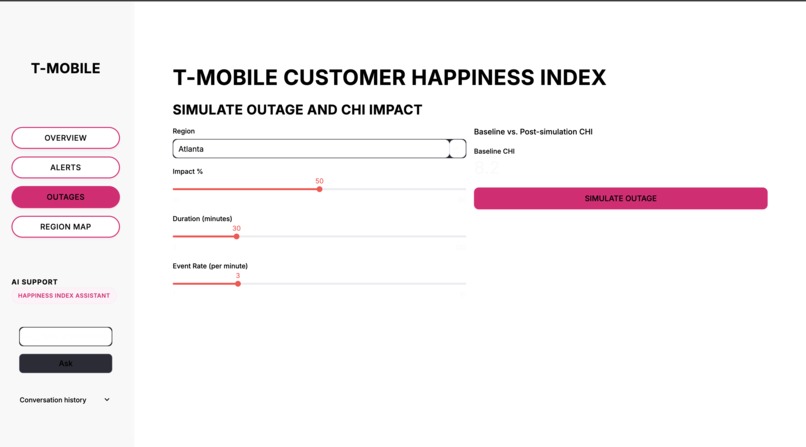
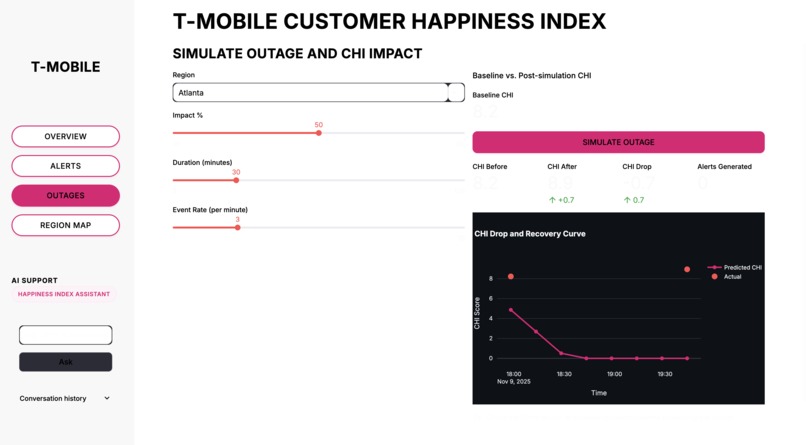
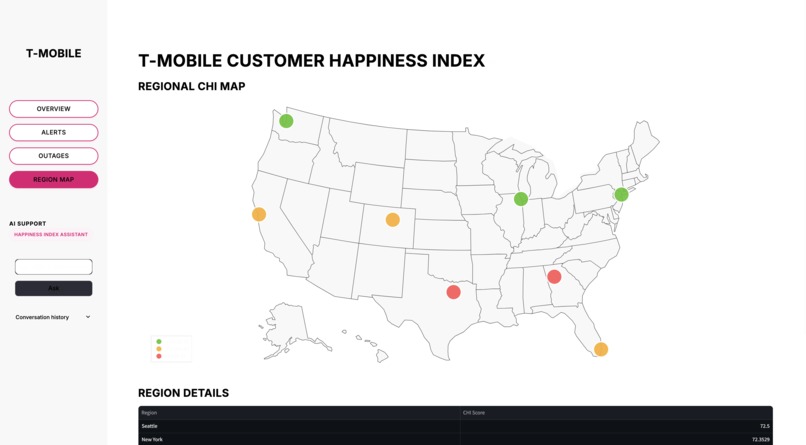
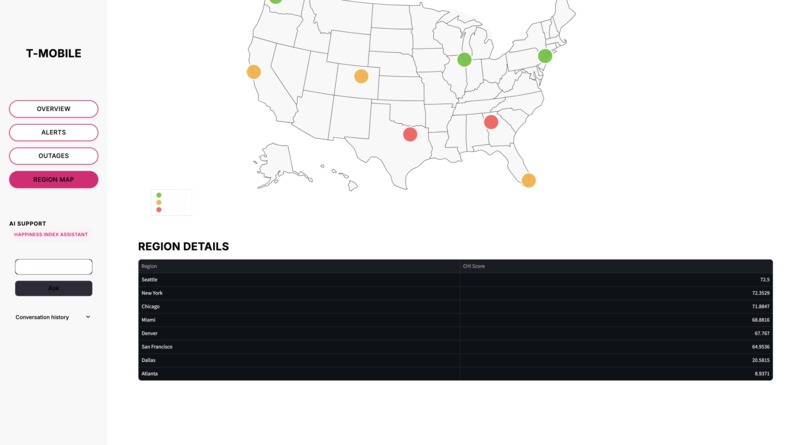
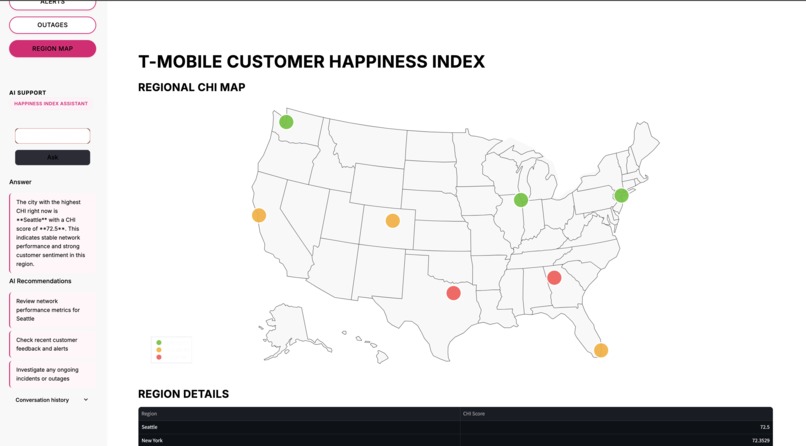
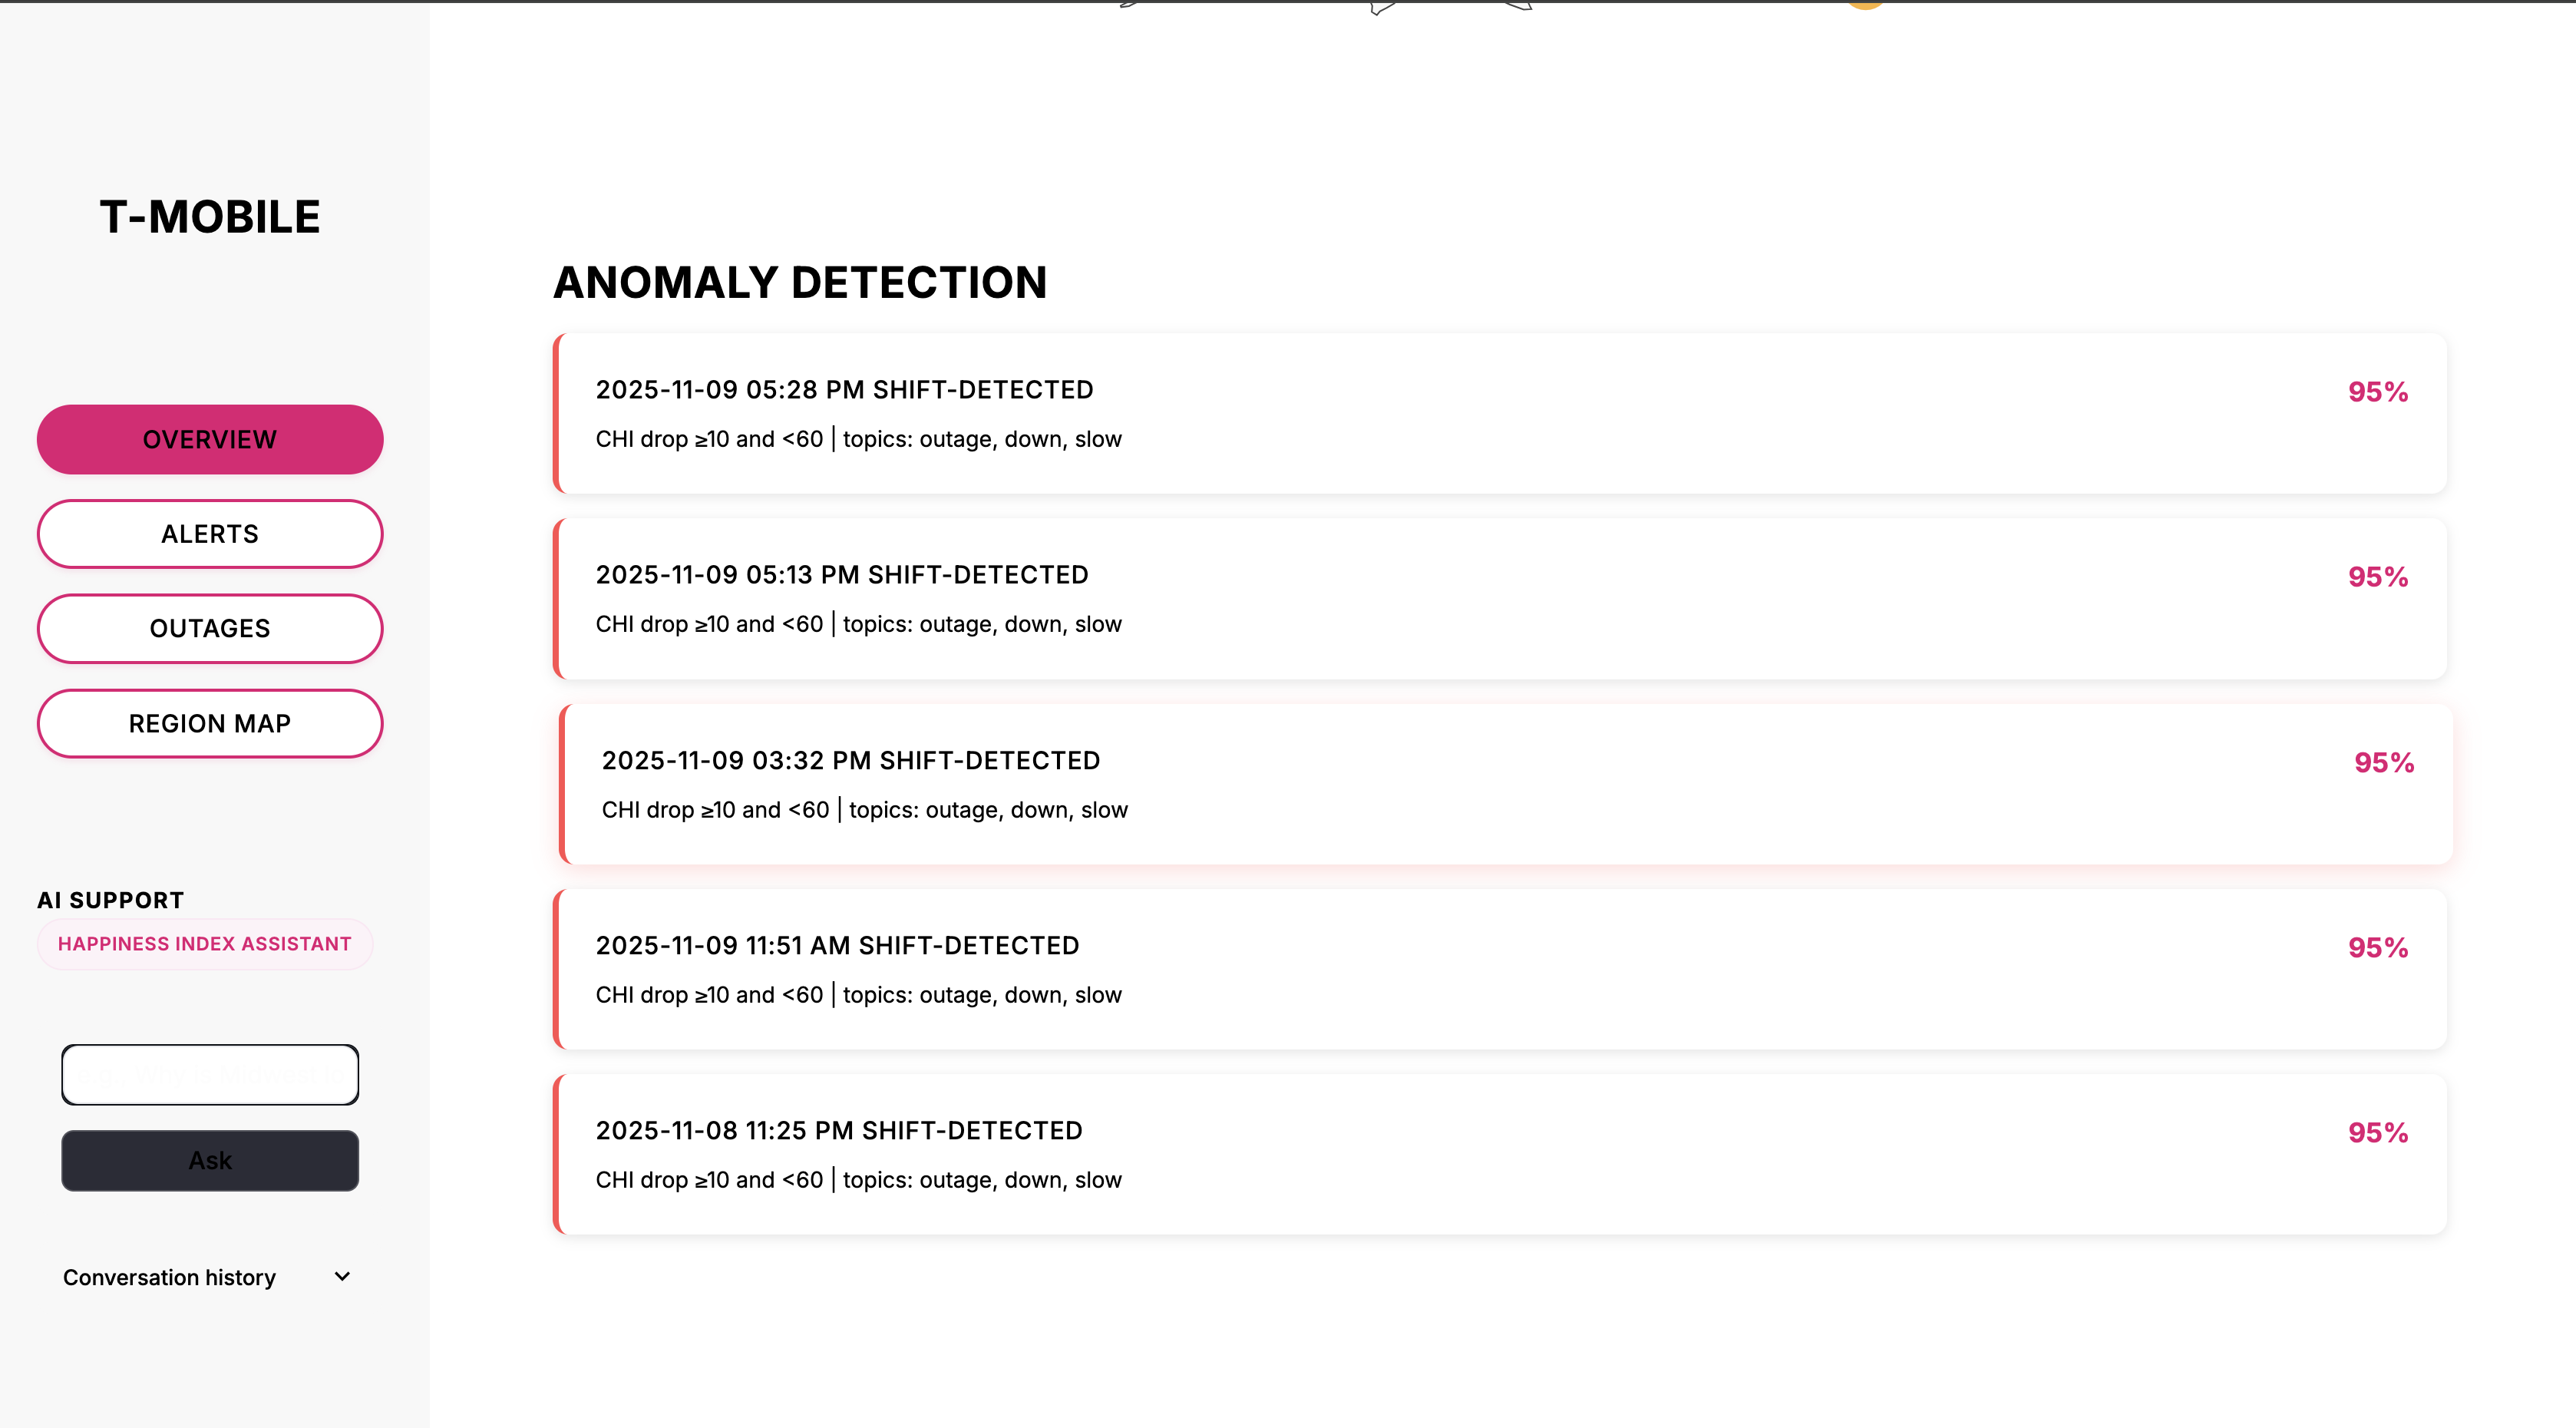
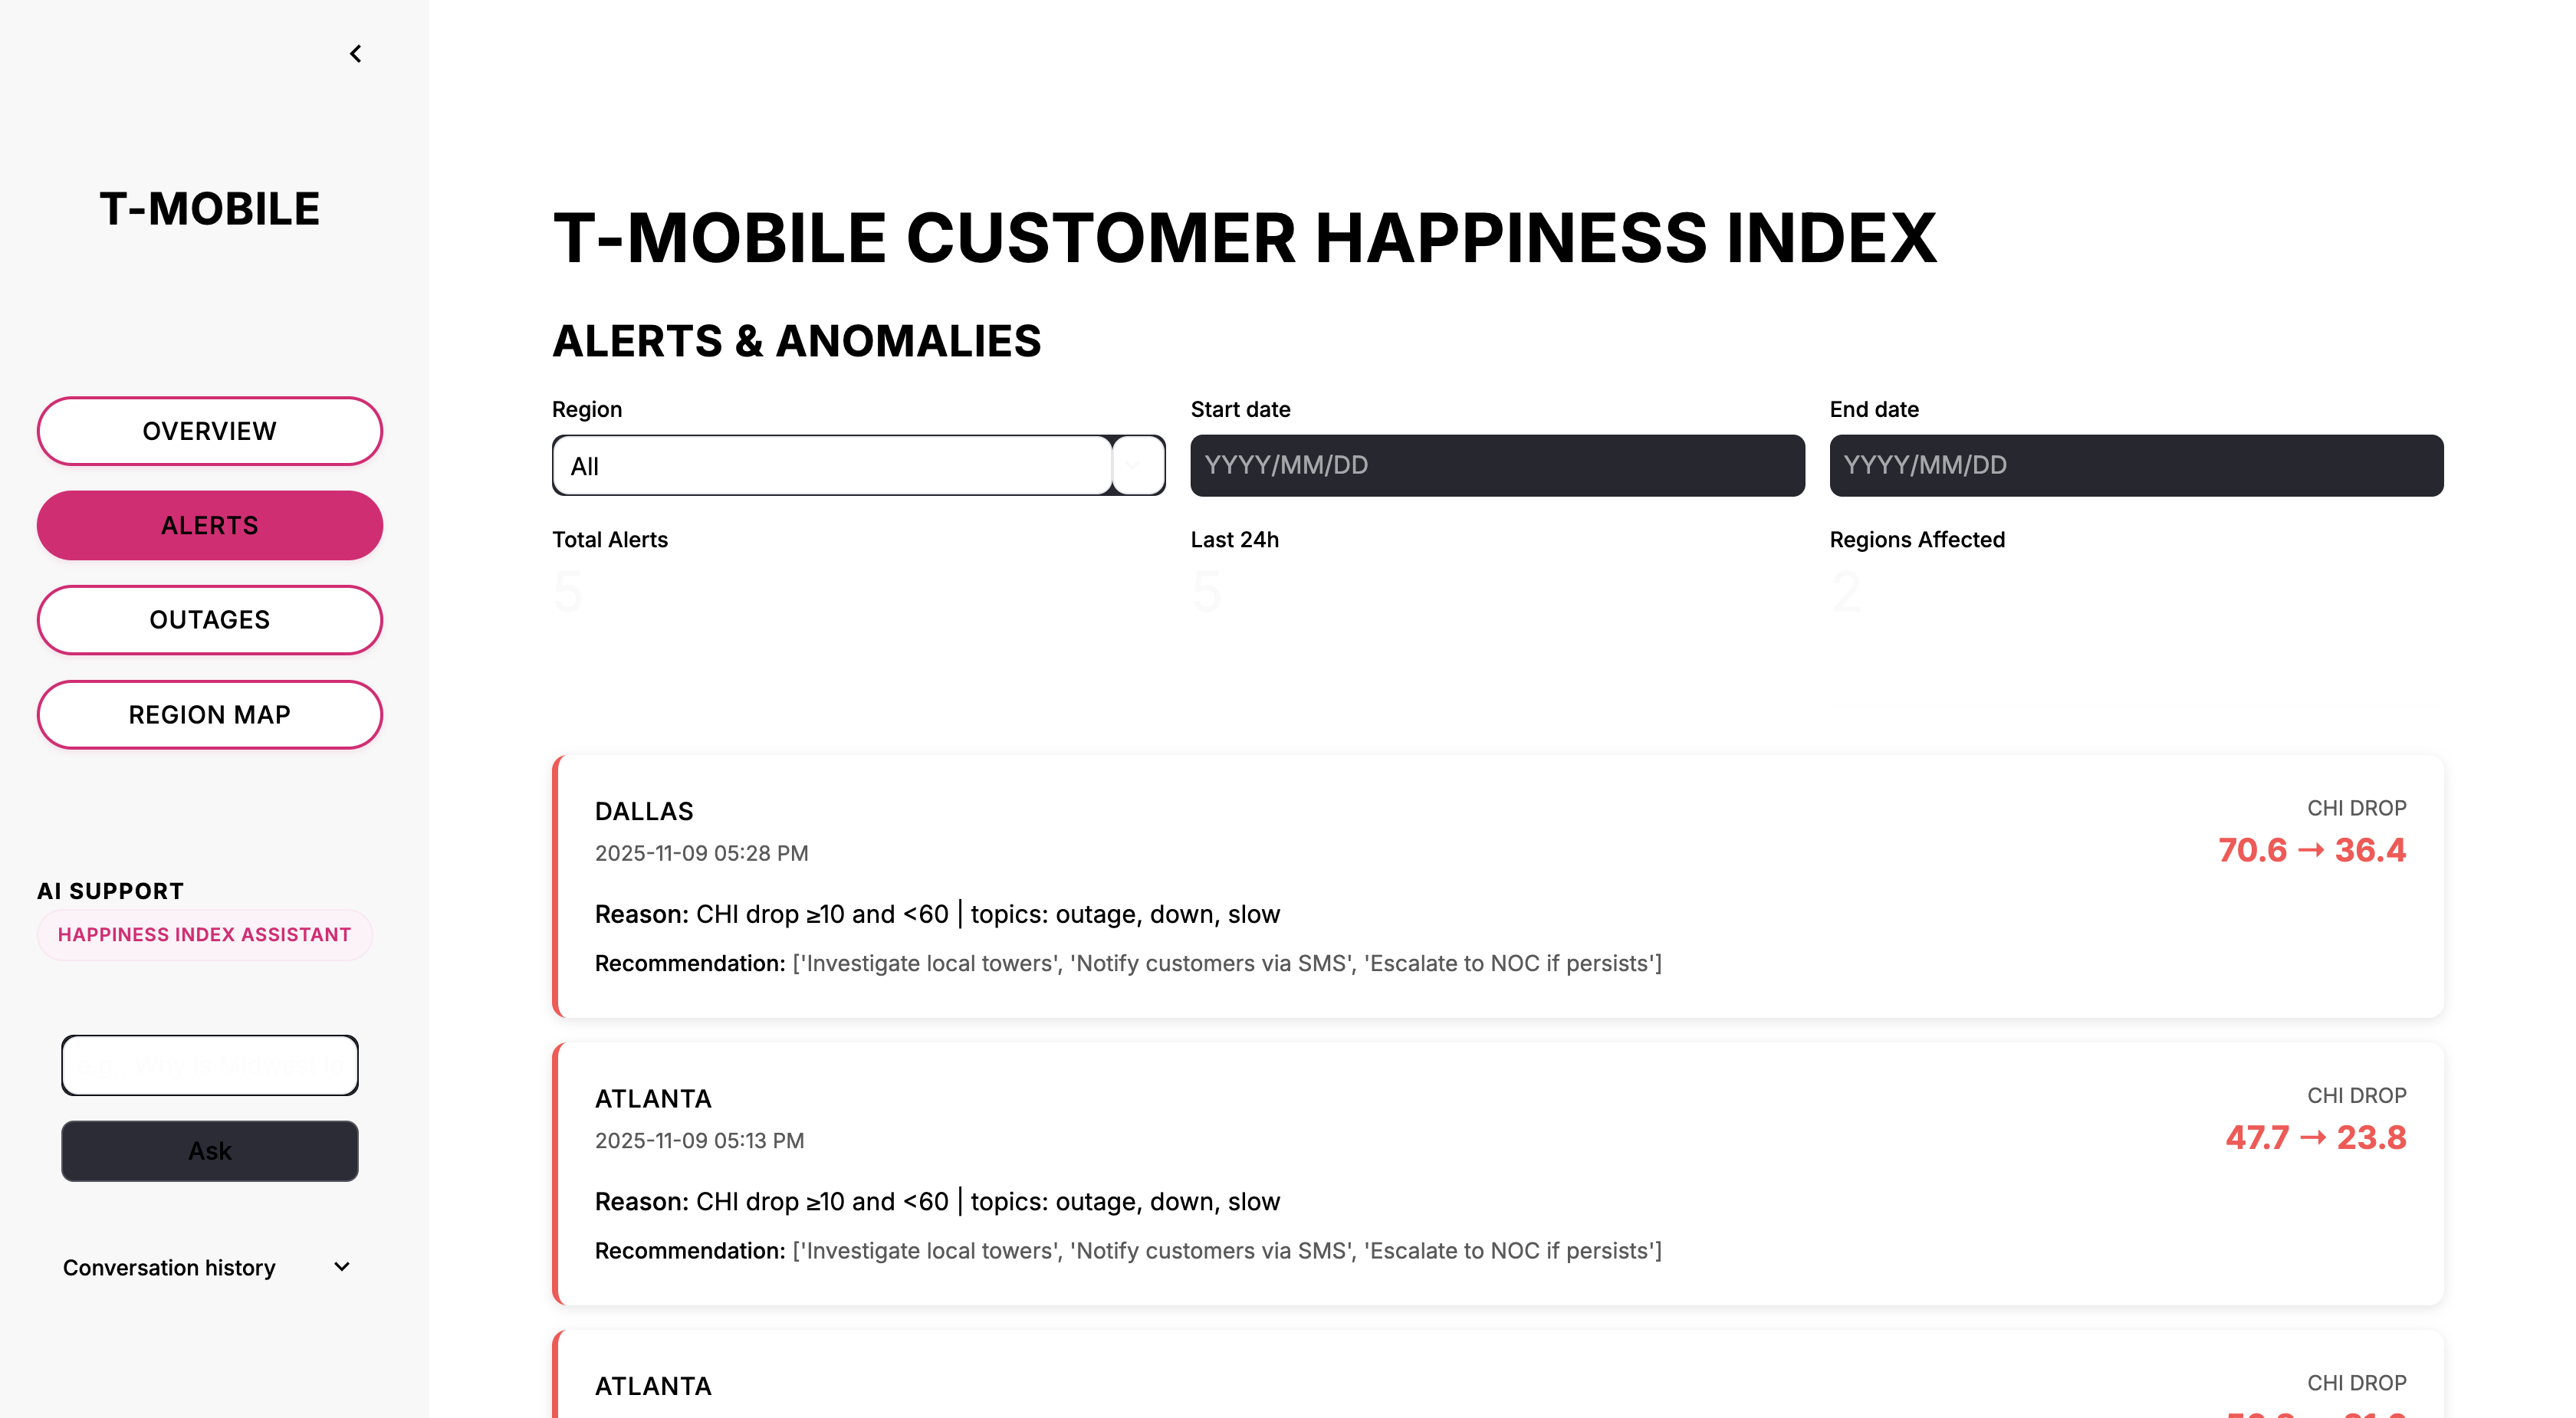
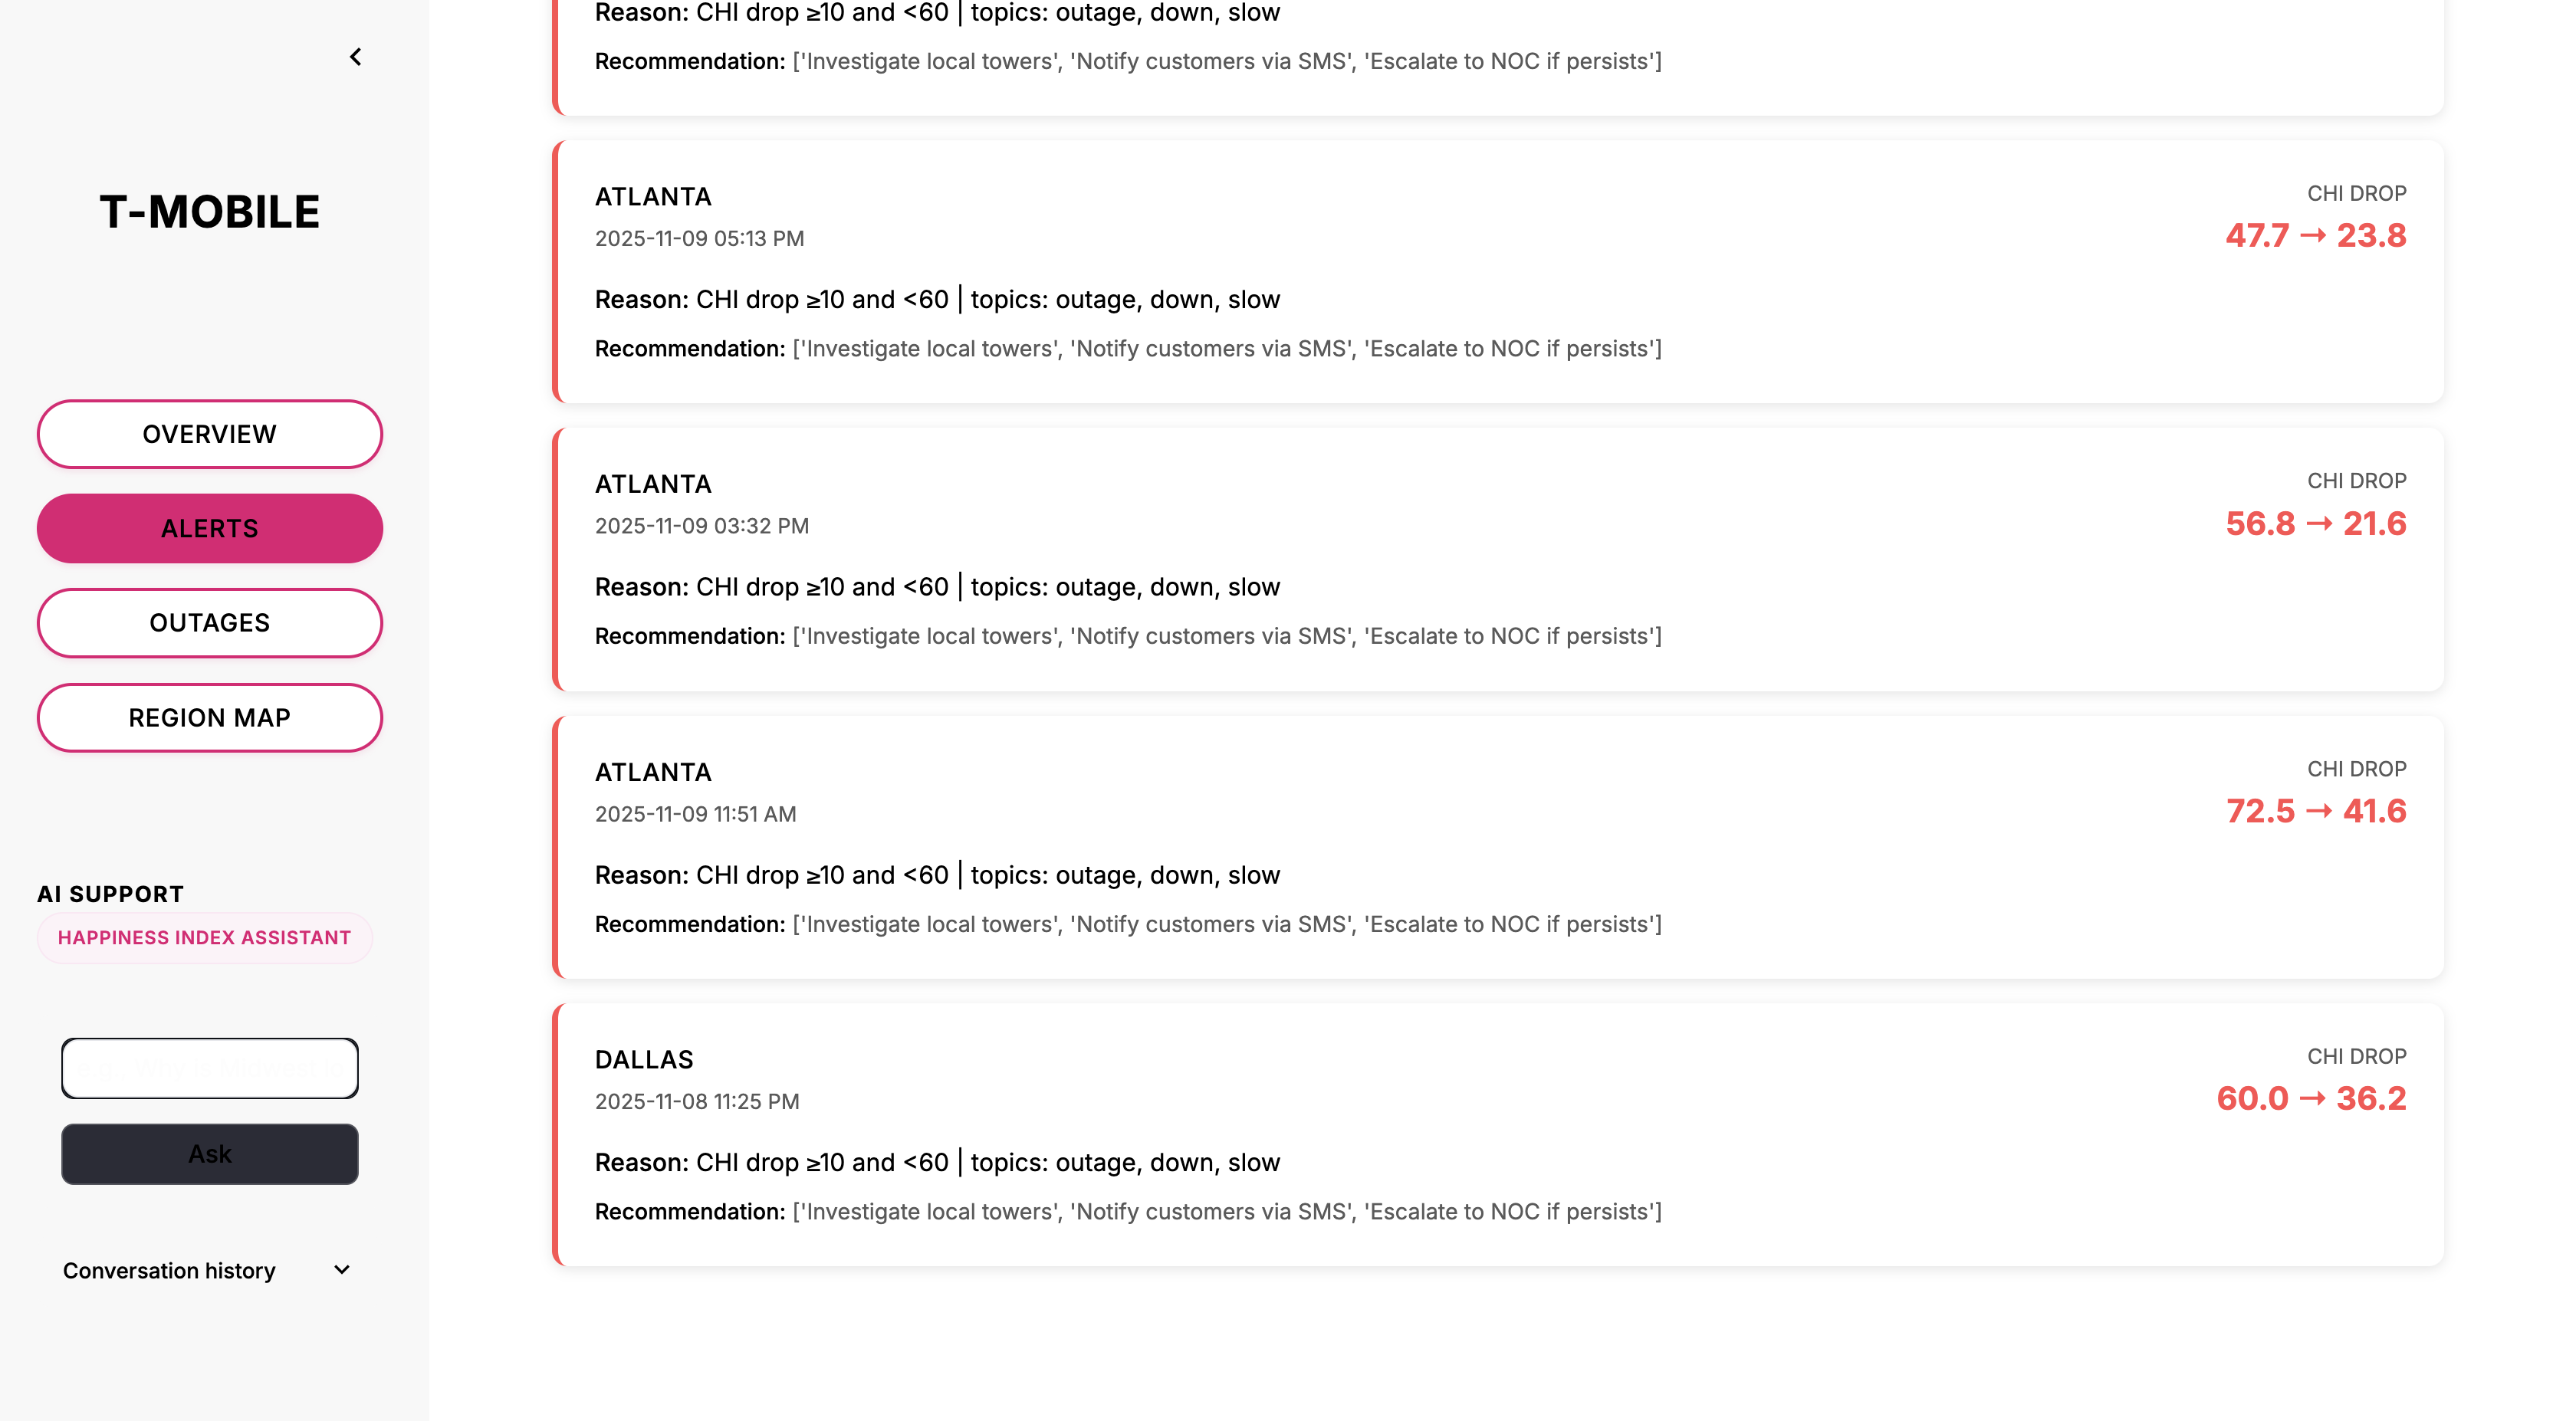
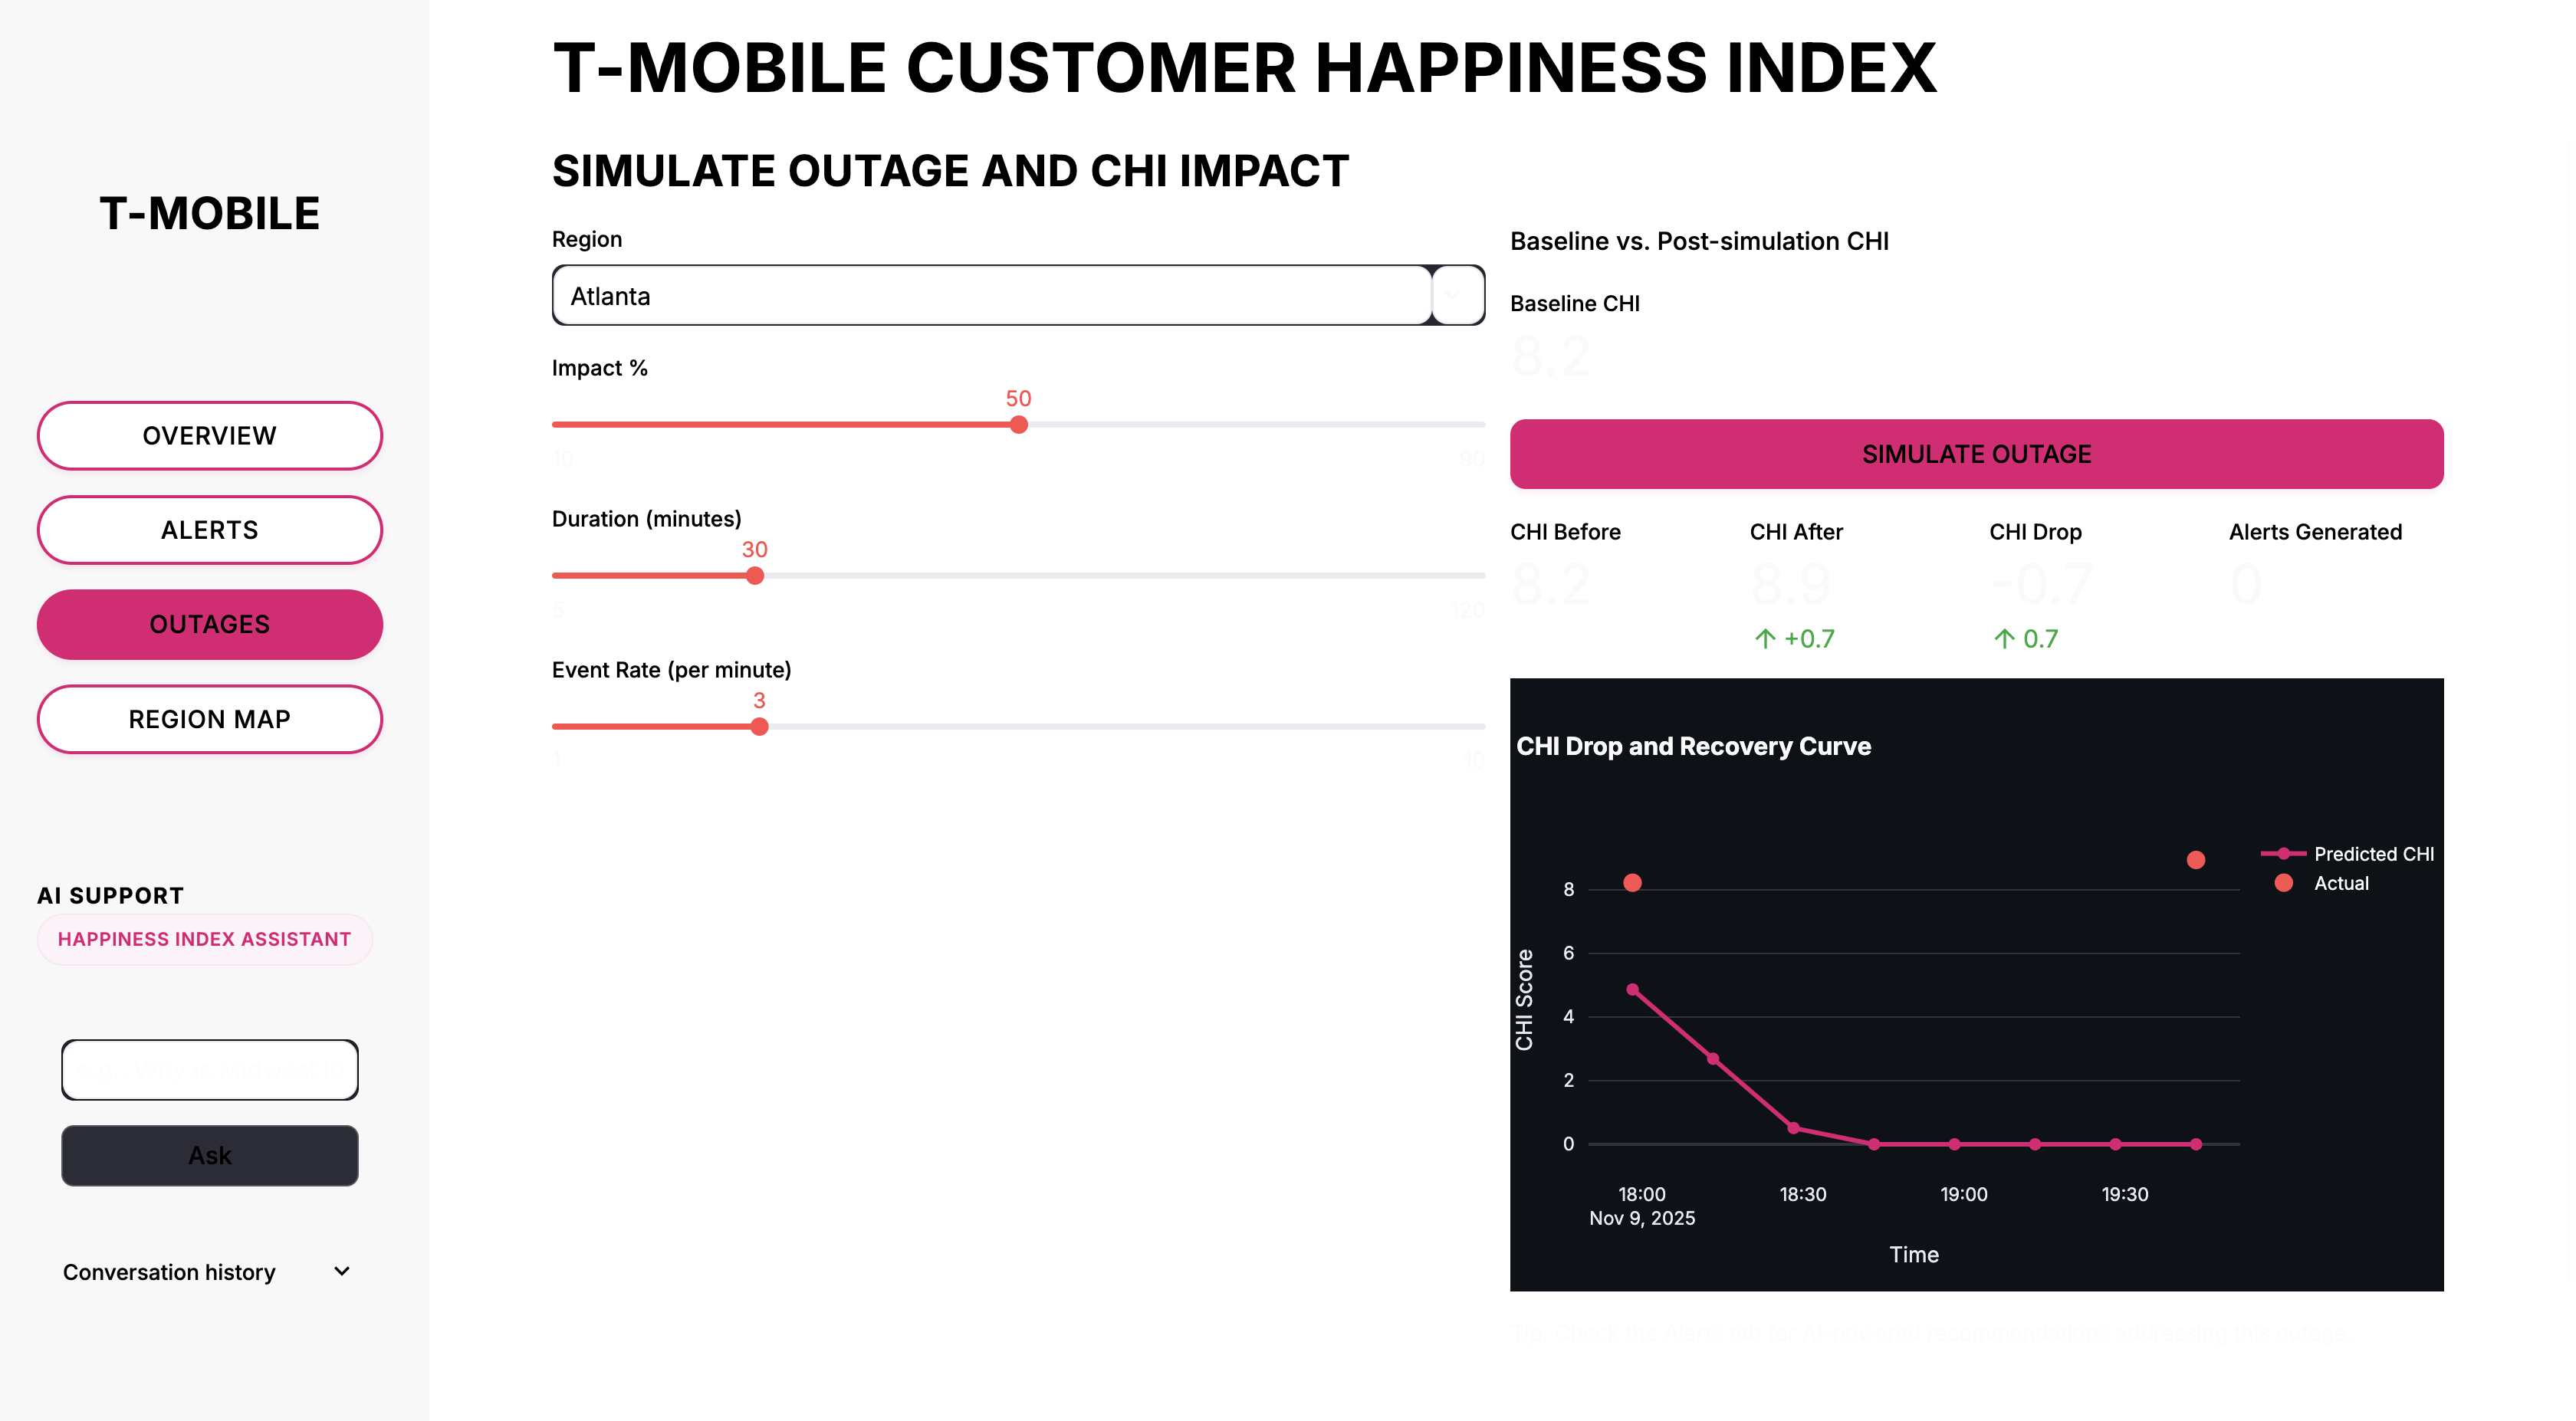
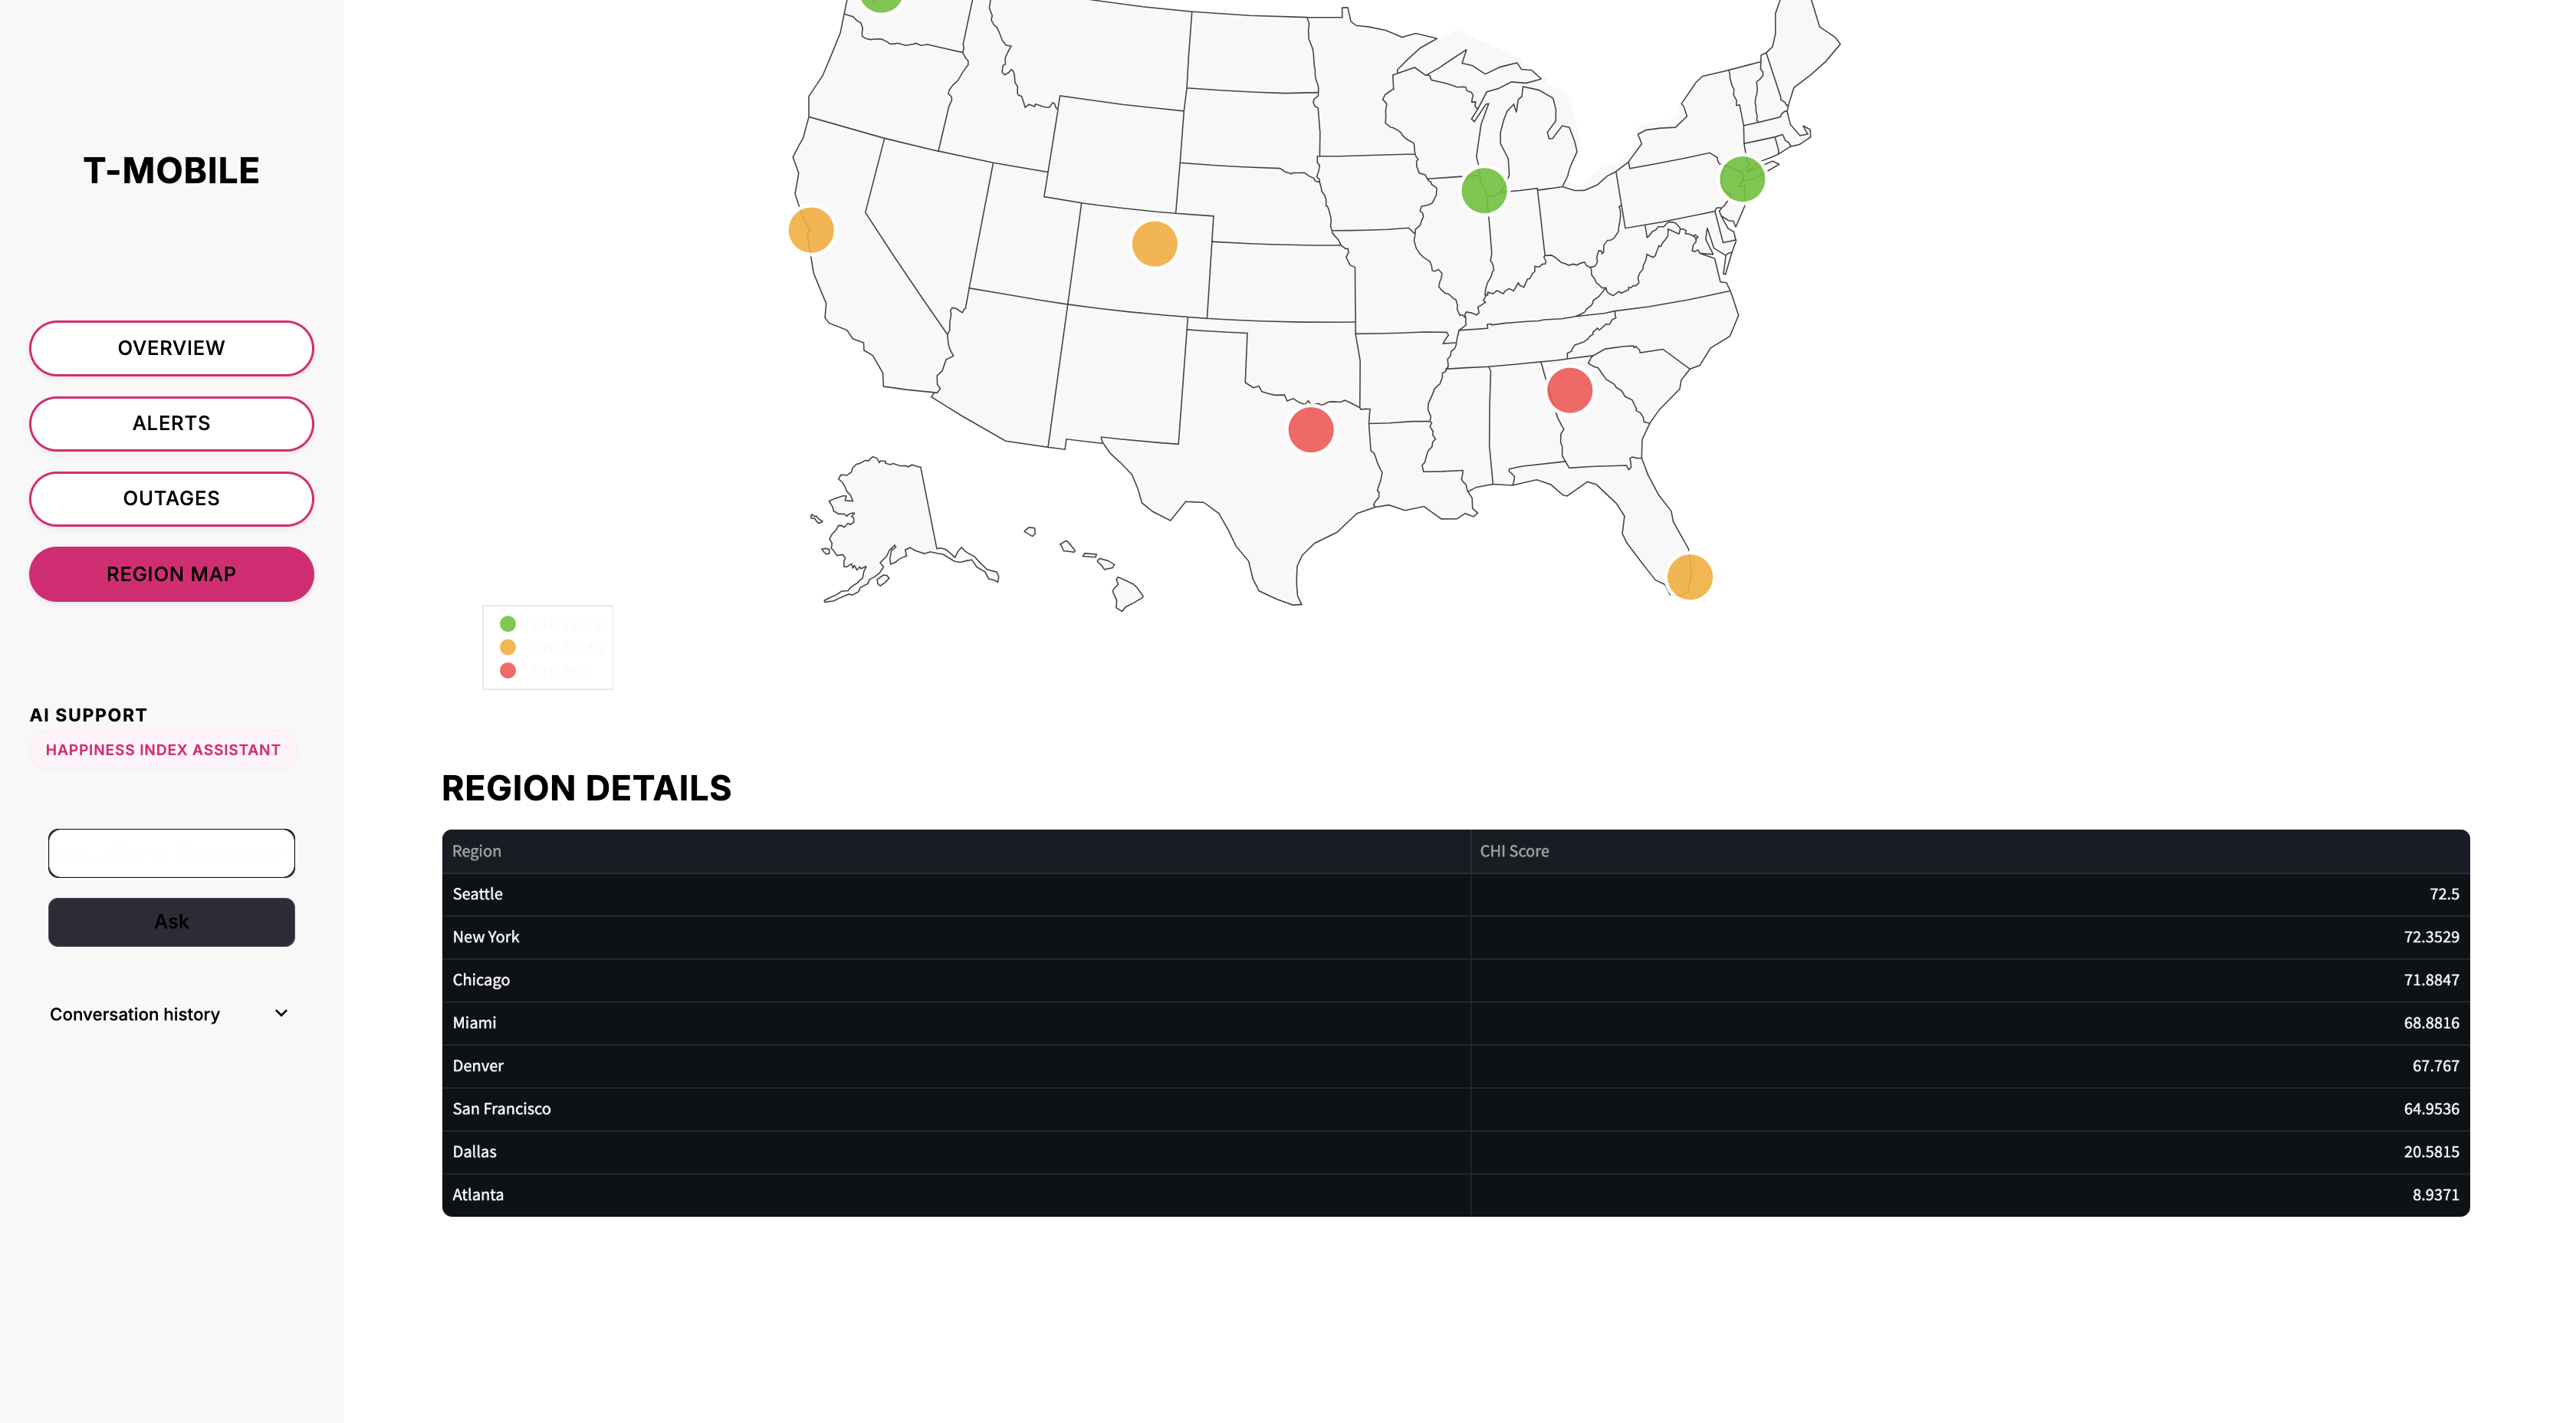
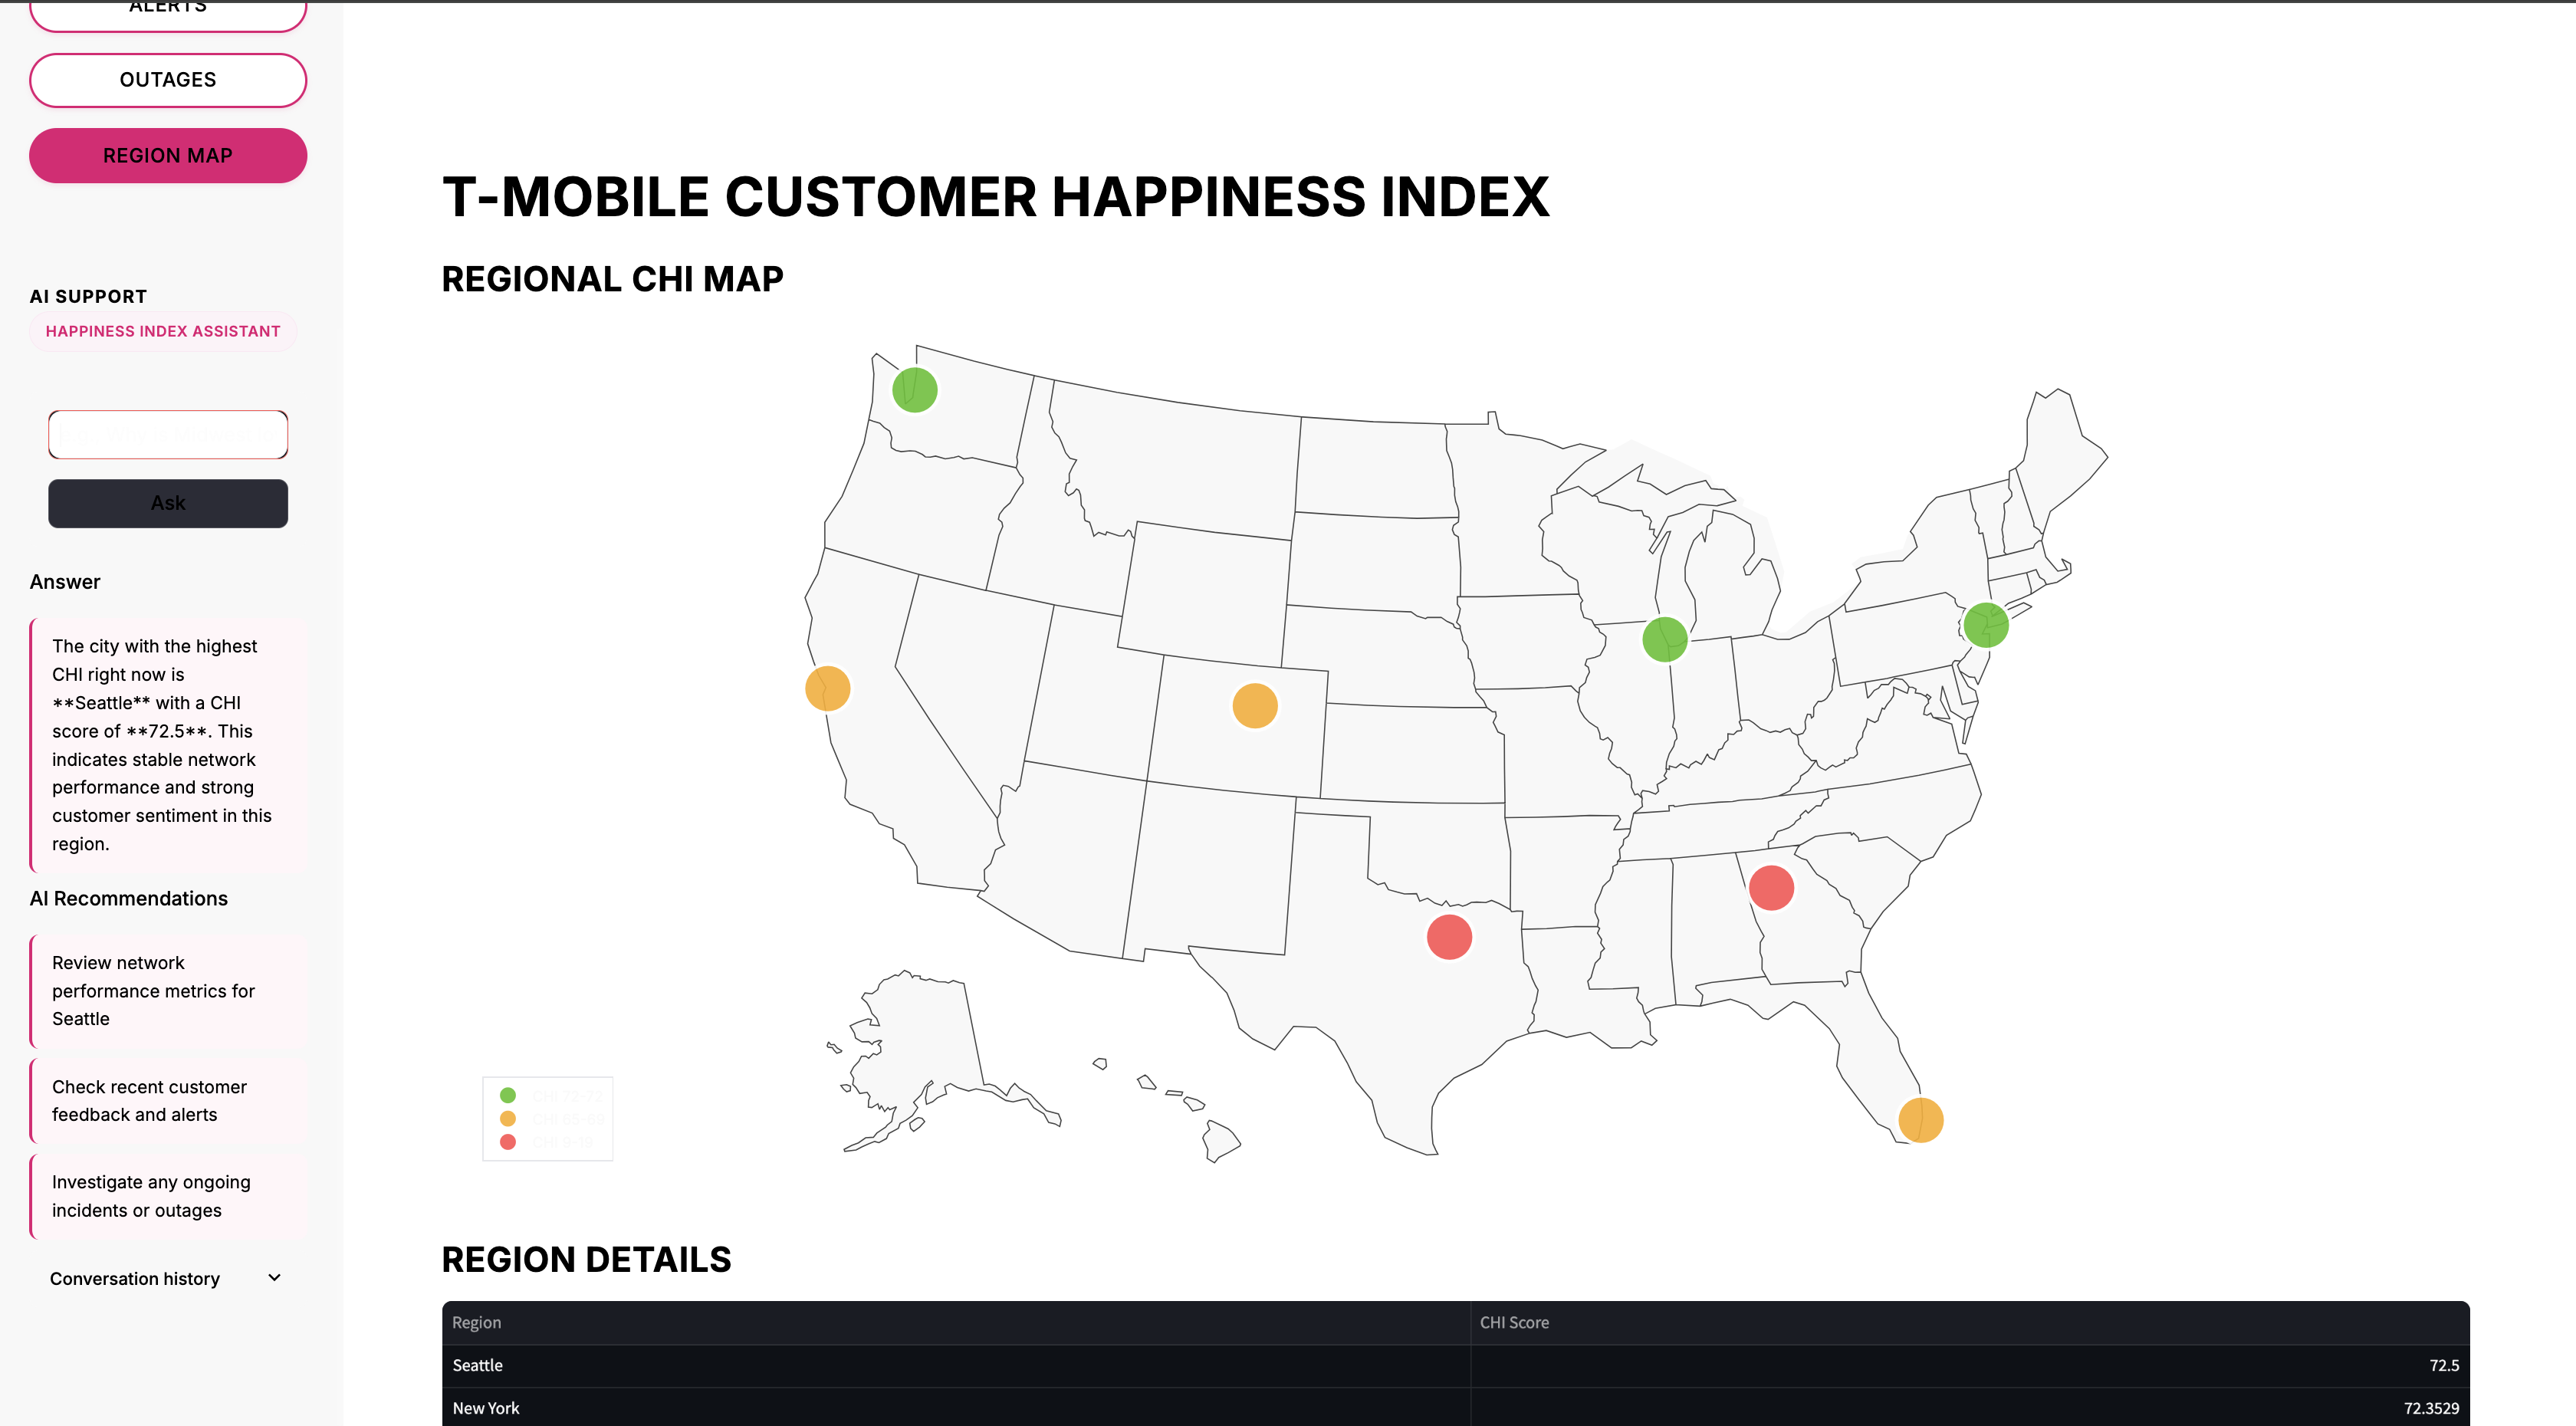
The T-Mobile Customer Happiness Index (CHI) platform provides: Regional CHI Monitoring: Displays customer happiness scores across 8 major US regions (Seattle: 72.5, New York: 72.3529, Chicago: 71.8847, Dallas: 70.565, Miami: 68.8816, Denver: 67.767, San Francisco: 64.9536, Atlanta: 28.9012) with an interactive map showing pink (CHI 71-72) and orange (CHI 57-69) markers. Outage Impact Simulator: Allows users to select a region (Atlanta), set duration (30 minutes), adjust impact percentage (59%), and configure event rate (3 per minute) to simulate outages and see predicted CHI impact. Impact Visualization: Shows before/after comparisons with a bar chart displaying CHI Before (56.8 in green) and CHI After (28.9 in red), along with CHI Drop (-27.9, representing a 49.1% decrease). Alert System: Tracks and displays alerts generated from outages, showing 3 total alerts, 3 in the last 24h, and 2 regions affected. Individual alerts show CHI drops (60.6→25.2, 72.5→34.3) with timestamps and topics: "outage, down, slow." Standard Recommendations: Provides actionable steps including "Investigate local towers," "Notify customers via SMS," and "Escalate to NOC if persists." AI Happiness Index Assistant: Conversational chatbot that answers questions like "Why is Midwest lower today?" with conversation history tracking. Anomaly Detection: Identifies shifts with 95% confidence at specific times (11:35 AM, 10:48 AM, 11:25 PM) for CHI drops related to "outage, down, slow" topics. Overview Dashboard: Shows Overall Customer Happiness Index of 68 (^Happy) and 59% positive sentiment from AI-driven analysis of call transcripts, chat logs, ticket notes, and overall CHI.
How we built it
Frontend Interface:
Clean navigation with Overview, Alerts, Outages, and Region Map sections T-Mobile branded design with magenta/pink color scheme Interactive US map with regional markers Bar charts and data visualizations for impact analysis Simulation controls with sliders and dropdown menus
CHI Calculation System:
Developed algorithm to compute happiness scores from 0-100 scale Real-time regional scoring across 8 metropolitan areas Impact calculation showing percentage drops and absolute changes
Alert Generation:
Automated detection of CHI drops >10 points and <60 threshold Timestamp tracking and reason categorization Multi-region monitoring with aggregated statistics
Simulation Engine:
Configurable parameters: region selection, duration, impact percentage, event rate Predictive modeling showing before/after states Visual feedback with green/red color coding
AI Integration:
Conversational assistant for querying CHI data Natural language processing for user questions Conversation history preservation
Challenges we ran into
Calibrating the CHI algorithm to accurately reflect customer happiness from outage data Creating realistic simulation parameters that match real-world outage scenarios Designing an interface that displays complex data clearly for both technical and non-technical users Building real-time alert detection that minimizes false positives while catching genuine issues
Accomplishments that we're proud of
Functional Outage Simulator: Successfully built a tool that predicts CHI impact - showing that a 30-minute outage in Atlanta drops CHI from 56.8 to 28.9 (49.1% decrease) and generates 1 alert. Comprehensive Regional Monitoring: Tracking 8 major regions with scores ranging from 28.9 (Atlanta - critical) to 72.5 (Seattle - excellent), providing a clear national overview. Intelligent Alert System: Detecting anomalies with 95% confidence and providing actionable recommendations automatically. Clean, Professional Interface: Built an intuitive dashboard with T-Mobile branding that makes complex data accessible through maps, charts, and clear metrics. AI Assistant Integration: Created a conversational interface that makes CHI data queryable through natural language.
What we learned
How to translate outage metrics into a unified customer happiness score The importance of visual data representation for quick decision-making Building simulation tools that provide predictive value for operations teams Creating alert systems that balance sensitivity with actionability Designing dashboards that serve multiple user types (engineers, managers, executives)
What's next for T-Pulse
Expand Regional Coverage: Add more cities and drill down to neighborhood-level CHI tracking across all T-Mobile service areas. Enhanced Data Sources: Integrate call center transcripts, social media sentiment, app reviews, and NPS scores for more comprehensive CHI calculations. Predictive Analytics: Build machine learning models to forecast CHI trends and predict potential outages before they impact customers. Automated Response Workflows: Trigger customer notifications, generate support tickets, and escalate issues automatically when CHI thresholds are breached. Historical Trend Analysis: Add time-series visualizations to track CHI changes over days, weeks, and months to identify patterns. Mobile App: Create a mobile version for on-call engineers to monitor CHI and respond to alerts from anywhere. Integration with Network Operations: Connect directly to T-Mobile's NOC systems for real-time network data and automated incident response.
Built With
- downdetector
- fastapi
- numpy
- pandas
- plotly
- pydeck
- python
- sqlalchemy
- streamlit
- uvicorn


Log in or sign up for Devpost to join the conversation.